connected by radiative decay
A. Marsman, M. Horbatsch and E.A. Hessels∗Department of Physics and Astronomy, York University, Toronto, Ontario M3J 1P3, Canada (Dated: September 19, 2017)
The resonant line shape from driving a transition between two states,|aiand|bi, can be distorted due to a quantum-mechanical interference effect involving a resonance between two different states, |ciand|di, if|cihas a decay path to|aiand|dihas a decay path to|bi. This interference can cause a shift of the measured resonance, despite the fact that the two resonances do not have a common initial or final state. As an example, we demonstrate that such a shift affects measurements of the atomic hydrogen 2S1/2-to-2P1/2Lamb-shift transition due to 3S-to-3P transitions if the 3S1/2 state has some initial population.
PACS numbers: \pacs{32.70.Jz,06.20.Jr}
I. INTRODUCTION
Recently, the effect of quantum-mechanical interfer-ence on precision measurements has been investigated by the present authors [1–6] and by others [7–16]. These in-vestigations indicate that interference with a neighboring resonance, even if it is very distant, can lead to significant shifts for precision measurements. All of the investiga-tions involve the interference between a pair of resonances that have a common initial state. Here we investigate the interference between two resonances that do not have a common initial state, nor a common final state. We find that an interference between two such resonances exists if the four states are connected by radiative decay, and this interference causes a shift of the measured resonance center.
We explore the implications of this type of effect on the precision measurement of the atomic hydrogen 2S1/2 -to-2P1/2 Lamb shift, which was measured by Lundeen and Pipkin [17] some time ago, and is currently being remea-sured by our group. We find that a shift in this mearemea-sured resonance can be present if there is an initial population in the 3S1/2state, due to interference between the 2S1/2 -to-2P1/2resonance and the 3S1/2-to-3P resonances. The hydrogen Lamb-shift measurement has become impor-tant since it can, when compared to very precise theory [18], determine the charge radius of the proton. More precise determinations of this radius have now been per-formed using muonic hydrogen [19, 20], but there is a large discrepancy between measurements made using or-dinary hydrogen and muonic hydrogen. This discrepancy has become known as the proton size puzzle [21–23].
II. FOUR-LEVEL SYSTEM
We first consider a four-level system consisting of states
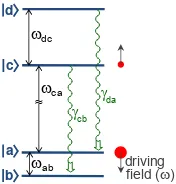
|ai, |bi, |ci, and |di, as shown in Fig. 1. An electric
driving field ()
cb
a
b c d
ab
dc
da ≈ca
FIG. 1. (Color online) Energy-level diagram for a four-level system. States|ci and |di radiatively decay to|bi and |ai, respectively. When driving the|ai-to-|bitransition, any pop-ulation in|cican be driven (by far-off-resonance radiation) to |di. An interference between the|ai-to-|biand|ci-to-|di tran-sitions, as described in the text, leads to a distortion of the line shape, and a shift of the|ai-to-|biresonance line center.
fieldE~(t) =E0zˆcos(ωt+φ) drives the|ai-to-|bi electric-dipole transition, depleting the initially populated |ai
state. The two other states,|ci, and|di, are also assumed to be connected by an electric-dipole matrix element, but the transition between these two states is far out of res-onance with E~(t). Since |di decays radiatively to |ai, any initial population in|cithat is weakly driven by the off-resonant field to|dislightly enhances the population of the|aistate. A more efficient method of transferring population from |ci to |ai involves an interference be-tween the on-resonant|ai-to-|bitransition amplitude and the off-resonant|ci-to-|ditransition, which is possible be-cause of the radiative decay from a coherence between|ci
and|dito a coherence between|aiand|bi. The relevant equations for the density matrix for the four-level system are
˙
ρaa=iVab∗ρab−iVabρba+γdaρdd, (1a) ˙
ρbb=iVabρba−iVab∗ρab+γcbρcc, (1b) ˙
ρba=iωabρba+iVab(∗ ρbb−ρaa)±√γdaγcbρcd, (1c) ˙
ρcc=iVcd∗ρcd−iVcdρdc−γcbρcc, (1d) ˙
ρdd=iVcdρdc−iVcd∗ρcd−γdaρdd, (1e)
˙
ρcd=iωdcρcd+iVcd(ρcc−ρdd)−
γda+γcb
2 ρcd, (1f)
where Vij(t) =hi| e ~E(t)·~r |ji/~, and Fig. 1 shows the
energy separations,~ωij, and decay rates,γij. Of
partic-ular interest in these equations is the square-root term, which allows for the coherence between|ciand|dito be transferred via radiative decay to a coherence between
|aiand |bi. This term [24] is often incorrectly omitted in the treatment of density matrices. The sign of the term depends on the relative sign of the a-to-d and b-to-c matrix elements that are responsible for the radiative decay.
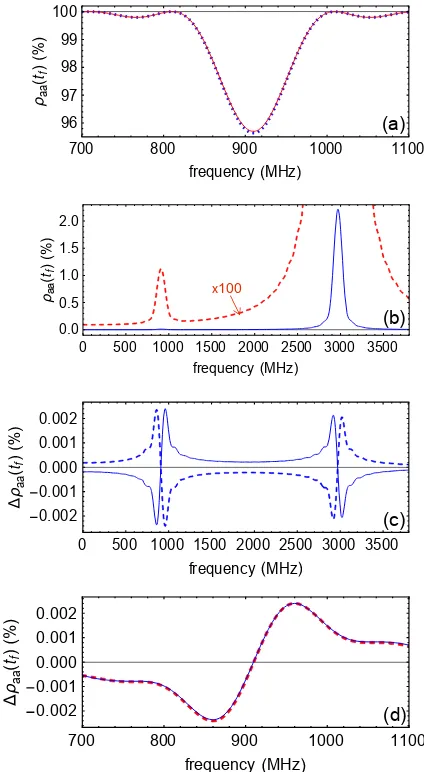
Figure 2 shows the results of integrating Eq. (1) from
t=0 tot=tf for one choice of the parameters of Eq. (1),
with an initial population in |ai (ρaa(0)=1, Fig. 2(a)) and with an initial population in|ci(ρcc(0)=1, Fig. 2(b) and (c)). The line shapes are averaged over the phaseφ
of the driving field. An initial population in|aileads to a simple resonance atf=ωab2π, as shown in Fig. 2(a). For
the small value ofE0used, it is well approximated by the perturbative expression
An examination of Eq. (1) reveals that the three lowest-order routes for an initial population in|cito get to state|aiare
ρcc→ρcd, ρdc→ρdd→ρaa, (3a)
ρcc→ρbb→ρba, ρab→ρaa, (3b) andρcc→ρcd, ρdc→ρba, ρab→ρaa. (3c)
Eq. (3a) leads to a resonance centered at f=ωdc2π, and
such a resonance is clearly seen in Fig. 2(b). When the scale is expanded by a factor of 100 (dashed line in Fig. 2(b)), the smaller resonance atf=ωab2π caused by Eq. (3b) is visible.
The result shown in Fig. 2(b) is calculated by artifi-cially suppressing the square-root term in Eq. (1c). The additional effect of this term is shown in Fig. 2(c), with the solid curve showing the result for the positive sign of this term and the dashed curve for the negative sign. These curves show the effect due to Eq. (3c). For the small values of theV andγ parameters used for Fig. 2, the effect of the square-root term can be approximated by the perturbative expression A comparison (for the positive choice of sign) of this per-turbative expression to the full result of Fig. 2(c) is shown in Fig. 2(d).
Figure 2 shows that the measurement of the line center of the|ai-to-|bi resonance can be affected by a popula-tion in|ci. A small distortion and shift of the |ai-to-|bi
resonance results from the long tail of the resonance at
ωdc
2π (as seen by the dashed line in Fig. 2(b)), which leads
to a sloped background under the|ai-to-|biresonance of
700 800 900 1000 1100
96
0 500 1000 1500 2000 2500 3000 3500
0.0
0 500 1000 1500 2000 2500 3000 3500
0.002
700 800 900 1000 1100
0.002
Fig. 2(a). If|aiand|cistart with equal populations, the effect of this slope is to shift the|ai-to-|biresonance by only 0.4 kHz for the parameters used in the figure.
A larger shift results from the effect of Eq. (3c) (Fig. 2(c) and (d)). The dispersion line shape due to this interference effect, causes a shift of 33 kHz for the parameters used in Fig. 2. This shift is independent ofE0 for small values ofE0, since Fig. 2(a) and Fig. 2(c) both scale asE2
0below saturation, as can be seen from Eqs. (2) and (4). Examination of these equations at ∆ω=±π/tf
(points near half maximum) shows that the shift due to the effect of the interference can be approximated by
∆f =∓π8t1
The result is a shift that persists, even when extrapolated to zero intensity for the driving field. For higherE0, the shift becomes somewhat larger since the resonance be-ing measured saturates, while the distortion of Fig. 2(c) continues to increase.
III. SEPARATED OSCILLATORY FIELDS
Shifts are also found when the method of separated oscillatory fields (SOF) [25] is used for the measurement. For SOF measurements, a field of amplitude E0 and phaseφis present fromt=0 tot=tD, and a second field
of the same amplitude that is either in phase or out of phase by 180 degrees (φorφ+π) is present fromt=tS to
t=tS+tD. The SOF line shape is the difference between
the in-phase and out-of-phase signals.
Integrating Eq. (1) fromt=0 tot=tf=tD+tS for the
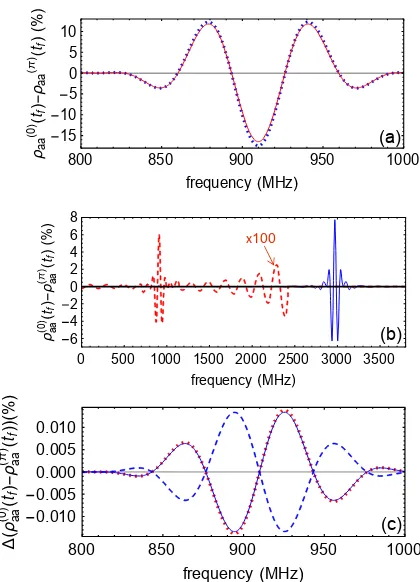
SOF fields for one choice of the parameters leads to the line shapes of Fig. 3. For an initial population in |ai, Fig. 3(a) shows that the final population exhibits a typi-cal SOF line shape. This line shape is well approximated by its perturbative expression as shown by the dotted line.
The line shape is distorted if there is any starting pop-ulation in |ci. The large feature centered at ω = ωdc in Fig. 3(b) is due to Eq. (3a), and the much smaller feature centered at ω =ωab results from Eq. (3b). The more important feature is due to Eq. (3c), and this inter-ference feature is shown separately in Fig. 3(c), for both the positive (solid) and negative (dashed) choices of sign in Eq. (1c). The perturbative expression
∓4√γcbγdaVabVcd
is a good approximation for the distortion for small E0, as shown by the dotted red line in Fig. 3(c).
The shifts caused by population in|cican be estimated using the central zero-crossing positions in Fig. 3(a).
800 850 900 950 1000
15
800 850 900 950 1000
0.010
0 500 1000 1500 2000 2500 3000 3500
6
FIG. 3. (Color online) Line shapes for a four-level system us-ing separated oscillatory fields. Initial population in|aileads to a typical SOF line shape, (a), that is well approximated by a perturbative expression (dotted line). Initial population in|ci(b and c) leads to features due to the|ci-to-|di transi-tion (the large feature in (b)), due to the|bi-to-|aitransition (the smaller feature in (b), expanded by a factor of 100 in the dashed curve), and an interference between these two res-onances, as shown in (c) with both the positive (solid blue line) and negative (dashed blue line) sign choices in Eq. (1c). The perturbative approximation (Eq. (7)) for the positive sign is shown by the dotted red line. When measuring the line cen-ter of the resonance in (a), a population in state|cican cause a shift in this resonance due to the dispersion line shape of (c). For these plots, the parameters used are as in Fig. 2, with
tD=10 ns, andtS=15 ns.
Using this method, the effects of Eq. (3a) and (3b) (Fig. 3(b)) lead to a shift of +1.3 kHz for the param-eters used in the figure, and the effect of the interfering term, Eq. (3c) (Fig. 3(c)), leads to a shift of∓9.3 kHz. From an examination of Eqs. (6) and (7), it can be seen that this shift is given by
∆f =∓1
As in Section II, for smallE0, the shifts are independent of field strength, and therefore the shifts persist even in the limit of zero field. Both Eq. (5) and Eq. (8) show that the scale of the shift is
times the width of the resonance.
IV. THE H(n=2) LAMB SHIFT
The interference effects described in the previous sec-tions will affect a precision measurement of the n=2 Lamb shift, if any population is present in higher-n
states. For hydrogen atoms created by charge exchange, as in Ref. [17] and our ongoing measurement, the 3S state has the largest charge-exchange cross section for states withn>2. For a 50-keV proton beam, the ratio of the charge-exchange cross sections [26] for the 3S1/2 and 2S1/2 states is approximately 0.34.
To illustrate the effect of the previous sections with a more concrete example, we calculate the shift that would be caused in the SOF measurement of the 2S1/2-to-2P1/2 Lamb-shift interval of Ref. [17], if the experiment starts with a relative 3S-to-2S population ratio of 0.34. We em-phasize that the population in the 3S state could be dif-ferent for the actual measurement of Ref. [17] (for exam-ple, due to multiple collisions during charge exchange), and also that other high-n states could shift the mea-sured resonance. The calculation here, however, sets a scale for possible shifts.
The calculation performed includes all states forn=1, 2, and 3. These include all hyperfine states (all values of quantum number f) and all sublevels (all values of
mf), for a total of 56 states. Thus, Eq. (1) must be
expanded to 562
=3136 equations. These equations have been numerically integrated through a trajectory that takes 400 ns to traverse. The fields along this trajectory are those identified as configuration 1 in Ref. [27]. As sug-gested in that reference, a trajectory that is 1.265 mm from the axis is used (as this distance is the root-mean-squared distance from the axis for the extended beam of atoms in that work). The off-axis trajectory leads to two components of the electric field, with the largest com-ponent driving ∆mf=0 transitions and the smaller
com-ponent driving ∆mf=±1 transitions. The fields do not
turn on and off suddenly, as was assumed in Section III, but rather follow the more realistic profiles described in Ref. [27].
The 400-ns trajectory includes a 35-ns-long prepara-tion field at 1110 MHz (which depletes the 2S f=1 population), two 10-ns-long fields to perform the SOF measurement of the 2S1/2(f=0)-to-2P1/2(f=1)
transi-tion (with the centers of these fields separated by 15 ns), and a 10-ns-long field at 910 MHz used to quench the remaining 2S population by mixing the 2S state with the quickly-decaying 2P state. As in Ref. [27], the amplitudes used for these fields are 26, 11.4, and 11 V/cm, respec-tively. As in the experiment, the n=2-to-n=1 radiative decay (Lyman-α fluorescence) is monitored during the quench field. The calculation is repeated for different phases of each of these fields, and averaged over these phases, as well as taking the difference between the in-phase and 180-degree-out-of-in-phase signals for the SOF
800 850 900 950 1000
5
800 850 900 950 1000
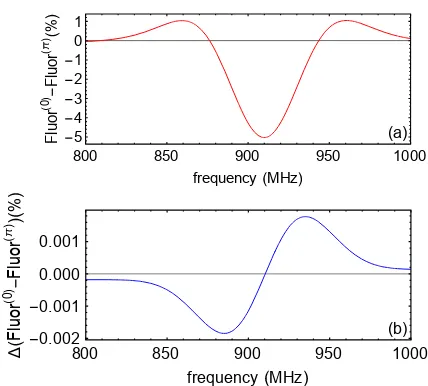
0.002 2P1/2 atomic hydrogen Lamb-shift measurement. The full line shape for the Lyman-αfluorescence predicted for an ini-tial population of 1.0 divided equally among the four 2S1/2 states and a population of 0.34 divided equally among the four 3S1/2 states is shown in (a). This line shape includes a small distortion due to the fact that coherences between 3S and 3P states can radiatively decay into coherences between 2S and 2P states. The difference between the calculations with and without this decay of coherences for the SOF measurement are shown in (b). The dispersion in (b) is due to the same effect as that shown in Fig. 3(c). The distortion in (b) causes a shift of approximately -9.5 kHz.
fields. The signals (based on Lyman-α fluorescence in-duced by the quench fields) are calculated for a range of frequencies for the SOF fields.
of Ref. [17] to compensate for this shift if only the 3S state were present, and if its population relative to the 2S state were 0.34. However, to calculate the full shift, a similar analysis would also have to be performed for higher-nstates, and precise knowledge of the populations in each of then >2 states would be necessary. It is not possible to infer these populations to a sufficient level of accuracy from Refs. [17] and [27]. The calculation pre-sented here does, however, conclude that the correction can be expected to be on the 10-kHz scale.
The calculation presented in this section is far more complicated than the simple four-level model of Sec-tion III, but the physics dominating the calculated shifts remains the same. The parameters used for Figs. 2 and 3 correspond to the four-level system consisting of
|2S1/2, f= 0, mf= 0i, |2P1/2, f= 1, mf= 0i, |3S1/2, f= 0, mf=0i, and|3P3/2, f=1, mf=0i. The full calculation
extends this four-level model to include all of the states forn=1, 2 and 3, which allows for more decay channels, for more coherences, and for more interfering resonances. The 10-kHz scale of this interference shift makes it im-portant, since the SOF measurement of Ref. [17] has a precision of 9 kHz, and the discrepancy between this mea-surement and the interval calculated [28] using the new, more accurate measurement of the proton charge radius from muonic hydrogen [19, 20] is 13 kHz. The ongoing
Lamb-shift measurement by our group has a precision goal of a few kHz, and, therefore, these shifts will have to be considered very carefully.
V. SUMMARY
We have identified a new systematic effect important to precision measurements. The effect allows for an inter-ference between two resonant transitions that do not have a common initial nor final state, but, rather, have states connected by radiative decay. The interference causes a line-shape distortion and a shift for the precision mea-surement. We find that this effect is large enough to have an important impact on the existing [17] and on-going measurements of the hydrogen n=2 Lamb shift. As such, they may contribute to the current discrepancy [21–23] between muonic and electronic measurements of the proton radius.
VI. ACKNOWLEDGEMENTS
This work is supported by NSERC and CRC and used SHARCNET for computation.
[1] M. Horbatsch and E. A. Hessels, Phys. Rev. A82, 052519 (2010).
[2] M. Horbatsch and E. A. Hessels, Phys. Rev. A84, 032508 (2011).
[3] A. Marsman, M. Horbatsch, and E. A. Hessels, Phys. Rev. A 86, 012510 (2012).
[4] A. Marsman, M. Horbatsch, and E. A. Hessels, Phys. Rev. A 86, 040501 (2012).
[5] A. Marsman, E. A. Hessels, and M. Horbatsch, Phys. Rev. A 89, 043403 (2014).
[6] A. Marsman, M. Horbatsch, and E. A. Hessels, Phys. Rev. A 91, 062506 (2015).
[7] C. J. Sansonetti, C. E. Simien, J. D. Gillaspy, J. N. Tan, S. M. Brewer, R. C. Brown, S. Wu, and J. V. Porto, Phys. Rev. Lett.107, 023001 (2011).
[8] R. C. Brown, S. J. Wu, J. V. Porto, C. J. Sansonetti, C. E. Simien, S. M. Brewer, J. N. Tan, and J. D. Gillaspy, Phys. Rev. A87, 032504 (2013).
[9] C. J. Sansonetti, C. E. Simien, J. D. Gillaspy, J. N. Tan, S. M. Brewer, R. C. Brown, S. J. Wu, and J. V. Porto, Phys. Rev. Lett.109, 259901 (2012).
[10] P. Amaro, B. Franke, J. J. Krauth, M. Diepold, F. Fratini, L. Safari, J. Machado, A. Antognini, F. Kottmann, P. Indelicato, R. Pohl, and J. P. Santos, Phys. Rev. A92, 022514 (2015).
[11] D. C. Yost, A. Matveev, E. Peters, A. Beyer, T. W. H¨ansch, and T. Udem, Phys. Rev. A90, 012512 (2014). [12] P. Amaro, F. Fratini, L. Safari, A. Antognini, P. Indeli-cato, R. Pohl, and J. P. Santos, Phys. Rev. A92, 062506 (2015).
[13] A. A. Buchheit and G. Morigi, Phys. Rev. A94, 042111 (2016).
[14] H. Fleurbaey, F. Biraben, L. Julien, J.-P. Karr, and F. Nez, Phys. Rev. A95, 052503 (2017).
[15] G.-P. Feng, X. Zheng, Y. R. Sun, and S.-M. Hu, Phys. Rev. A91, 030502 (2015).
[16] G.-W. Truong, J. D. Anstie, E. F. May, T. M. Stace, and A. N. Luiten, 6(2015).
[17] S. R. Lundeen and F. M. Pipkin, Phys. Rev. Lett.46, 232 (1981).
[18] For an overview of measurements of the hydrogen Lamb shifts and theoretical predictions, see Refs. [28] and [29]. [19] R. Pohl, A. Antognini, F. Nez, F. D. Amaro, F. Biraben, J. M. Cardoso, D. S. Covita, A. Dax, S. Dhawan, L. M. Fernandes,et al., Nature466, 213 (2010).
[20] A. Antognini, F. Nez, K. Schuhmann, F. D. Amaro, F. Biraben, J. M. Cardoso, D. S. Covita, A. Dax, S. Dhawan, M. Diepold,et al., Science339, 417 (2013). [21] J. C. Bernauer and R. Pohl, Scientific American310, 32
(2014).
[22] R. Pohl, R. Gilman, G. A. Miller, and K. Pachucki, Annual Review of Nuclear and Particle Science63, 175 (2013).
[23] C. E. Carlson, Progress in Particle and Nuclear Physics
82, 59 (2015).
[24] D. A. Cardimona and C. R. Stroud, Phys. Rev. A27, 2456 (1983).
[25] N. F. Ramsey, Phys. Rev.76, 996 (1949).
[26] R. H. Hughes, C. A. Stigers, B. M. Doughty, and E. D. Stokes, Phys. Rev. A1, 1424 (1970).
[28] M. Horbatsch and E. Hessels, Physical Review A 93, 022513 (2016).
[29] P. J. Mohr, D. B. Newell, and B. N. Taylor, Journal of Physical and Chemical Reference Data 45, 043102