General Senior Secondary Education
Financing in Indonesia
General Senior Secondary Education Financing
in Indonesia
Published by:
Education Sector Analytical and Capacity Development Partnership (ACDP)
Agency for Research and Developments (Balitbang), Ministry of Education and Culture Building E 19th Floor
Jl. Jendral Sudirman, Senayan, Jakarta 10270 Tel: +62-21-578-511000, Fax: +62-21-578-51101 Website: www.acdp-indonesia.org
Secretariat Email: [email protected]
Printed in September 2013
The Government of Indonesia (represented by the Ministry of Education and Culture, the Ministry of Religious Affairs, and the Ministry of National Development Planning / BAPPENAS), the Government of Australia, through Australian Aid, the European Union (EU) and the Asian Development Bank (ADB) have established the Education Sector Analytical and Capacity Development Partnership (ACDP). ACDP is a facility to promote policy dialogue and facilitate institutional and organizational reform to underpin policy implementation and to help reduce disparities in education performance. The facility is an integral part of the Education Sector Support Program (ESSP). EU’s support to the ESSP also includes a sector budget support along with a Minimum Service Standards capacity development program. Australia’s support is through Australia’s Education Partnership with Indonesia. This report has been prepared with grant support provided by AusAID and the EU through ACDP.
EUROPEAN UNION KEMENTERIAN PENDIDIKAN
DAN KEBUDAYAAN KEMENTERIANAGAMA BAPPENAS
The institutions responsible for producing this report were Cambridge Education, Indonesia in cooperation with the SMERU Research Institute.
The members of the study team who prepared this report were: 1. Edy Priyono, Researcher
2. Vita Febriany, Researcher
Table of Contents
4. Service Standards and Financing Implications 18
4.1 Service Standards 18
4.2 Financing Implications 20
4.3 Responsibilities for Financing Senior Secondary Education 21
5. Initiatives to Increase Senior Secondary School Participation 23
5.1 Central Government Initiatives 23
5.2 Provincial Government Initiatives 24
5.3 District Government Initiatives 24
5.4 School Initiatives 25
6. Policy Options for Expansion of Senior Secondary Education 26
6.1 Provision of Infrastructure 27
6.2 Provision of Operational Funds for SMAs (the BOS Model) 27
6.3 Increasing Efficiency 28
6.4 Engaging with the Private Sector 30
6.5 Provision of Teachng and Learning Materials 31
6.6 Financial Assistance to Poor Students 31
6.7 Next Step: Financing Scenarios 33
Table of Contents
List of Tables
Table 2.1: Qualitative and quantitative approaches to the terms of reference 5 Table 2.2: Selection stages of the location and study respondents 6
Table 2.3: Kabupaten, Schools and Households Visited/Surveyed 6
Table 3.1: School Survey Results for Non-salary Operational Costs, per student per year 8 Table 3.2: Number and Percentage of Non-PNS Teachers in the Study 9 Table 3.3: Standard Annual Operational Costs for Non Personnel 10 Table 3.4: School Revenue for Non-salary Operational Costs* from Various Sources (%) 11 Table 3.5: Categories of Direct and Indirect Costs in the Present Study 13
Table 3.6: Direct and Indirect Costs Identified in the Household Survey 14
Table 3.7: The Proportion of High School Students Working 16
Table 3.8: Characteristics of work types (% students working) 16
Table 3.9: Distribution SMA Students from Grade 10 and SMP Graduates who did not continue
their education based on Household income level (% Respondents) 17
Table 3.10: Reasons why SMP graduates have not continued to SMA 17
Table 4.1: First Draft of Minimum Service Standards for SMA and a Comparison with those for SMP and MT 18 Table 4.2: Achievements in the First Draft of Minimum Service Standards for SMAs in 9 Study Schools* 19 Table 4.3: Minimum Service Standards Proposed for SMA 20 Table 6.1: Enrolments in SMA, SMK and MA 2003/04-2009/10 26 Table A.1: Selection stages of the location and study respondents 35 Table A.2: Kabupaten, Schools and Households Visited/Surveyed 36
List of Figures
Figure 3.1: Current Sources of Finance and their Uses 11
Figure 3.2: Median of Percentage of School Non-Salary Operational Cost from Various Sources 12
Figure 3.3: Contribution (%) by Type of Expense to Total Expenditure on Education 14
Figure 3.4: The cost considered most burdensome by households 15
Abbreviations
ACDP Education Sector Analytical and Capacity Development Partnership
APK Angka Partisipasi Kasar (Gross Enrolment Rate see GER)
APM Angka Partisipasi Murni (Net Enrolment Rate see NER)
ATS Alat Tulis Sekolah (stationary)
BAHP Bahan dan Alat Habis Pakai (Consumable supplies)
BAPPENAS Badan Perencanaan Pembangunan Nasional (National Planning Agency) BKMM Beasiswa Khusus Murid Miskin (scholarship forpoor student)
BOMM Bantuan Operasional Manajemen Mutu (Operational Assistance for Quality Management)
BOS Bantuaan Operasi Sekolah (School Operating Grants)
BPKB Buku Pemilik Kendaraan Bermotor(vehicle ownership book)
BPS Badan Pusat Statisik (Central Bureau of Statistics)
CCT Conditional Cash Transfer (performance linked payment mechanism)
CPDP Continuous Professional Development Programme
D4 Diploma 4
DBE1 Decentralized Basic Education Project (USAID) 2005-2011
ESC Education Service Contracting Program
Kabupaten District (Administrative entity within a Province)
Kota City/Town (Administrative entity within a Province)
KTSP Kurikulum Tingkat Satuan Pendidikan(School-Based Curriculum)
MA Madrasah Aliyah (Islamic Senior Secondary School)
MBS Manajemen Berbasis Sekolah (School-Based Management)
MDG Millennium development Goals
MI Madrasah Ibtidaiyah
MoEC Ministry of Education and Culture (Departemen Pendidikan dan Kebudayaan)
MORA Ministry of Religious Affairs (Departemen Agama)
MTs Madrasah Tsanawiyah (Islamic Junior Secondary School)
MSS Minimum Service Standards
NER Net Enrolment Rate (see APM)
NSE National Standard/s for Education
NTT Nusa Tenggara Timur
Abbreviations
OSIS Organisasi Siswa Intra Sekolah (Students Organization)
PACES Programa de Ampliación de Cobertura de la Educación Secundaria
(programprovided poor children with vouchers that covered half the cost of
private secondary school in Colombia)
PEF Punjab Education Foundation
Pemda Pemerintah Daerah (Regional Government)
Permendiknas Peraturan Menteri Pendidikan Nasional (National Ministry of Education Regulation)
PNS Pegawai negeri Sipil (civil servants)
PPP Public Private Partnership
RAPBS Rencana Anggaran Penerimaan dan Belajar Sekolah (School Budget Plan)
Renstra Rencana Strategis (Strategic Plan)
Rombel Rombongan Belajar (Study Groups)
RPP Rencana Pelaksanaan Pembelajaran (Teacher Teaching Plans)
RSBI Rintisan Sekolah Berstandar International (International Standard School)
S1 Strata 1 (Bachelor Degree)
S2 Strata 2 (Master Degree)
SD Sekolah Dasar (Primary School)
SGP Scholarships and Grants Program
SKM Surat Keterangan Miskin (Statement of Poverty)
SLTA Sekolah Lanjutan Tingkat Atas (general senior secondary school, vocational SSS and Islamic SSS)
SMA Sekolah Menengah Atas (Senior Secondary School)
SMAN Sekolah Menengah Atas Negeri (Public Senior Secondary School)
SMAS Sekolah Menengah Atas Swasta (Private Senior Secondary School)
SMERU Lembaga Penelitian (Research Institute)
SMK Sekolah Menengah Kerjuruan (Vocational Senior Secondary School)
SMP Sekolah Menengah Pertama (Junior Secondary School)
SPN Satndar Pendidikan Nasional (National Education Standard)
SU Sekolah Unggulan (Seeded School)
SPM Standar Pelayanan Minimal (Minimum Services Standards)
Swasta Private/non-State (SMAS is a Private SMA)
Take-home Survey form which students “take home”, complete and return to school
Executive Summary
This report examines the policy options and financial implications of the expansion of senior secondary education in Indonesia. The government wishes to increase the gross enrolment rate from 70% to 85% by 2014 and aims for universal 12-year education by 2019.
The approach adopted has been to: analyse current costs and funding arrangements through fieldwork and a review of secondary sources; consider the financing implications of achieving a set of minimum standards; review the current government funding provision; and examine a range of policy options for the expansion of senior secondary enrolments.
The current funding of government senior secondary education is complex and varies throughout the country. It involves different levels of government providing financial support for infrastructure, salaries and operational costs. A common feature of the senior secondary sub-sector is its dependence on parental contributions. This has implications for school quality and for equity. The government’s policy of designating some schools as ‘international standard secondary schools’ (RSBI) has inadvertently adversely affected equity.
The study found considerable variation in the levels of cost and the amounts of available revenue among state senior secondary schools (SMA), with the RSBI being far better resourced than the rest. Salaries of government service teachers (PNS) are the responsibility of government. Those of teachers without PNS status, who are numerous in some schools, have to be paid for from other sources and almost invariably these costs fall on parents. The burden on parents comes in various forms. There are direct charges for fees and registration books and uniforms and there are indirect costs of transport and meals. There are also high opportunity costs of sending children to senior secondary school to set against the perceived returns of this level of schooling.
As there are no agreed minimum service standards for SMA, the study constructed a set of standards based on those adopted for primary and junior secondary schools, adapted them in the light of discussions in the field and assessed sample schools against these standards. There were a number of areas in which schools fell short of the standards, particularly in the provision of textbooks and the certification of teachers. The study then considered the financial implications for schools of meeting them.
In seeking a more rational funding arrangement for senior secondary education, a number of important policy issues were raised. These concern the relative responsibilities of different levels of government for senior secondary education and the nature and magnitude of parental contributions. These issues need to be addressed in the knowledge that Government finances are limited and that decisions need to be made on the “desired” level of user charges, because the private returns to this level of education are high. Such decisions will have implications for social policy and the government’s stated intention of extending access to all. It also raises questions about the efficacy of efforts to reduce the cost burden for poor families through selective government subsidies and other pro-poor schemes.
Executive Summary
The report outlines the efforts the various levels of government are making to support an expansion of senior secondary education. The central government is supporting investment in school building and subsidising operational costs through BOMM (grant assistance for quality and management) and an extension of per-capita school grants (BOS). It also promotes participation of poor students through scholarships (BKMM). District governments have introduced schemes to provide revenue to schools and reduce the burden of school fees. Some are also increasing enrolments through innovative school structures, such as the filial schools in Grobogan and Karawang.
Various policy options are explored for increasing participation in senior secondary schools and examples from international experience are provided. These options cover the need for greater supply of places, both for the currently projected rise in the number of children graduating from junior secondary schools and for an extra 260,000 children who will need to be enrolled if the 85% target is to be reached in the next two years. Reliance on school building to meet the challenge will not be sufficient, because of the very high costs involved and the limited time available. Other approaches are examined. These include structural innovations, such as the grouping of schools to reap economies of scale and overcome geographical obstacles. The filial schools model is one such example, but there are also other models in operation in other countries. These include the use of distance learning and the application of new technology.
Increased efficiency, particularly in the major cost item, the use of teachers, would be a source of major savings which would free up resources for expansion. In order to reap efficiency gains the government needs to look critically at student-teacher ratios, which are very low, and teachers’ time on task. Teacher absenteeism and the practice of having several jobs mean that unit costs are much higher than they need to be.
A further option for managing the expansion of enrolments lies in promoting closer partnerships with the private sector. There are precedents for this in Indonesia and examples of sucessful collaboration in the international experience. Possible interventions include government financial support and the provision of teachers to private schools.
While the focus of attention is on increasing access, it is equally important to consider ways in which the quality and relevance of senior secondary education can be enhanced. Perceptions of quality and relevance are in any case powerful determinants of demand.
Options for increasing demand, particularly among lower income groups, are explored. This is a process that will become harder as the enrolment rate rises and the target population includes increasingly poor and remote populations. Interventions include various forms of cash transfers and scholarships and there are international models from which valuable lessons can be learned. Critical to the success of such schemes is the accuracy of the targeting.
Executive Summary
1.1 Background
Having achieved significant increases in access to primary and junior high school education, the Government of Indonesia’s next priority is to increase access to Senior Secondary School education on an equitable basis.1 The Government’s Medium Term Plan (Renstra 2010-2014) has set a gross enrolment rate target of 85 per cent, and in 2010 the Government initiated the progressive introduction of compulsory 12-year education for all Indonesian children by 2019.
The current gross enrolment rate (GER) in senior secondary education is less than 70%.2 There are significant geographical differences in enrolment, with several provinces having participation rates of less than 55%. Gaps also exist between districts (Kabupaten/Kota) within provinces. Inequalities in resource allocation have resulted in a wide gap, both in access to general Senior Secondary Schools (SMA) and in the quality of these schools. The financing of senior secondary education in Indonesia is fragmented, with different sources of funds, not only between state and private schools but also between state schools.
For the majority of senior secondary schools around 80% of all operational fund goes to pay teachers’ salaries. This leaves limited funds for improvements in the quality of teaching and learning. This situation is exacerbated by the low financial capacity of regional governments and the low priority given to education in a number of Kabupaten/Kota. As a result, many state schools depend to a very large extent on contributions by parents.
This high level of dependence on parental contributions means that schools vary greatly because of the economic capacity of the families they serve. This is reflected in differences in the quality of teaching and learning. For poor families, the private costs of senior secondary education are major constraints on access. The opportunity cost of senior secondary education is greater than at the primary or the junior high school levels, because the income that is lost because the child continues to attend school is greater.3
There is also a significant supply side constraint on access to senior secondary schools. In many poor and/ or remote areas, no local school is available. In such situations, the cost of education that parents must bear is greater because of the high cost of transport to reach the nearest school or the expense incurred if a child leaves home to live near a school. The limited number of schools in part explains the low participation rates in remote areas.
1 Senior Secondary School education includesSMA(Senior Secondary School), SMK (Senior Vocational School) and MA (Madrasah Aliyah religious schools).SMAand SMK are under the coordination of the Ministry of Education and Culture, while MA are under the coordination of the Ministry of Religious Affairs.
2 BPS Education Indicators 1994-2010 publication reports senior secondary GER in 2010 as 62.5%, with three Provinces below 55% and six more less than 60% GER. A comprehensive MoEC analysis of 2009/10 data including SMA/SMK/MA and Packet C reported national GER as 69.5%, with 4 Provinces below 60% and 9 between 60- 65%.
3 In official statistics the working age is 15 and over, which means that, unlike those in primary and junior high school, students in Senior
1. Introduction
Government efforts to improve the quality of education may have had the unintended consequence of reducing equity. Over the past three years, a number of government senior secondary schools (SMA) have become Rintisan Sekolah Bertaraf Internasional (International Standard Schools - RSBI). There are also ordinary SMA (non-RSBI) that receive large parental contributions to their funds, which places these schools above the average national level. These schools are known as Sekolah Unggulan. At the present time there are 363 SMA in the RSBI category and 132 SMA, which are Sekolah Unggulan. In addition to receiving an allocation of government funds greater than those given to ordinary schools, these schools have greater access to contributions of funds from parents.
The Government has encouraged RSBI schools to provide opportunities from children from poor families to access good quality education through scholarships. However, in practice, children from poor families encounter obstacles before they can enter an RSBI. As a result, only a few are able to enjoy a reduction in expenses through the scholarship mechanism. Much of the large subsidy given to the RSBI schools and Sekolah Unggulan would appear to benefit children from non-poor families.
1.2 Scope and Focus
The purpose of this assignment has been to examine the current situation and to provide options for the expansion of senior secondary education to 85% GER by 2015 and near universal coverage by 2019. The Terms of reference are set out in Appendix A. It looks for lessons that can be learned from the experience of Indonesia in increasing access to primary and junior secondary schooling and at international evidence of what works in contexts that are sufficiently analogous to provide useful learning.
The Study is focused on the following:
y The structure of finances for different types of state SMA (RSBI and non-RSBI), including specific
components of expenditure, namely, direct costs (costs to support teaching-learning activities) and
indirect costs (costs that have to be paid by students and/or their parents to register at the school and
to take part in learning activities).
y Various sources of finance for different types of SMA, including how the financial burden is distributed
among the government, parents, and the general community (and other sources).
y Development of simple service standards that are necessary for conducting the teaching-learning
process,based onNational Education Standards (SPN), with consideration of their funding implications. This analysis has been done through consultations with a wide variety of relevant parties: teachers; school principals; school supervisors; district education officials; and relevant units in the Ministry of Education and Culture. .
y Development of strategic options for nationwide expansion that take into account adequacy,
efficiency and equity
1. Introduction
2.1 Study Approaches
The study was carried out using methods that combine analysis of senior secondary school service suppliers (in this case the Government and the schools), as well as a demand-side analysis focusing on households with school-aged children. The study combined primary data analysis from tailor-made research instruments with secondary data analysis on participation rates, SMA-level school services data and poverty data, available from various central and regional agencies. The primary research component employed a combination of qualitative and quantitative methods. The qualitative methods involved in-depth interviews and focus group discussions (FGD), whereas the quantitative methods consisted of a household survey using a structured questionnaire.
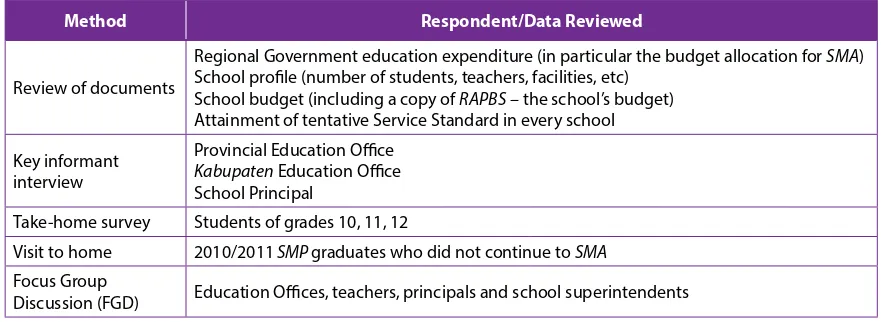
Table 2.1: Qualitative and quantitative approaches to the terms of reference
Method Respondent/Data Reviewed
Review of documents
Regional Government education expenditure (in particular the budget allocation for SMA) School profile (number of students, teachers, facilities, etc)
School budget (including a copy of RAPBS – the school’s budget) Attainment of tentative Service Standard in every school Key informant
interview
Provincial Education Office
Kabupaten Education Office School Principal
Take-home survey Students of grades 10, 11, 12
Visit to home 2010/2011SMPgraduates who did not continue to SMA
Focus Group
Discussion (FGD) Education Offices, teachers, principals and school superintendents
2.2 Primary Data Collection
The prime purpose of the research component of the study was to establish empirical evidence on the actual costs of senior secondary schooling.
Data collection in the Study was conducted at several levels: Province and Kabupaten; high schools; and households. An explanation of the data collection process at each level is outlined in Appendix B. The locations for the research were chosen through various stages. Provinces were chosen that had higher than average poverty rates (above 13.7%). After selecting the provinces, the selection of the Kabupaten was done using criteria of poverty and Gross Enrolment Rates (GER).
2. Methodology
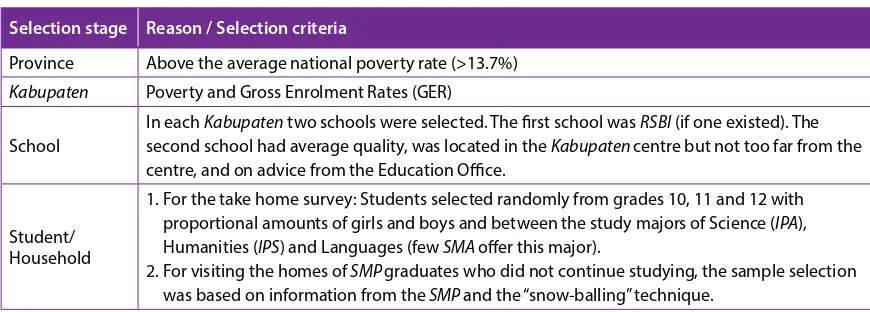
Table 2.2: Selection stages of the location and study respondents
Selection stage Reason / Selection criteria
Province Above the average national poverty rate (>13.7%)
Kabupaten Poverty and Gross Enrolment Rates (GER) School
In each Kabupaten two schools were selected. The first school was RSBI (if one existed). The second school had average quality, was located in the Kabupatencentre but not too far from the centre, and on advice from the Education Office.
Student/ Household
1. For the take home survey: Students selected randomly from grades 10, 11 and 12 with proportional amounts of girls and boys and between the study majors of Science (IPA), Humanities (IPS) and Languages (few SMAoffer this major).
2. For visiting the homes ofSMPgraduates who did not continue studying, the sample selection was based on information from the SMPand the “snow-balling” technique.
The field-work included eight Kabupaten in four provinces and in eachKabupaten,the team visited two to three schools, one of which wasSMA RSBI (unless in the area there was no high school in the RSBI category). In total, the Study team collected information on 17 high schools, five of which wereSMA RSBI. Table 2.3 below details the visits.
Table 2.3: Kabupaten, Schools and Households Visited/Surveyed
Province Kabupaten School RSBI Household/Student
Test trials
DKI Jakarta Kota Central Jakarta SMAN 68 Yes 100 take home
Jawa Barat Kabupaten Bogor SMAN 1 Cibinong Nil
Field Study
Jawa Tengah
Purbalingga
SMAN 1 Purbalingga Yes 100 take home
SMAN 1 Bukateja 100 take home 20
Household visits
Grobogan
SMAN 1 Purwodadi Yes 100 take home
SMAN 1 Toroh 100 take home 20
Household visits
Lampung
Lampung Tengah SMAN 1 Kota Gajah Yes 100 take home
SMAN 1 Gunung Singgih 100 take home
Pesawaran SMAN 1 Gedong Tataan * 100 take home
SMAN 2 Padang Cermin 100 take home
Nusa Tenggara Timur
(NTT)
Kota Kupang SMAN 3 Kupang** Yes 120 take home
Timor Tengah Selatan (TTS)
SMAN 1 Molo Selatan 120 take home
20 Household visits
SMAN 1 Soe Not carried out #
Sumba Timur SMAN 1 Waingapu *
60 take home 20 Household visits
SMAN 1 Haharu 60 take home
Jawa Barat Karawang
SMAN 1 Karawang Yes 100 take home
SMAN 4 Karawang Not carried out
SMAN 1 Teluk Jambe 100 take home
SMAS Korpri 100 take home
* SMAN1 Waingapu andSMAN1 Gedong Tataan are “Model Schools” and have sought to become RSBIschools. ** SMAN 3 in Kota Kupang was included as the only RSBI school in NTT Province.
2. Methodology
2.3 Method of Analysis
Estimated actual costs and revenues of schools were based on school budget documents (RAPBS). The study also sought information about additional funds that might be available to schools beyond those listed in the school budget, in order to obtain a complete picture of the overall school revenues and expenditures. Information needed to calculate the operational costs was collected through school surveys and backed up through interviews, so that profiles of the schools (including the number of students, teachers, classrooms, etc.) could be built up, and cross-referenced with school budget documents.
2.4 Limitations
This study was undertaken only in State SMAs, whereas senior secondary education includes State SMA, Private SMA, SMK (both State and Private) and MA (State and Private). The Study research team considered what occurs in Private SMA, SMK and MA, but the majority of the conclusions and recommendations are based on matters concerning State SMA.
The policy of regional autonomy, both directly and indirectly, has implications for this study. With decentralisation, management of senior secondary school education (and also primary level education) lies with local government (Kabupaten/Kota). In this situation, policy variations between regions are expected with implications for local in practices concerning the financing of education at the school level.
2. Methodology
3.1 Costs in Schools
This section considers aspects of the costs of education in senior secondary schools.
3.1.1 School Survey Results
Using the approaches outlined in chapter 2, the study team calculated schools’ non-salary operational expenses4. Results show that in the field there is no uniformity in the format of school budgets. Four different ways of classifying cost types in school budgets were identified and this makes analysis and comparisons between schools difficult. Some schools used the standard government budget classification. Others grouped costs in line with the categories in the National Education Standards. Yet others used activity-based classification. A fourth set of schools used their own esoteric formats that did not comply with any of the other models.
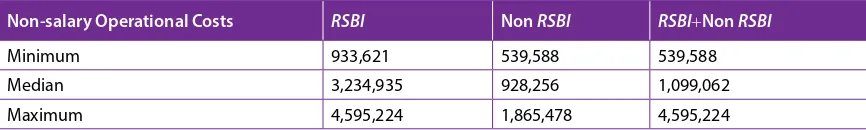
This lack of standardised ways of recording costs meant that researchers had to look at details of school expenditure one by one to filter out investment costs and staff salaries, so that non-salary operational cost components could be identified and their value calculated.5 Using this approach, Table 3.1 below shows
that for all State SMAs in this study, non-salary operational costs range from Rp 340,000 to Rp 4,595,000 per student per year, with a median of around Rp 1,099,000.
Table 3.1: School Survey Results for Non-salary Operational Costs, per student per year
Non-salary Operational Costs RSBI Non RSBI RSBI+Non RSBI
Minimum 933,621 539,588 539,588
Median 3,234,935 928,256 1,099,062
Maximum 4,595,224 1,865,478 4,595,224
The table separates the status of schools (RSBI and non-RSBI). It can be seen that RSBI schools spend more non-salary operational funds than non-RSBI schools. The main reason is that the RSBI schools have access to wider and more varied sources of finance than those available to non-RSBI schools. On average RSBI schools receive three times more operational (non-salary) funds from District governments than non-RSBI school. In addition, monthly fees and a one-off ‘entrance/registration’ fees in RSBI schools are always greater than in non-RSBI schools. In Karawang where the District government implements a “free education” policy in public SMAs, RSBI schools are exempted and therefore have additional fee income from parents.
4 Conceptually, the term “non-employee” differs a little from the term “non-salary”. “ Non-employee” excludes all components in payments for employees, whereas non-salary still accommodates expenditure for employees outside salary and official allowances.
5 The payment of salaries for non-PNS teachers (those who do not have full civil services status) is often reported as an ’operational” cost rather than a salary cost.
3. Educational Service Costs
3.1.2 Cost Classification
According to Government Regulation No 19 of 2005 concerning National Educational Standards, the costs for education fall into three categories - investment costs, operational costs and personal costs.
y Investment costs at school level are for the provision of infrastructure and facilities, the development of human resources, and fixed working capital.
y Operational costs are for salaries of teachers and other educational staff together with allowances attached to salaries, materials and equipment, and indirect costs in the form of electricity, water, telecommunications, maintenance of infrastructure and facilities, overtime payments, transportation, consumption, tax, insurance and the like.
y Personal costs are defined as expenses that must be paid by students (or their parents and guardians) in order to be able to take part in the learning process in a regular and continuous manner.
The size of investment expenditure varies greatly among schools. For non-RSBI schools included in this Study, the range was from Rp 20 million to Rp 350 million, while for RSBI schools the range was between Rp 750 million and Rp 1.2 billion (last school year). RSBI schools clearly receive the lion’s share of investment funding from the government for the provision of physical facilities. At the same time, there are many other schools that receive little or no aid of this kind. The average expenditure for investment costs in RSBI schools is around three to four times greater than in non-RSBI schools.
In the case of operational costs, the greater part goes to expenditure on teachers’ salaries. The salaries of teachers who are public servants are paid directly by Regional Governments (Pemda), while payments to teachers who are not public servants (non-PNS) depend on different policies that exist in each region. In some districts, salaries are paid the local government, but in many districts salaries of non-PNS teachers have to be financed from funds that come from parents.
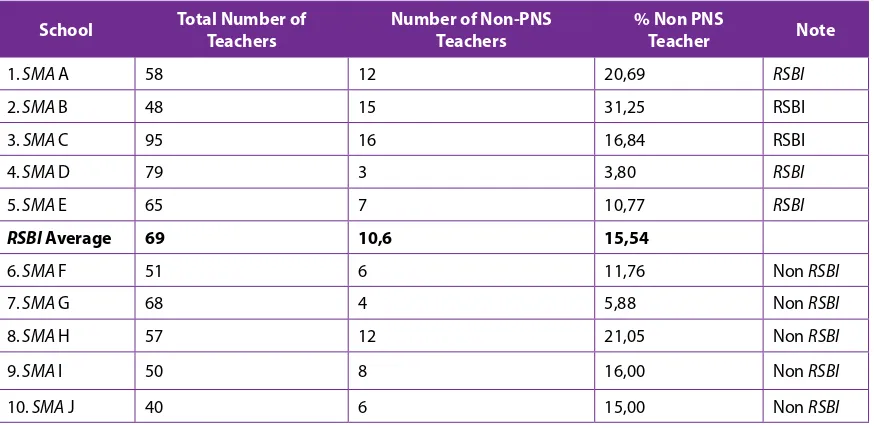
Operational costs for teachers’ salaries and those of education staff are difficult to categorise, because of the large variations in the number and proportion of PNS and non-PNS teachers in schools. Table 3.2 shows that the number of non-PNS teachers ranges from three (4%) to 25 persons (74%) in the sample schools. In general, relatively newly established schools have more non-PNS teachers, but the majority of them are in the process of becoming accredited. To illustrate this point, the largest percentage of non-PNS teachers was found in anSMAin Lampung, which is just five years old.
Table 3.2: Number and Percentage of Non-PNS Teachers in the Study
3. Educational Service Costs
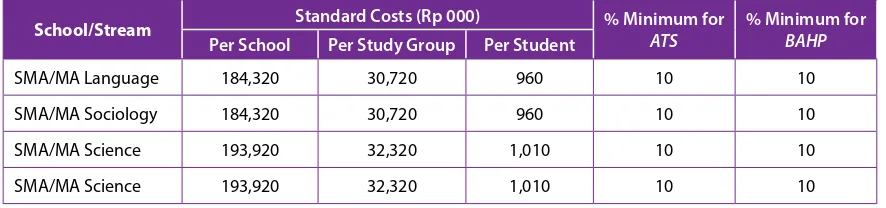
The government has attempted to stipulate the expected levels of non-salary-related operational costs. Regulation No. 69 of 2009 of the Minister for National Education sets the standard for non-salary related operational costs for all school levels (including SMA). Cost standards are calculated on the assumption that the number of study groups (rombel) is six and the number of students is 32 per study group, which means a total of 192 students. The results for SMAs can be seen in Table 3.3. For the Language and Sociology streams, the annual unit cost per student is Rp 960,000, while for the Science stream it is a little larger, that is, Rp 1,010,000 per year.
Table 3.3: Standard Annual Operational Costs for Non Personnel
School/Stream Standard Costs (Rp 000) % Minimum for
ATS
% Minimum for BAHP
Per School Per Study Group Per Student
SMA/MA Language 184,320 30,720 960 10 10 SMA/MA Sociology 184,320 30,720 960 10 10 SMA/MA Science 193,920 32,320 1,010 10 10 SMA/MA Science 193,920 32,320 1,010 10 10
Source: Annex I Regulation No 69 Year 2009 of the Minister for Education
Regulation No. 69/2009 also deals with details of operational spending. According to this regulation, a minimum of 10% of the allocation may be used for the purchase of school stationery and consumables and equipment.
3.2 Sources of Funds
3.2.1 Current Situation
The funding of State SMAs is complicated. The payment of salaries of teachers who are public servants is a district government responsibility, while personal expenses are obviously the responsibility of parents. For other expenses (investments, salary and non-salary operations), there is considerable variation in sources of funding among schools.
3. Educational Service Costs
Figure 3.1: Current Sources of Finance and their Uses
Investment Costs
Parents are the main source of non-salary operational finance, with the assistance of the central and district governments and - in some cases - the provincial government. The financial role of parents is very important, particularly because parents also contribute to payment of the salaries of non-PNS teachers and investment costs (except in those areas such as Kabupaten Karawang, which has introduced a “free schooling” policy in State SMAs).
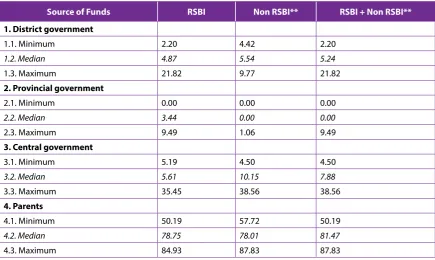
The significance of funds from parents was highlighted by survey results. Table 3.4 reveals that funds from parents provide more than three quarters of the funds needed for operational (non-salary) costs in State SMAs in both the RSBI and non-RSBI categories.
Table 3.4: School Revenue for Non-salary Operational Costs* from Various Sources (%)
Source of Funds RSBI Non RSBI** RSBI + Non RSBI**
3. Educational Service Costs
Source of Funds RSBI Non RSBI** RSBI + Non RSBI**
5. Others
5.1. Minimum 0.00 0.00 0.00
5.2. Median 0.01 0.00 0.00
5.3. Maximum 0.80 3.61 3.61
* Including allowances for extra tasks (head master, deputy head master, class head, etc)
**Karawang was excluded from observations because of the prohibition on receiving funds from parents.
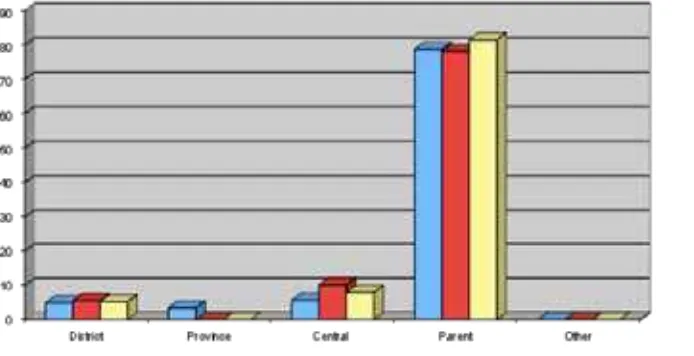
Figure 3.2: Median of Percentage of School Non-Salary Operational Cost from Various Sources
Schools obtain funds from parents in various ways. The most common way is through the entrance fee (which is paid when acceptance of a student inSMAis announced). Various terms are used for this entrance money: money for development; money for participation in education; and committee money (paid in a routine manner/monthly). Other levies applied in some schools include specific charges for additional lessons to prepare for the national examinations and charges for OSIS (the student council). These latter charges vary from school to school, but are usually around Rp 200,000 per year. “OSIS money” is not exclusively used for the activities of students and OSIS, but is part of the general school budget. Some schools also charge compulsory annual re-registration fees of around Rp 400,000 (for classes 11 and 12). Generally, district funding for state SMAs is focused on the payment of PNS salaries, while a little is allocated to the purchase of goods and services. There are exceptions to this rule. Some districts have allocated funds specifically for school operational costs (e.g. Educational Subsidy Funds in Karawang or “District BOMM” in East Sumba).
Central government plays a larger role in supporting school operations (outside salaries) than provincial governments. Special Assistance for Poor Students (BKMM funds) from the central government can help schools meet their operational needs, but the extent to which this happens depends on how the funds are distributed. Some schools distribute the scholarships, in which case some, but not all may return in the form of fees. Others hold on to the money and offer reduced fees. In this latter case the BKMM funds could be regarded as a part of the school’s operational funding.
From the schools point of view, parental contributions are the most regular and useful source of funding. By contrast, funds from the government are often delayed and this was a common complaint in virtually every school in the sample. This is a major problem for schools that are not permitted to receive fee income (in the present study, those in Karawang District). One school stated that they even have to borrow money in order to cope with cash flow problems that result from delays in government disbursement.6
3. Educational Service Costs
3.3 Household Expenses
As already described, the greater part (around 80%) of school non-salary expenses comes from the parents/guardians of students. In addition to the direct costs paid to the school, households also bear the indirect costs of education.7 This sub-section describes the type and size of educational costs paid by the household.
3.3.1 Data and Calculation Techniques
The information used in calculating educational costs expended by the household consists of data from the household survey conducted in 14 schools in eight districts in four provinces. The survey succeeded in collecting 1,350 household samples (N=1350) from around 1,500 take-home questionnaires, which were distributed to students selected at random in classes 10, 11 and 12. The analysis of data from these sources was broken down by type of school (RSBI or non-RSBI); the level of household welfare (based on income quintiles); the gender of the students; and the location of the school (district and province).
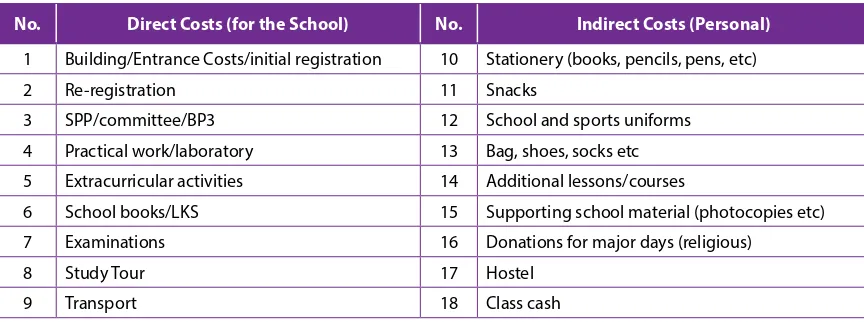
A total of 18 types of expenditure on education were included in the household questionnaire (see Table 3.5), but not every kind of expenditure applied in every case. Therefore, the number of observations for each variable (n) is not the same as that of the whole household survey sample (N=1350)8. The frequency of incurring expenses for the cost of a hostel (asrama), for example, was only 193 (from 1,350, or around 14%). On the other hand, the frequency of incurring costs in relation to the purchase of snacks is 93% (n=1251).
Table 3.5: Categories of Direct and Indirect Costs in the Present Study
No. Direct Costs (for the School) No. Indirect Costs (Personal)
1 Building/Entrance Costs/initial registration 10 Stationery (books, pencils, pens, etc) 2 Re-registration 11 Snacks
3 SPP/committee/BP3 12 School and sports uniforms 4 Practical work/laboratory 13 Bag, shoes, socks etc 5 Extracurricular activities 14 Additional lessons/courses
6 School books/LKS 15 Supporting school material (photocopies etc) 7 Examinations 16 Donations for major days (religious)
8 Study Tour 17 Hostel 9 Transport 18 Class cash
Not all expenses cover the same time period. Some outgoings are incurred daily, others are termly or annual. In order that all costs could be added up on a common basis, expenditure was converted into monthly payments.
Once the monthly expenditure for each type of cost had been calculated averages were obtained by applying a common dominator (N=1350).9 These averages for each kind of expense were added to obtain the average total cost paid by parents/guardians for their children’s education inSMAevery month.
3.3.2 Results
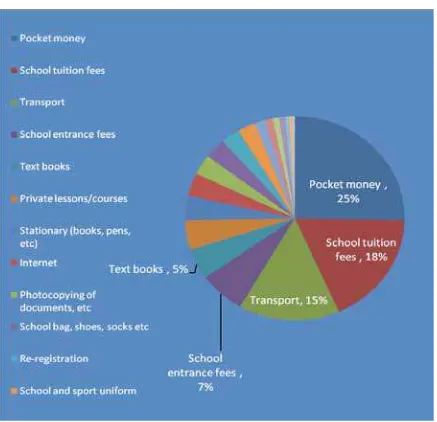
The results of calculations show that the average total household expenditure forSMAeducation is Rp 552,312 per month. Among the 17 kinds of costs paid out by households, expenditure on snacks for students is the biggest item (25%). The second biggest expense is SPP or “committee money” (18%), followed by transport (15%). Money for registration and books is 7% and 5% respectively (see Figure 3.3).
7 If reference is made to Govt. Regulation 19/2005, indirect costs are here the same as personal costs, whereas direct costs can take the form of investment or operational costs in the school (depending on their use by the school).
3. Educational Service Costs
Figure 3.3: Contribution (%) by Type of Expense to Total Expenditure on Education
In addition to total expenditure on education by households, the present study also attempted to look at the difference between direct and indirect costs. Direct costs are defined as costs paid by parents/guardians to the school, while indirect costs are educational expenditure not paid to the school. This showed that indirect costs form a greater proportion of total educational costs at household level than direct costs (64% compared with 36%). The size of indirect costs is very largely due to the amount of household money spent on food and transport for the student to attend school.
The study then looked at the difference in educational costs paid by households with a child in an RSBI school and those with one in a non-RSBI school. From Table 3.6 it can be seen that the total expenditure paid by parents/guardians for RSBI schools is almost twice the amount spent on non-RSBI schools. Parents who educate their children at RSBI schools pay a higher proportion of direct costs by comparison with those whose children attend non-RSBI schools.
Table 3.6: Direct and Indirect Costs Identified in the Household Survey
Type of School Direct Costs Indirect Costs Total Costs
Rp/month % Rp/month % Rp/month %
RSBI 299,882 41 430,471 59 730,352 100 Non-RSBI 164,101 36 285,791 64 449,892 100
3. Educational Service Costs
3.3.3 Perceptions about costs
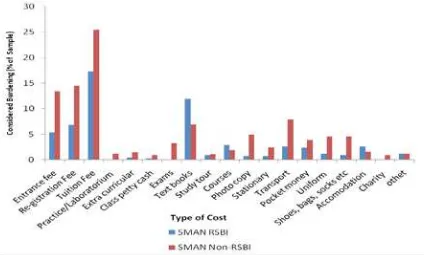
For most poor households the high costs of education greatly influence their decision to continue to enrol their children in secondary schools. The household survey indicates that of all the costs associated with education, tuition fees are considered to be the most burdensome for parents (see Figure 3.4).
The cost of tuition varies between schools and also regions. In regions where a “free school” policy operates, there are no tuition fees for students attending public SMA, except for those attendingSMA RSBI. In regions where tuition fees are subsidised, they are typically around Rp10,000 per month. Elsewhere, tuition fees at the non-RSBI SMAsurveyed were between Rp60,000 and Rp110,000 per month, whereas for RSBI SMAfees ranged between Rp150,000 and Rp250,000.
Although tuition fees at RSBI SMAare higher than non-RSBI SMA, figure 3.4 shows that the percentage of respondents who stated that the tuition fee was the most burdensome was higher among non-RSBI parents.
Figure 3.4: The cost considered most burdensome by households
After tuition fees, the next most burdensome cost is the registration fee and the entrance fee. The re-registration fee has to be paid by students when they continue from grade 10 to grade 11 or from grade 11 to grade 12. In this survey re-registration fees, which ranged between Rp500,000 and Rp1,350,000, were only charged in schools in Lampung Province. Schools claim that re-registration fees reduce the burden of initial entrance fees by spreading the costs over three years.10 Entrance fees vary from place to place and in the survey ranged between Rp1.7 million to Rp3 million.11
Parents find these costs particularly burdensome, not only because of the amounts involved, but also because they are lump sum payments at the beginning of the academic year. Poor households reported going into debt to pay these fees.
10 In NTT the re-registration fee also exists, however this fee is actually a three monthly tuition fee that has to be paid upfront by students before they start the new semester
3. Educational Service Costs
The researchers also found evidence ofSMAstudents themselves contributing to the costs of their education, using money that they earn from working. 18% ofSMA students in the survey work outside of school hours. Several students used breaks between classes at school to sell mobile phone credit or assist at the school canteen. Table 3.7 shows that 40% of students from poor households were working compared to 12% of students from higher income households, indicating that the need to work is related to family circumstances. In NTT, a province with an above-average level of poverty, the percentage ofSMA students working is higher than in the other provinces surveyed.
Table 3.7: The Proportion of High School Students Working
% Respondents Working Not working
All Respondents 18 82
By Groups of income
Q1 (Quintile 1, the poorest) 40 16
Q2 (Quintile 2) 23 19
Q3 (Quintile 3) 12 21
Q4 (Quintile 4) 13 21
Q5 (Quintile 5, the richest) 12 22
By Province (Study Locations)
Jawa Barat 21 79
Jawa Tengah 5 95
Lampung 17 83
Nusa Tenggara Timur (NTT) 30 70
Table 3.8: Characteristics of work types (% students working)
Characteristics
Type of work % Average time spent working per day 2-3 hours Farmer/farm labourer 40 Receive a wage 57% Retailing 32 Maximum wage (Rp/week) 180,000 Non-farm labourer 10 Minimum wage (Rp/week) 1,000 Ojek driver 8 Average wage (Rp/week) 54,026
Others 10
Total 100
Amongst the students who completed the take home survey of this Study, 246 (22%) were scholarship recipients, and the majority of these were recipients of scholarships especially for poor students (BKMM) funded by the central government.12 Many of these students (38%) stated that the scholarships they receive are managed by their schools and are used to pay their tuition fees.
In addition to the take home survey for students currently studying at high school, this study conducted a small-scale survey (with 83 respondents), in Jawa Tengah and NTT, of students who graduated from junior high school (SMP) in 2011 but did not continue on to high school (eitherSMA or SMK).
Generally graduates of junior high school (SMP) not continuing on toSMAcame from households that were poorer than the households of students currently attending high school (see Table 3.9). Nevertheless, this same table shows that there are also SMPgraduates who did not continue to high school even though their parents/guardians were not poor.
3. Educational Service Costs
Table 3.9: Distribution SMA Students from Grade 10 and SMP Graduates who did not continue their education based on Household income level (% Respondents)
Household Income group Grade 10 SMA students SMP graduates not continuing to SMA
Q1 (quintile 1, the poorest) 19 21
Q2 19 21
Q3 9 31
Q4 25 15
Q5 (quintile 5, the wealthiest) 28 13
Total 100 100
Results from interviews indicated that a large proportion of respondents (63%) did not continue to SMA because schooling is too expensive. Approximately 10% of respondents who did not continue to SMA said this was because they had to assist their parents to make a living. In NTT, cases were found, even though the proportion was relatively small, of female students who did not continue with their schooling because they had to marry. This shows that non-economic factors also prevent SMP graduates continuing with their education to SMA.
Table 3.10: Reasons why SMP graduates have not continued to SMA
Reason for not continuing Per cent
Child has to work/help parents make a living 10
High cost of schooling 63
Distance from school is too far 2 Not accepted at a government or their choice of SMA 1
Sick/disabled 1
Child does not want to continue/is lazy/ social influence 18
Child has married 2
Parents/guardians need to school other children 1
Other reasons 1
4. Service Standards and Financing Implications
4.1 Service Standards for
SMA
As no generally agreed minimum service standards exist for Senior Secondary Schools (SMA), those established for junior secondary schools were used as a basis for discussion and development.13 The principle used in compiling the simple standard to be tested in the field was that for each indicator, the qualifications forSMAcould not be lower than those forSMP(Junior Secondary).
The first draft was taken to schools to obtain feed-back about various indicators but the opportunity was taken to also measure schools against the standards. Table 4.1 below represents the result of the first draft consulation.
Table 4.1: First Draft of Minimum Service Standards for SMA and a Comparison with those for SMP and MT
No SPM for SMP/MTs (Permendiknas 15/2010) Tentative SPMs for SMAs
1 Availability of one classroom for one study group Availability of one classroom for one study group 2 Availability of one IPA laboratory complete with
table/chair and equipment for practical work
Availability of laboratories for Physics, Chemistry and Biology complete with tables/chairs and equipment for practical work
2a Availability of a library
2b Availability of computers in the school 3 Availability of one teacher for each subject Availability of one teacher for every subject 4 70% of teachers have an S1 (or D4) degree and half
of this 70% already have certification
All teachers have an S1 (or D4) degree and 50% have certification
5 Availability of teachers with certification for Math-ematics, Science, Indonesian and English
Availability of one certified teacher for Mathematics, Physics, Chemistry, Biology, Indonesian and English 6 The head of the school has an S1 degree (or D4) as
well as certification
The head of the school has an S2 degree as well as certification
7 Availability of text books for all subjects, with one book for each student
Availability of text books for all subjects, with one book for each student
8 Teachers work 37.5 hours a week Teachers work 37.5 hours a week
9 Teachers follow the curriculum in teaching (KTSP) Teachers follow the curriculum in teaching (KTSP) 10 Teachers prepare teaching plans (RPP) Teachers prepare teaching plans (RPP)
11 Teachers make an evaluation of students’ results Teachers make an evaluation of students’ results 12 The head master supervises classes at least twice a
semester
The head master supervises classes at least twice a semester
13 Permendiknas No. 15 of 2010 regulates Minimum Service Standards for junior school education, which takes in SDs/MIs and SMP/MTs. At the time when this report was prepared, there were no SPMsforSMAs.
4. Service Standards and Financing Implications
No SPM for SMP/MTs (Permendiknas 15/2010) Tentative SPMs for SMAs
13 Teachers report evaluations of students to the head master at least once a semester
Teachers report evaluations of students to the head master at least once a semester
14 The head master reports students’ progress in learn-ing to parents at least once a semester
The head master reports students’ progress in learning to parents at least once a semester
15 The school applies School Based Management (MBS) The school applies School Based Management (MBS)
When assessing the schools visited for this study using the draft simplified service standards, the results were as follow in Table 4.2.
Table 4.2: Achievements in the First Draft of Minimum Service Standards for SMAs in 9 Study Schools*
No Indicators
1 One classroom available for one study group 0.00 5.58 11.11 83.33 100.00 2 One laboratory available for each subject (Physics,
Chemistry and Biology) complete with tables/ chairs and equipment for practical work
5.56 38.89 27.78 27.78 100.00 2a Library available 27.78 - - 72.22 100.00 2b Computers available 16.67 - - 83.33 100.00 3 One teacher for each subject - 5.56 38.89 55.56 100.00 4 All teachers have an S1 (or D4) degree and half of
them have certification - 27.78 - 72.22 100.00 5 Availability of teachers with certification for
Mathematics, Science, Indonesian and English 5.56 11.11 22.22 61.11 100.00 6 The head of the school has an S2 degree as well as
certification 44.44 - - 55.56 100.00 7 Availability of text books for all subjects, with one
book for each student 16.67 66.67 16.67 - 100.00 8 Teachers work 37.5 hours a week 11.11 5.56 11.11 72.22 100.00 9 Teachers follow the curriculum in teaching (KTSP) - 16.67 27.78 55.56 100.00 10 Teachers prepare teaching plans (RPP) - - 11.11 88.89 100.00 11 Teachers make an evaluation of students’ results - - - 100.00 100.00 12 The head master supervises classes at least twice a
semester - - 16.67 88.89 100.00
13 Teachers report evaluations of students to the head
master at least once a semester - - - 100.00 100.00 14 The head master reports students’ progress in
learning to parents at least once a semester - - - 100.00 100.00 15 The school applies School Based Management (MBS) - 16.67 22.22 61.11 100.00
*Including 2 private schools; 2 non-studySMAN added in evaluating (draft) SPM achievement
Table 4.2 reveals a number of points:
y No school (including RSBI schools) met the requirement of the availability of text books for all subjects, with one book for each student. Most schools regard the provision of text books as the reponsibility of parents, not of the school. Unless this requirement is seen as a school responsibility, there is very little likelihood that this indicator in the draft SPM will be met.
y The availability of laboratories is also very low. Only 28% of schools surveyed met this requirement; most that did are RSBI schools or non-RSBI schools preparing to become RSBI schools.
4. Service Standards and Financing Implications
y Schools also performed very poorly against indicator No. 4, which requires all teachers to have an S-1 education and half of them to have certification. This can be explained by the large numbers of non-PNS teachers. Many non-PNS teachers do not have certification because they do not meet the minimum requirement of teaching for at least 24 hours per week. This may be an indication that the schools where they teach have too many teachers.
The first draft of the SPM for Senior Secondary Schools (SMA) was also discussed with educational stakeholders at central level and in the regions to obtain inputs. Several important inputs are noted below:
y Indicator No. 3, concerning the availability of laboratories: the need for small schools (with less than 200 students) to have one laboratory for each of these subjects (Physics, Chemistry and Biology) may be excessive.
y Indicator No. 6 concerning the need for the head of a school to have an S-2 degree: this requirement appears excessive and is beyond the official government stipulations. It is suggested that an S-1 degree is sufficient, with the additional requirement that such teachers must have already attended education or training to become a head master.
y Indicator No. 12 concerning supervision by the head master of classes: some explanation was sought about the type of supervision. If it means full supervision (the head master present in each classroom twice a semester), it would be very difficult to implement.
Based on the above inputs, a second Draft was prepared of the Minimum Service Standards for SMA, following further discussions with the Ministry of Education and Culture. Table 4.3 presents the Second Draft.14
Table 4.3: Minimum Service Standards Proposed for SMA
No. Indicators
1 One classroom available for one study group
2 One Science laboratory that can be used for Physics, Chemistry and Biology, complete with tables/chairs and equipment for practical work
3 A library that can be used as a learning resource
4 School computers available for use as learning resources and/or school management 5 One teacher available for each subject
6 All teachers to have an S1 degree and half of them to have certification
7 One teacher with certification to be available for each of the following: Mathematics, Physics, Chemistry, Biology, Indonesian, Economics, Sociology, Geography and English
8 The head master has an S1 degree as well as certification, and has received training to become the head of a school
9 Text books available for all subjects, with one book for each student
10 Teachers work 37.5 hours a week
11 Teachers follow the curriculum in teaching (KTSP) 12 Teachers prepare teaching plans (RPP)
13 Teachers make an evaluation of students’ results
14 The head master supervises classes at least twice a semester
15 Teachers report evaluations of students to the headmaster at least once a semester 16 The head master reports students’ progress in learning to parents at least once a semester 17 The school applies School Based Management (MBS)
4.2 Financial Implications
Not all indicators in the (draft) SPM have implications for the financing of education. Indicators 10-17 can be met through policies and commitment at the school level, accompanied by a monitoring system and supervision by the relevant agency, without demanding a special allocation of funds. If funds are available,
4. Service Standards and Financing Implications
they can be allocated in the form of training in the preparation of KTSP and RPP for teachers who have not yet received such training.
Several indicators related to the provision of infrastructure and facilities, such as Indicator No. 1 (sufficient classrooms), No. 2 (availability of laboratories), No. 3 (libraries) and No. 4 (availability of computers), have major cost implications. Schools that do not yet meet these indicators require significant funds for investment costs to provide these facilities together with the equipment that is needed so that everything can be used effectively in the learning-teaching process. In the specific case of a library, after a library has been built, the school must implement a learning process that involves use of the books in the library as a source of studies. If this is not done, the existence of a library will not help the learning-teaching process in the school.
The problem of the availability of teachers and certification (Indicators No. 5 and No. 6) could be solved if the Government can arrange the allocation of teachers in such a way that teachers employed in schools with too many teachers can be moved to schools with a shortage. Organising an equitable distribution of teachers is a major problem for the government .
The need for teachers with certification for a number of subjects that are included in the National Examinations (Indicator No. 7) cannot be met in the short term. The first step that has to be taken is collecting data concerning the availability of teachers with certification in all schools.
Indicator No. 8 (education and training for school heads) has implications for the appoinment of new headmasters. It is not difficult for prospective head masters to meet educational requirements (an S1 degree) and the same applies to certification. However special training for prospective head teachers which is seen as part of the selection process has yet to be developed and this would require funding. The indicator that requires special attention is the availability of books (Indicator No. 9). A political decision is required to establish whether the purchase of essential textbooks is the responsibility of government or parents.
4.3 Responsibilities for Financing Senior Secondary Education
An explanation has already been given of the funding pattern that is found in State SMA. Figure 4.1 is an attempt to simplify and clarify “who could be responsible for what”. It does not represent a recommended pattern of financing, but is included in order to highlight some important issues.
Figure 4.1: Simplifying the sources of funding for State SMAs
4. Service Standards and Financing Implications
This arrangement raises a number of important questions about the responsibilities of the various levels of government and the nature and magnitude of parental contributions. Government finances are not infinite and there are strong arguments in favour of user charges because the private returns to this level of education are high. On the other hand, in the interests of creating more equitable access to senior secondary education, there are equally strong arguments for reducing the cost burden for poor families and for selective government subsidies.
Figure 4.1 suggests that meeting investment costs in state schools is the responsibility of the central and provincial governments. Investments costs include the building of new school units, new classrooms, serious rehabilitation, the provision of educational infrastructure and facilities in schools, and the supply or other durable goods. If necessary, the private sector can be involved, as is happening currently.
One crucial point in the finance pattern recommended above is teacher salaries, in particular non-PNS teachers. District/city governments are responsible for the payment of the salaries of PNS teachers (as has been happening up until the present time), but a question remains over who should cover the salaries of non-PNS teachers. More efficient teacher deployment practices would sort out the poor distribution of teachers and obviate the need for schools to take on non-PNS teachers. However, rationalising teacher deployment is a major undertaking and is unlikely to be achieved in the short term.
3. Educational Service Costs
Steps have already been taken by the different levels of government to increase school participation in senior secondary education.
5.1 Central Government Initiatives
The arrangement for the construction of new schools is that the Kabupaten/Kota are responsible for the provision of land, while the central government pays for the construction of buildings and the provision of equipment and infrastructure. For each new school, the government builds three classrooms, a library, a science laboratory (Physics, Chemistry and Biology) and a teachers’ room. For existing schools, the central government also gives a block grant that can be used by the school for new classrooms (and also for equipment and infrastructure, books for the library, etc.) for the purpose of increasing the enrolment capacity of the school.
Field observations show that access to state secondary education is limited. Not all sub-districts have a StateSMA(or SMK). As a result, some students have to travel long distances or live apart from their parents. This, for many, must be a disincentive to continuing their education.
In addition, the Government gives assistance in the form of BOMM funds (Operational Assistance for Management of Quality) to allSMA(including private SMA) to the value of Rp 90,000 per student per month. Those schools designated RSBI receive between Rp 100 million and Rp 300 million per annum as a subsidy towards meeting their operational costs. A minimum of 30 per cent of the funds received by RSBI schools should be allocated to poor children. In practice, some RSBI, particularly those in urban areas, have difficulty in allocating funds to poor students because they have too few poor students.
The Government assists poor families to educate their children at SLTA level through the Special Assistance for Poor Students (BKMM) with funds to the value of Rp 65,000 per student per month. The aim is to reduce the financial burden of schooling for poor households and encourage poorer students to continue in the education system. Generally, schools tend to retain BKMM funds to set against school fees, rather than give the money to the students and recoup what they can.
5. Initiatives to Increase Senior Secondary School Participation
5.2 Provincial Government Initiatives
On the whole, provincial governments take few initiatives to increase participation in senior secondary schools. The general view in provincial government is that SLTA participation is the responsibility and of each Kabupaten/Kota. However, almost all provinces allocate funds to helpSMAin the RSBI category, but this assistance is more of an encouragement to raise quality than an attempt to increase overall access. Several provinces allocate scholarship funds for poor students (not only for RSBI schools) and there are also provinces that give assistance to schools in the form of goods (books, study aids and the like). Generally, however, assistance of this kind has a limited impact on increased access or participation.
5.3 District Government Initiatives
Some districts have introduced initiatives to increase participation at the SMAlevel; others have not. One programme that has been developed is the “Sekolah Filial” (Filial School) programme (which in some regions is known as “Kelas Jauh”). The “Sekolah Filial” is a satellite of an existingSMA located elsewhere, usually in the grounds of a junior secondary school. In Kabupaten Grobogan), for example,SMAstudents attend school afternoon classes (because in the mornings classrooms are used bySMPstudents).
In 2009/10 there were 29,866 Junior Secondary Schools in Indonesia: over one and a half times more than the number ofSMAand SMK, with greater coverage in more remote areas. In those places, filial schools would increase access for 16-18 year-olds in poor households. Teachers for the Filial Schools are usually the existingSMPteachers (but occasionally there are teachers seconded from the main SMA. Students in the Filial SMAtake the National Examinations in the main (induk) school.
Filial Schools in Kabupaten Karawang are situated in State Elementary Schools (SD Negeri) but are under the coordination of a specific StateSMAas the main school. The advantage of this model is that the schools are able to reach locations that are even further away than if they were placed in a StateSMP(because there is at least one State SD in each village). This model, however, requires special arrangements for contract teachers (non-PNS) to teach in the Filial SMA, because SD teachers on the whole cannot be given the task of teaching inSMAclasses.
Besides developing the Filial SMA, Kabupaten Karawang’s policy of “free schooling” means that State SMAs cannot seek or receive fees in any form from students. This does not apply to RSBI schools. In compensation, the Kabupaten allocates funds for the operational needs of StateSMA(including RSBI schools15) based on the number of students. The allocation is Rp 55,000 per student per month.
This Karawang policy has had some mixed consequences:
y Participation in state schools has risen very rapidly (to the point where on average State SMA, with the exception of RSBI schools, has more than 1,200 students). However, participation in private SMAs has fallen sharply. The policy has therefore caused a shift from private to state schools, rather than a dramatic increase in overall participation.16
y The provision of infrastructure and operational funds has not kept pace with rise in the number of students. There are concerns that the double shift system is affecting quality, because student’s’ time on task has been reduced and extra-curricula activities have been foregone.
y The policy that prevented schools from collecting funds from students has created a problem of cash flow for schools because funds from the regional government are always late.
15 With the existence of these funds, the RSBI SMA in Karawang collect a smaller fee (Rp 95,000 per student per month).
5. Initiatives to Increase Senior Secondary School Participation
Kabupaten East Sumba (Nusa Tenggara Timur) has a policy whereby the local government gives “District BOMM” funds worth around Rp 60,000 per student per month,17 but still allows StateSMAto collect fees from students in limited amounts. (“Committee money” in one school in East Sumba in this study was only Rp 10,000 per student per month). Under a policy of this kind, the school obtains sufficient funds from the government but does not experience cash flow problems because there are still funds from students and parents, even though the value is not very great.
5.4 School Initiatives
Several RSBI schools have taken the initiative of increasing the number of scholarship recipients in various ways. SMAN 1Purbalingga, for example, made an internal arrangement that students who do not receive BKMM could nevertheless receive a reduction in costs.18 This includes orphans and children of one-parent
families, those who become officials of OSIS and those who perform well academically. In the 2011/212 school year, from a total of 1,047 students in the school, 301 (29%) paid reduced school fees.
17 This means that with the addition of Central BOMM funds of Rp 90, 000 per student per month, schools would receive BOMM funds totalling Rp 150,000 per student per month for operational needs.