123
THE INFLUENCE OF QUALITY SERVICE AND BRAND
IMAGE ON LOYALTY THROUGH SATISFACTION AS
INTERVENING VARIABLE
Meithiana Indrasari
1,
Bambang Raditya
2Economic and Bussiness Faculty, University of Dr Soetomo (Unitomo) Surabaya
e-mail: [email protected]
ABSTRACT
This research was conducted to analyze the influence of the quality of service, loyalty towards the brand image by taking customer satisfaction as an intervening variable. This research was conducted at the private college students who are in Surabaya with taking samples as many as 100 students by using purposive sampling technique of sampling. Sample criteria i.e. students who have attended college for a minimum of four (4) semester, as students with these criteria are considered to have been able to undertake the evaluation of campus where they study. The results of this research show that service quality and brand image effect significantly to customer satisfaction and loyalty, satisfaction effect significantly to loyalty, and satisfaction is the influence of intervening variables between quality services and loyalty towards the brand image.
Keywords: Service Quality, Brand Image, Satisfaction, Loyalty
INTRODUCTION
Increasing competition among universities, both public and private sector are increasingly stringent, requiring higher education institutions to increase the quality of its services and build brand image in the eyes of the public if the agency does not want to be left by customers. Efforts to meet the wishes of students and prospective students is key to successfully win the competition.
Good image in the eyes of consumers or prospective student is required by a college. A good image of Higher Education will stimulate simplification of decision-making that is the decision rule. In this context the image of the College to be a problem of attitudes and beliefs related to: brand
awareness. This image because it is so important for the survival of a university, it is the responsibility of every University to be able to observe and manage the good image that already has to be maintained and even improved, which is expected to affect prospective students to choose the Higher Education.
Herizon and Maylina (2003), explains that consumer loyalty is formed by the image attached to the product / brand of the company. It also caused by the satisfaction obtained by the consumer for consuming products and related companies. the person who took the decision to buy is based on the perception of the image of the product or the company. If the perception is good, then consumers will buy, even willing to pay a high, if the image is not good consumers will move to other brands.
Researchers are interested to examine further the effect of service quality and brand image to the satisfaction and loyalty of students especially in Private Universities (PTS) in Surabaya. the research was interesting to do for several reasons. First, through the quality of service of Higher Education offer then d iharapkan image of Colleges will be more firmly embedded in the minds of students so will bring up loyalty in them. Second, in order to increase the number of students Colleges should be able to create a loyalty towards them.
Based on the above, this study aimed to examine the effect of service quality and brand image to the satisfaction of the students at the College of Surabaya, examines the effect of satisfaction mahaiswa loyalty student at the College of Surabaya, and examine satisfaction as intervening variables influence the quality of services and the Imagery brand loyalty at the College of Surabaya.
THEORETICAL
Quality Of Service
Perceived quality of service is the result of an evaluation process, customers compare the perceptions of the service and the expected results, therefore, defines the quality of service from the user’s perspective as something that consistently or exceed customer expectations (Grönroos in Lovelock 2010).
According to (Tjiptono, 2011) there are five main dimensions are arranged in the order of significance, among others:
a. Reability (reliability), related to the company’s ability to provide accurate service since it first without making any mistakes and delivered according to the agreed time.
b. Responsiveness (responsiveness), with regard to the willingness and ability of employees to assist
customers and to respond to requests, as well as inform will be given and then provide appropriate services.
c. Assurance (guarantee), the behavior of the employees are able to foster customer trust and the company can create a sense of security for customers.
d. Empathy (empathy), means that the company understands the problem of the customer, and provide personal attention to our customers and have a comfortable operating hours. to consistently provide the features, benefits and services tententu to the buyer, not just a symbol that distinguishes a particular company’s products with its competitors. Keller (1993) in Andreassen (1994) stated brand awareness with regard to the possibility of the brand name will be embedded in the minds and convenience that it provides. While the brand image is defined as the perception of a brand as indicated by the brand associations held in consumer memory.
According to Aaker in Simamora (2004) in Wijaya (2008) that the brand image is a set of associations to be created or maintained by marketers. These associations actually stating what brand and what is promised to consumers. Brand is a symbol and an indicator of product quality.
Therefore, the brands that have long product will be an image of even a status symbol for those products that can improve the wearer’s image, brand image component consists of 3 parts (Simamora 2004 in Wijaya, 2008), namely:
1. The Image Makers that is, a set of perceived consumer associations against companies making a product or service.
2. The image of the user, namely, a set of perceived consumer association of the users who use a product or service.
Customer Satisfaction
One of the efforts to maintain the market is to create consumer satisfaction, because customer satisfaction is one key to the success of a business. With customer satisfaction, organizations can increase profits and gain a wider market share (Suhartanto, 2001). Selnes (1993) describes the satisfaction (attitude towards the transaction) and related brand reputation but it is a different element. Both are expected to influence future behavior and customer loyalty. If the consumer can have the opportunity to evaluate the quality of services or products provided, satisfaction is expected to have an influence on loyalty. Fornell (1987) in Herizon and Maylina (2003) states influence buying behavior of customer satisfaction: satisfied customers tend to be loyal customers, but that does not mean loyal customers satisfied.
The creation of customer satisfaction can provide several benefits including: (1) the relationship between the company and customers into a harmonious, (2) provide a good basis for re-purchase and creation of customer loyalty, as well as the formation of a recommendation from the mouth to mouth (word-of-mouth) which can be profitable for companies (Tjiptono, 1997 in Herizon and Maylina, 2003).
Consumer Loyalty
Loyalty is defined as an attitude that is shown by the consumer to the provider of the product or service. A consumer will show loyal attitude if a company is able to provide satisfaction to its customers. Loyal customer is a consumer who always buy back from the provider or the same provider and maintain a positive attitude towards the service providers in the future. Selnes (1993) describes customer loyalty shows the intended behavior relating to products or services. This includes the possibility of future purchases or renewal of a contract of service or otherwise, how likely consumers will switch to service providers or other brands. Researchers have shown an increase in customer loyalty can generate as much as 5 percent profit increase of 25 percent to 85 percent (Reicheld and Sasser, 1990 in Kadampully and Suhartanto, 2000).
Loyalty arises because of a sense of trust from consumers for satisfaction after using a product, customer satisfaction occurs when customer expectations in accordance with what is experienced
and felt even exceeded his expectations. Customer satisfaction will also be met if a service provider is able to examine the specific criteria for each of the services to be provided to consumers. There are two dimensions in customer loyalty: behavioral dimension and the dimension of attitude (Julander et al., 1997) in (Kandampully and Suhartanto, 2000). Dimensions of behavior (behavior dimension) means the behavior of customers to re-purchase, indicate preferences (preference) over time to a brand or service. On the other hand, the dimensions of the attitude (attitudinal dimension) means a will (intention) customers to re-buy and recommend, is a good indicator of a customer loyal (faithful). In addition, customers who intend to re-buy and recommend the most likely to remain at a previous company.
CONCEPTUAL FRAMEWORK AND
HYPOTHESES
Service Qulity (X1)
Brand Image (X2)
Satisfaction (Y1)
Loyalty (Y2)
Figure 1
Conceptual Framework Model
Table 1 Hypothesis
No Hypothesis Sentence
H1 Service Quality affect to Student Satisfaction
H2 Brand Image affect to Student Satisfaction
H3 Service Quality affect to Student Loyalty
H4 Brand Image affect to Student Loyalty
H5 Student Satisfaction affect to Student Loyalty
METHODS
The object and subject of study
Muhammadiyah University of Surabaya (UMS), 17 Agustus University of Surabaya (UNTAG) and the University of WR Supratman (UNIPRA). While the subjects of the study were students of private universities as the research object.
Data Types and Data Collection Techniques
Data required in the study are primary data in the form of responses. The method of data collection is done by using a structured questionnaire surveys were given directly to the respondent.
Mechanical Sampling
This study used purposive sampling technique to sample criteria that college students who have a minimum term of 4 (four), because students with the
criteria considered to have been able to conduct an evaluation of the campus where they study. Samples taken as many as 100 students, where the sample was determined by accidentalsampling.
Variable Operational Definition and Measurement
The independent variables consist of Service Quality and Brand. The quality of service from the user’s perspective as something that consistently exceed customer expectations (Grönroos in Lovelock, 2010). Brand image is a total overview of the minds of consumers or targeted customers to your product or brand (Howard, 1989). Customer satisfaction is the accumulation of experience consumer purchase and consumption experience (Kotler, 2000).
The dependent variable in this research is Customer Satisfaction and Consumer Loyalty, which
Table 2
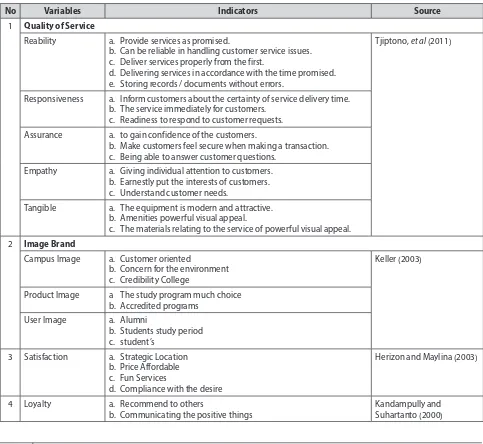
Variables and Indicator Research
No Variables Indicators Source
1 Quality of Service
Reability a. Provide services as promised.
b. Can be reliable in handling customer service issues. c. Deliver services properly from the first.
d. Delivering services in accordance with the time promised. e. Storing records / documents without errors.
Tjiptono, et al (2011)
Responsiveness a. Inform customers about the certainty of service delivery time. b. The service immediately for customers.
c. Readiness to respond to customer requests.
Assurance a. to gain confidence of the customers.
b. Make customers feel secure when making a transaction. c. Being able to answer customer questions.
Empathy a. Giving individual attention to customers. b. Earnestly put the interests of customers. c. Understand customer needs.
Tangible a. The equipment is modern and attractive. b. Amenities powerful visual appeal.
c. The materials relating to the service of powerful visual appeal.
2 Image Brand
Campus Image a. Customer oriented
b. Concern for the environment c. Credibility College
Keller (2003)
Product Image a The study program much choice b. Accredited programs
User Image a. Alumni
b. Students study period c. student’s
3 Satisfaction a. Strategic Location b. Price Affordable c. Fun Services
d. Compliance with the desire
Herizon and Maylina (2003)
measures purchases made repeatedly on the product / brand specific (Herizon and Maylina, 2003). For each indicator variables are presented in Table 2 below:
All variables were measured with a Likert scale has a weight of 1 to 5, with alternative answers from Strongly Disagree (STS) score of 1, Disagree (TS) score of 2, Neutral (N) score of 3 , Agree (S) score of 4, and Strongly Agree (SS) score of 5.
RESULTS AND DISCUSSION
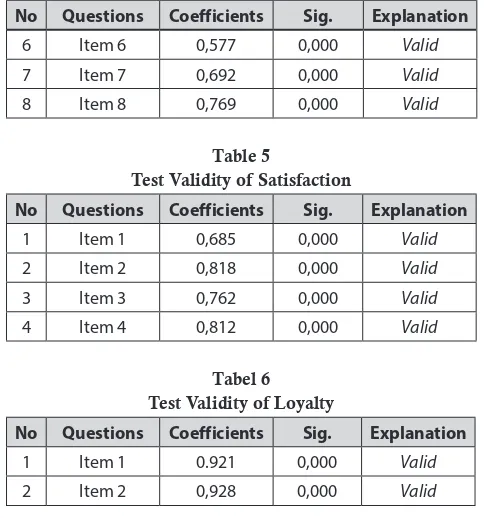
Test Validity
The validity of this research is done using the Product Moment Correlation with SPSS 17. the research instrument is said to be valid if the significance value less than 5% . From the test showed that all items declared invalid questions. Here are the results of testing the validity of each of the variables.
Table 3
Test Validity of Service Quality
No Questions Coefficients Sig. Explanation
1 Item 1 0,716 0,000 Valid
2 Item 2 0,870 0,000 Valid
3 Item 3 0,704 0,000 Valid
4 Item 4 0,575 0,000 Valid
5 Item 5 0,799 0,000 Valid
6 Item 6 0,810 0,000 Valid
7 Item 7 0,834 0,000 Valid
8 Item 8 0,910 0,000 Valid
9 Item 9 0,917 0,000 Valid
10 Item 10 0,822 0,000 Valid
11 Item 11 0,892 0,000 Valid
12 Item 12 0,854 0,000 Valid
13 Item 13 0,737 0,000 Valid
14 Item 14 0,851 0,000 Valid
15 Item 15 0,809 0,000 Valid
16 Item 16 0,827 0,000 Valid
Table 4
Test Validity of Brand Image
No Questions Coefficients Sig. Explanation
1 Item 1 0,764 0,000 Valid
2 Item 2 0,699 0,000 Valid
3 Item 3 0,640 0,000 Valid
4 Item 4 0,742 0,000 Valid
5 Item 5 0,632 0,000 Valid
No Questions Coefficients Sig. Explanation
6 Item 6 0,577 0,000 Valid
7 Item 7 0,692 0,000 Valid
8 Item 8 0,769 0,000 Valid
Table 5
Test Validity of Satisfaction
No Questions Coefficients Sig. Explanation
1 Item 1 0,685 0,000 Valid
2 Item 2 0,818 0,000 Valid
3 Item 3 0,762 0,000 Valid
4 Item 4 0,812 0,000 Valid
Tabel 6 Test Validity of Loyalty
No Questions Coefficients Sig. Explanation
1 Item 1 0.921 0,000 Valid
2 Item 2 0,928 0,000 Valid
Reliability Test
Based on the results of the calculations by using the computer program SPSS 17 obtained the results that the measurement tool used Cronbach’s because it has Alpha reliability greater than 0.6 (Sekaran, 2000). The results are presented in the Appendix of test reliability embodied in table 7.
Table 7 Reliability Test
Variabel Alpha Status
Service Quality 0,842 Reliabel
Bramd Image 0.799 Reliabel
Satisfaction 0,770 Reliabel
Loyalty 0,829 Reliabel
Table 8 Critical Ratio
Variabel CR P-Value
Service Quality → Satisfaction 9,454 0,000
Service Quality → Loyalty 6,545 0,000
Brand Image → Satisfaction 6,959 0,000
Brand Image → Loyalty 12,332 0,000
Satisfaction → Loyalty 4,350 0,000
Path Analysis Test
Analysis 1. Quality Service to Customer Satisfaction
CR value to influence the variable quality of service for student satisfaction in Table 8 above by 9.454 and p value of 0.000 <0,050. Thus the hypothesis that quality of service is positive and significant impact on student satisfaction acceptable. This suggests that service quality indicators consisting of tangibles, reliability, responsiveness, assurance and empathy, will be able to increase student satisfaction. Thus the higher the quality of service, the higher student satisfaction.These results strengthen the research undertaken results of this study strengthen the research of Sutino and Sumarno (2005), Moureen Margaretha (2004), Budi Agustiono and Sumarno (2006), Buchari Alma et al (2007), Zurni Zahara Naidoo (2005), Sutardji and Sri ISMI Maulidyah (2006) which concluded that the quality of service has a strong influence on customer satisfaction.
Analysis 2. Brand Image to Customer Satisfaction
CR value for variables influence the brand image of the college to the student satisfaction in Table 8 above by 6.959 and p value of 0.000 <0.050. Thus the hypothesis that the college’s brand image positive and significant impact on satisfaction mahasiswaditerimaThese results indicate that students have the satisfaction of Higher Education image. Satisfaction Accepted students are not separated because of the positive image built by the College. For example, College always put the customer, producing quality graduates, care about the environment, and has a course that has been accredited. This opinion is supported by Dharmmesta (1999) which says that
satisfaction can be formed because of the image / image of the company. If the image of the company is undoubtedly kredibelitasnya, the purchase is no longer through a long decision-making. In this condition, it can be said that the student satisfaction has been formed against the Higher Education.
Some research indicates that the image of the company has a significant influence on purchasing decisions. According to Howard (1989) in Ranto (2007) explains that the image have a role in marketing an organization because it potentially affects the perceptions and expectations of consumers about the goods or services offered and ultimately affect customer satisfaction and loyalty. To avoid the risk of large, consumers prefer to buy from providers of goods or services that have a good image (Norman, 1991 in Kadampully and Suhartanto, 2000).
Analysis 3. Service Quality to Customer Loyalty
R value to influence the variable quality of service to the loyalty of students in 8 above by 6.545 and p value of 0.000 <0.050. Thus the hypothesis that posirif layananberpengaruh quality and significant impact on student loyalty received. This suggests that service quality indicators consisting of tangibles, reliability, responsiveness, assurance and empathy, will be able to increase the loyalty of students. Thus the higher the quality of service, then the effect on the improvement of student loyalty.Empirically, the study’s findings support the opinion expressed Bloomer, et al (1998) which states that the better the quality of the services provided will increase customer loyalty. Salazar, et al (2004) also found that companies must continually improve customer loyalty by improving service quality.
Analysis 4. Brand Image to Customer Loyalty
CR value to variable influence brand image to the loyalty of college students in 8 above at 12.332 and 0.000 p value <0.050. Thus the hypothesis that the college’s brand image positive and significant impact on student loyalty acceptable. This shows that the brand image indicators of good colleges as a whole will be able to increase the loyalty of the students. Thus the higher the brand image of the college, the higher the loyalty of the students.
Leavy in Mowen and Minor (2002) that people often buy products not to the functional benefits but rather on its symbolic value. This symbolic value contains the identity or personality that is inserted into a product manufacturer or brand. Furthermore, the symbolic value that is contained in this brand consumers who will be perceived as a brand image.
On the other hand that the good image of a product can help consumers to take purchase decisions. Or in other words, a positive image of a product basically help simplification of consumer decision to purchase an item. With the help of this positive image that consumers can make decisions to buy and recommend the product to others.
Analysis 5. Customer Satisfaction to Customer Loyalty
CR Value for student satisfaction variables influence the loyalty of students in Table 8 above by 4.350 and p value of 0.000 <0.050. Thus the hypothesis that student satisfaction and significant positive effect on student loyalty acceptable. This indicates that the student satisfaction can improve student loyalty. Thus the higher the higher student satisfactionthe loyalty of studentsThese results reinforceto research conducted by Herizon and Maylina (2003) that there are two main variables that determine customer satisfaction and perceived performance expectations. If the perceived performance exceeds expectations, the customer will be satisfied, but if otherwise, the customer will be dissatisfied. He also explained that there is a direct effect on the perceived performance of customer satisfaction. Satisfaction is a variable that can lead to loyalty, the loyalty as the independent variable caused by a combination of satisfaction, obstacles diversion (switching barrier), suppliers and complaints.
CONCLUSIONS AND SUGGESTIONS
Conclusions
1. Quality of service is positive and significant impact on student satisfaction, the higher the quality of service higher student satisfaction. 2. Quality of service is positive and significant
impact on student loyalty, the higher the quality of service the higher the student loyalty.
3. Reputation colleges positive and significant impact on student satisfaction, the higher the
higher the reputation of the college student satisfaction.
4. Reputation colleges positive and significant impact on student loyalty, the higher the higher the reputation of the college student loyalty. 5. Satisfaction of students positive and significant
impact on student loyalty, the higher the higher student satisfaction student loyalty.
Suggestions
Findings of this research can benefit and contribute to the development of the theory of quality of service, the college’s image, satisfaction, and loyalty. Based on the conclusion, in order to increase students loyalty, the quality of service should be improved and universities must develop strategies to improve the image of the college better
REFERENCES
Andreassen, TW (1994), “Satisfaction, Loyalty and Reputation as Indicators of Customer Orientation in the Public sector, “International Journal of Public Sector Management, Vol. 7, No.2, pp.16-34.
Anwar, S (1997), Reliability and Validity, Yogyakarta: Sigma Alpha.
Aziz, Nasir (2001), “Image Supermarkets and Its Effect on Product Purchase Convinience in Banda Aceh,” Journal of Management and Business, Vol.3, No.2, (April) hal.177-194
Bloemer, J., and Ruyter, (1997), “On The Relationship Between Store Image, Store Satisfaction, and Store Loyalty”, European Journal of Marketing, Vol 32, No. 5.
Dharmmesta, BS (1999), “Customer Loyalty: A Conceptual Study For Free For Researchers,” Journal of Economic and Business Indonesia, Vol. 14, No. 3 things. 73-88. Herizon and Maylina W. (2003), “Factors Influencing on
Consumer Loyalty to brands Pepsodent Toothpaste in Surabaya,” Ventura, Vol. 6 No. 1, April, p. 98115. Howard, John A (1989), “Consumer Behavior in Marketing
Strategy”, Englewood Cliffs, NJ, Prentice-Hall, Inc. Kandampully, J and D. Suhartanto (2000), “Customer Loyalty
In The Hotel Industry: The Role of Customer Satisfaction and Image,” Journal of Contemporary Hospitality Management, 12/6, pp. 346 - 351.
Keller, Kevin L, 2003, “Conseptualizing, Measuring, and Managing Customer-Based Brand Equality,” Journal of Marketing, (January), 1-22.
Kotler, Philip (2000), “Marketing Management”, Millennium Editions, Prentice Hall Inc.
Mowen, JC and Minor, M. (2002), Consumer Behavior, Volume I, Fifth Edition, Jakarta: Erland.
Ranto, DWP (2007), “The Effect of Brand Image, Value, Quality and Customer Satisfaction perceived to Customer Loyalty”, Utilities, Vol XV No. 2 (July), p. 23-34. Salazar, A., Paulo, R., and Jorge, C., (2004), “Relationship
Between Service Quality, Customer Satisfaction, and Behavioral Intention”, International Business Research, Col 5, No. 2.
Selnes, F . (1993), “An Examination of the Effect of Product Performance on Brand Reputation, Satisfaction and Loyalty,” Journal of Marketing, Vol. 27 No. 9, pp 19-35.
Sitinjak, Tony., (2005), “The Effect of Brand Image and Brand Attitude Toward Brand Equity”, ISSN Vol. 12. Suhartanto, D (2001), “Customer Satisfaction: Influence
on Consumer Behavior in the Hospitality Industry,” Entrepreneurship, 7 Th. XXX (July), p. 42-47.
Tjiptono, F (2005), Brand Management and Strategy, Yogyakarta: Andy Offset.