© Author(s) 2017. CC BY-NC-ND Attribution 4.0 License.
Specific Peak Discharge of Two Catchments Covered by Teak
Forest with Different Area Percentages
Tyas Mutiara Basuki*, Wahyu Wisnu Wijaya, Rahardyan Nugroho Adi Watershed Management Technology Center, Jl. A. Yani-POBOX 295, Pabelan, Surakarta
* Corresponding author (email: [email protected])
Received: 24 January 2017 / Accepted: 30 March 2017 / Published: 01 July 2017
Abstract.In a watershed, forest has important roles in relation with peak discharge. This research was conducted to study the impacts of teak forest on peak discharge. On-screen digitising of IKONOS imagery was done to classify the land cover of the study area. Kejalen and Gagakan catchments covered by 74% and 53% of old teak forests respectively, were chosen as the study areas.These catchments are located in Blora Regency. Automatic water level recorder was set at the outlet of each catchment subsequently, and peak discharges were examined from the recorded data. During the observation, there were 36 evidences of specific peak discharge. The results showed that a trend of lower peak discharges occurred in Kejalen catchment which has the higher percentage of teak forest area in compared to Gagakan catchment with lower percentage of teak forest area, except when extreme rainfalls happened. At rainfall of 163 mm/day, specific peak discharge in Kejalen was higher than in Gagakan catchment. Although there is a relationship between specific peak discharge and the percentage of forest cover area, the increase of specific peak discharge is not only affected by forest cover, but also affected by daily rainfall, antecedent soil moisture, and rainfall intensity. Coefficients of determination between specific peak discharge and daily rainfall are 0.64 and 0.61 for Kejalen and Gagakan catchments, respectively.
Keywords:Peak discharge, teak forest, catchment.
Abstrak. Persentase penutupan hutan Daerah Aliran Sungai (DAS) berperanan penting dalam menentukan puncak debit. Oleh karena itu telah dilakukan penelitian yang bertujuan
untuk mempelajari pengaruh hutan jati (Tectona grandis) terhadap puncak debit. Klasifikasi
penutupan lahan dilakukan dengan digitasi secara langsung pada citra IKONOS. Dua sub-DAS yaitu Kejalen dan Gagakan yang masing-masing arealnya tertutup hutan jati tua sebesar 74 dan 53% dari luas DAS dipilih sebagai areal penelitian. Secara administrasi kedua sub-DAS tersebut terletak di Kabupaten Blora. Pencatat tinggi muka air sungai otomatis dipasang pada masing-masing outlet sub-DAS. Selama penelitian diperoleh 36 kenaikan debit yang disebabkan oleh curah hujan 12 hingga 163 mm/hari. Hasil yang diperoleh menunjukkan terjadi kecenderungan pada sub-DAS yang mempunyai hutan jati lebih banyak (Kejalen) puncak debit kurang dibandingan sub-DAS yang persentase hutannya lebih rendah (Gagakan), kecuali pada curah hujan ekstrem. Pada hujan 163 mm/hari, puncak debit di sub-DAS Kejalen lebih tinggi daripada di sub-DAS Gagakan. Walaupun terdapat hubungan antara puncak debit dengan luas penutupan hutan, tetapi kenaikan debit puncak tidak saja dipengaruhi penutupan hutan, tetapi juga oleh hujan harian, kelembaban tanah sebelum terjadi puncak debit, dan intensitas hujan.
Koefisien determinasi antara puncak debit dan hujan harian di sub-DAS Kejalen adalah 0,64
dan 0,61 di sub-DAS Gagakan.
Kata Kunci: Puncak debit spesifik, hutan jati, Daerah Aliran Sungai (DAS).
1. Introduction
Hydrological responses of catchments are affected by the natural and management factors. The natural aspects are catchment
size (Birkinshaw & Bathurst, 2011; Asfaha
Vannier et al., 2014). In addition, rainfall and its components is a main natural factor due to its role as an input for water resources such as catchments or watersheds. Flood generation in small watershed is intensively affected by rainfall (Anna et al., 2011; Paschalis et al., 2014). Besides natural factors, land management, e.g. land cover, is also a determinant factor that controls water intake of a watershed (Asfaha et al., 2015).
Furthermore, Brown et al. (2015) emphasised that in a forested catchment, there are two main factors that influence the hydrological behaviour, namely climatic condition and forest cover changes. In a small catchment, the natural factors, such as climate, geology, soil type, and topography, are relatively the same, consequently, the change of land cover or forest cover will influence the stream flow (Isik et al., 2013). Junaidi & Tarigan (2011) in their modelling using Soil Water Assessment Tool (SWAT) have found that forests less effect on peak discharges for watersheds with area between 100 and 500 km2, however, the forests more influence in regulating stream water continuity and reducing peak discharge.
Research of the impact of forest on water yield has been conducted for long time, however, the results are vary. A negative correlation between the increase forest areas and peak flow, and conversely, a positive correlation between the decrease of forest areas (Birkinshaw & Bathurst, 2011). A similar results has been found by (Iroumé et al., 2006) in Southern Chile. Based on data from 1997 to 2002 (Iroumé et al., 2006), have found that change in peak discharge is not only affected by
forest cover areas, however it is also influenced by rainfall characteristics.
Although impacts of forest cover on peak discharge have been examined by several researchers, but they mostly focused their investigation on boreal and temperate regions, for instance in pine plantations (Bosch & Hewlett, 1982; Scott & Lesch, 1997; Iroumé et al., 2013; Du et al., 2015). Meanwhile, studies on the impacts of teak (Tectona grandis) on the hydrological behaviours of catchments are hardly found. In addition, teak plantation has a unique characteristic in which the trees shed their leaves during the dry season in order to reduce transpiration. Therefore, this research was conducted to determine the impacts of different percentages of teak forest area on the hydrological responses in two catchments.
2. Research Methods
a. Description of the Study Area
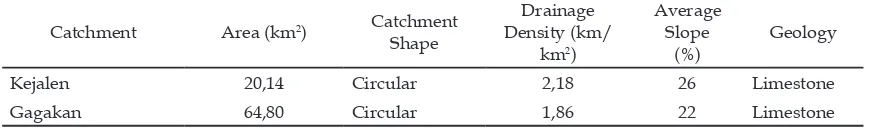
The study was conducted in two catchments with different percentages of teak forest area. The first was Kejalen catchment and the second was Gagakan catchment which, respectively, 74% and 53% of their areas are covered with old teak forest. Field check was carried out in August and November 2016. The forest areas are included in the Forest Management Unit (KPH) of Cepu. Administratively, the study area is situated in Blora Regency. The dominant soil type in the study area is Vertisols. The characteristics of the catchments are presented in Table 1. In addition, the data of monthly rainfall of the study area, from 2011 to 2015, is provided in Table 2.
Table 1. The Characteristics of the Catchments
Catchment Area (km2) Catchment
Shape
Kejalen 20,14 Circular 2,18 26 Limestone Gagakan 64,80 Circular 1,86 22 Limestone
Table 2. Monthly Rainfall of the Study Area.
Year Monthly Rainfall (mm)
Jan Feb Mar Apr May Jun Jul Aug Sep Oct Nov Dec Total
2011 198 142 146 48 72 6 1 0 20 92 345 295 1365
2012 189 135 145 42 130 41 0 0 4 35 308 280 1309
2013 183 145 137 160 89 92 50 0 5 20 83 229 1193
2014 195 156 201 179 130 102 14 0 5 28 121 241 1372
2015 172 388 288 275 46 12 0 0 0 0 53 148 1382
Avg 188 193 183 141 93 50 13 0 7 35 182 239 1324
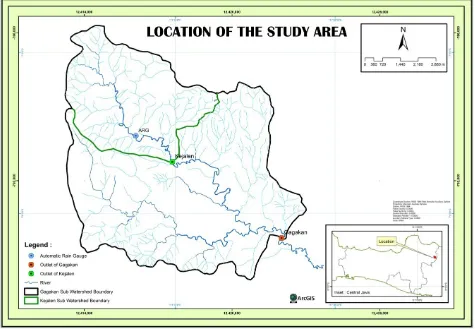
Figure 1. The Rivers and Outlets of the Kejalen Catchment and Gagakan Catchment.
b. Data Collection
The data of rainfall was obtained by using an automatic and conventional rain gauges. Stream water level was recorded by using two automatic water level recorders (loggers). The loggers were installed in the outlet of Kejalen and Gagakan catchments as illustrated in Figure 1. The Gagakan catchment is located below Kejalen catchment. The stream water
level was set to record every five minutes. Rainfall was recorded using automatic rainfall recorder.The land cover map was derived from IKONOS imagery of Google Earth 2015. All of the data were measured and analysed by the research team.
was applied to obtain information of stand characteristics of the old and young teak plantation. The sample plot was 20 by 20 m, and inside the plots were measured diameter at breast height (DBH), free branch height, total height and projected canopy width.The projected of canopy height was measured from two directions, which were North–South and East–West. All of the data were measured by the researchers team.
c. Data Analysis
Rainfall intensity was analysed based on the recording paper (pias paper) of the automatic rainfall gauge. The rainfall intensity of every recorded rainfall event was calculated and it was represented in mm/hour unit. When the duration of rainfall event was less than one hour the rainfall intensity was calculated by converting the amount of rainfall during rainfall event into an hour unit.
The logger recorded the stream water level for every 5 minutes. To obtain the discharge data, the data of stream water level was converted by using rating curve equation. The equations are:
Kejalen Catchment
Q = Discharge (m3/second)
H = Stream water level (m).
After the conversion of stream water level into discharge, the rainfall events that showed the phenomenon of increased discharge were classified. Subsequently, the highest discharge of each rainfall was considered as the peak discharge for the corresponding date. The peak discharge for Kejalen catchment was in m3/
second/20.14km2 and for Gagakan catchment
was in m3/second/64.80km2. To compare the
peak discharge of the catchments with different areas, the unit of peak discharge (m3/second/
unit area of the catchment) was divided based
on area of the each catchment. The resulted unit was in m3/second/km2 and the common term
is specific peak discharge. Furthermore, the specific discharge data from the two catchments were compared. Regression analysis was conducted between the daily rainfall and the specific peak discharge. In addition, the regression was also done between daily rainfall and discharge as conducted by Asfaha et al. (2014) in their research. In this study, we referred to Robinson et al. (2003) who reaffirmed that peak
discharge is not necessarily the peak discharge that causes over-bank flooding. Furthermore, the Antecedent Soil Moisture Content (ASMC) is calculated from the amount of rainfall during 5 (five) days before the peak discharge occurs as suggested by Dune and Leopold (1978).
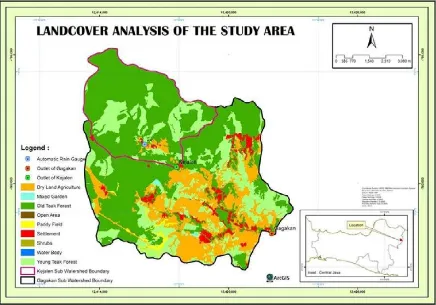
The image from Google Earth was classified into several cover types, which are old and young teak forests, paddy field (sawah), dry land agriculture, shrub, water body, mixed garden, and settlement. During the classification the teak forest was differentiated into old and young teak forest. The data from the forest inventory were averaged and presented in Tables.
3. Results and Discussion a. Land cover of the study area
The projected canopy of the old stands are wider than the young ones. At the old teak forest, the projected canopy width reaches more than 10 m, however, at the young teak forest the widest is 7.8 m. The density of canopy will
influence the evapotranspiration of trees, and therefore it will affect water yield (Igarashi et al., 2015). According to Bruijnzeel (2004), the older the trees the higher the evapotranspiration.
Figure 2. Spatial Distribution of Land Cover of the Study Area.
Table 3. The Characteristic of Old Teak Plantation
Plot Number
Diameter at Breast Height
(cm)
Average Free Branch Height
(m)
Average Total Height (m)
Average of Pro-jected Canopy
Width
1 32.4 6,9 18.5 6.8
2 49.2 16.3 23.5 10.2
3 28.8 10.8 19.9 5.9
Table 4. The Characteristic of Young Teak Plantation
Plot Number
Diameter at Breast Height
(cm)
Average Free Branch Height
(m)
Average Total Height (m)
Average of Project-ed Canopy Width
1 10.5 2.6 7.8 3.5
2 16.6 5.6 13.5 4.1
3 16.4 4.7 12.6 7.8
4 8.0 8.2 8.2 2.3
5 13.2 3.1 11.3 4.3
b. Specific Peak Discharge at Various
Amount of Rainfall
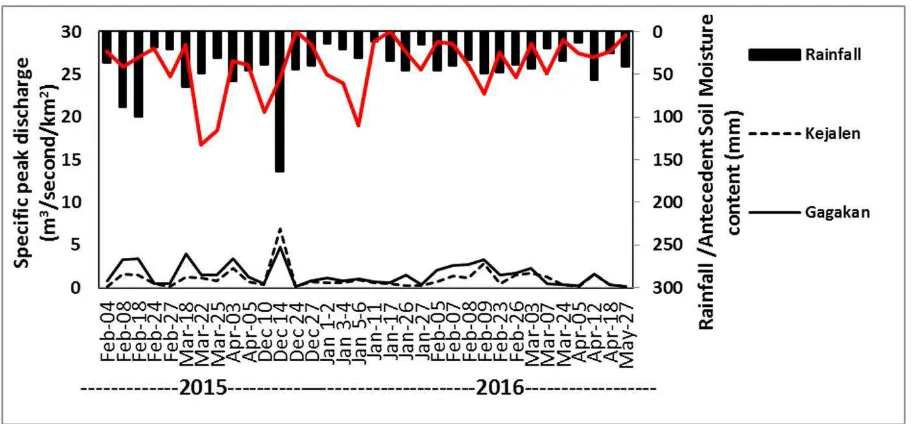
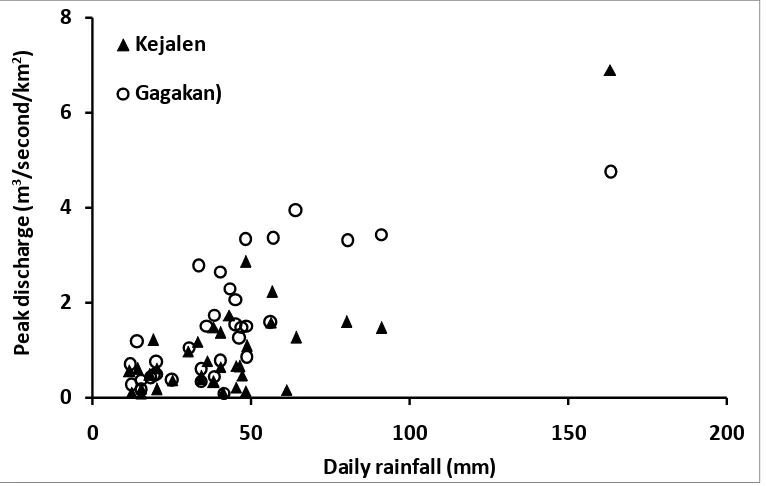
Specific peak discharge and rainfall analysis based on the data of January 2015– May 2016 are illustrated in Figure 3. During this period, there were 36 increased discharges were recorded. It shows that the increase of discharge might be caused by daily rainfall of 12 to 163 mm/day (Figure 3). However, the increase in rainfall is not always followed by the increase in specific peak discharge. For instance, on February 8, 2015, the rainfall at Kejalen catchment area was 88 mm (Figure 3) and the specific peak discharge was 1.60 m3second/km2, however Gagakan catchment in February 18, 2015 the rainfall is 99 mm but the specific peak discharge is 1,47 m3/second/ km2 (Figure 3). The possible reasons for this condition are the differences of the rainfall intensity and the ASMC, which is the amount of rainfall in five days before the occurrence of peak discharge. On February 8, 2015, the rainfall intensity was 70 mm/hour and the ASMC was 40 mm, while on February 18, 2015, the rainfall intensity was 31 mm/hour and the ASMC was 30 mm. Regarding to the impact of ASMC on peak discharge, Pramono et al (2016) have found that the correlation between ASMC and peak discharge in pine forest is low, it ranges from 5% to 13%. In contrast, Zehe et
al. (2010) have observed that ASMC has strong correlation with direct runoff. This differences of the research findings is because the complexity of the interaction between variables within the catchment. However, the effect of ASMC on the peak discharge is complex, it is not a single factor, however it also depend on other variable of the catchment which are soil depth and permeability as well as land cover (Lane & Mackay, 2001).
To examine the relationship between rainfall and specific peak discharge of the study area, these two variables were inputted into a diagram by using scatter plot and the result is provided in Figure 4. The coefficients of determination between rainfall and specific peak discharge of Kejalen catchment and Gagakan catchment were 0.64 and 0.61, respectively. As the comparison, previous study conducted by Gebreyohannes et al. (2014) found the result of regression analysis between daily rainfall and peak discharge, in which the coefficient of determination was 0.50–0.94 with confidence interval of 99% in 11 observed catchments. In addition, Hartini et al. (2015) applied vector autoregression on rainfall and discharge at Sojomerto, Juwero, and Glapan, which obtained the relationship between those variables of 6.4%–70%.
Figure 4. Scatter Plot of Daily Rainfall (mm) and Specific Peak Discharge (mm)
c. Specific Peak Discharge at the Catchments with Different Area
Percentages of Teak Forests
Analysis on specific peak discharge of 36 evidences showed a trend in which the Kejalen catchment which has higher percentage of teak forest has relatively lower peak discharges in compared to the Gagakan catchment which has lower teak coverage. The result are illustrated in Figure 5. However, at extreme rainfall,
there is a propensity of uncertainty response of catchment regarding with peak discharge. It can be examined from the data of extreme rainfall occurred on December 14, 2015 (Figure 6). At the time, although Kejalen catchment has higher teak coverage in compared to Gagakan catchment, in an extreme rainfall reaching 163 mm/day with rainfall intensity of 70 mm/ hour, the peak discharge of Kejalen catchment was higher than of Gagakan catchment.
0
Figure 5. Scatter Plot of Rainfall vs Specific Peak Discharge of Kejalen and Gagakan Catchments.
During the rainfall of 163 mm/day, the peak discharge in Kejalen was 6.9 mm, which was higher than in Gagakan catchment of 4.7 mm. It indicates that in heavy rainfall (163 mm/day), the role of teak forest cover to reduce the peak discharge is insignificant and less effective. According to Barthurst et al. (2011), forest cover insignificantly reduces
(Sawah). Such land use acts as a sink for rainfall
and retains the rainwater before it flows to the river, while there was no paddy field in Kejalen catchment area.
Figure 6. Specific Peak Discharge at an Extreme Rainfall Event at Kejalen and Gagakan Catchments
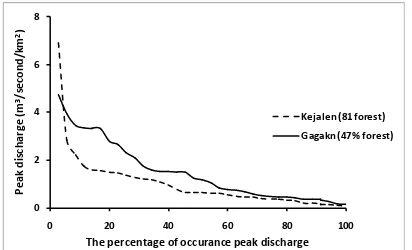
Although forest cover has uncertainty on peak discharge, however, an extreme peak discharge actually rarely happens. The cumulative frequency of the peak discharge is provided in Figure 7. It can be seen that
the higher the peak discharge, the lower the frequency of peak discharge. In this study, the dominant specific peak discharge was less than 1 m3/second/km2.
0 2 4 6 8
0 20 40 60 80 100
P
e
a
k
d
is
ch
a
rge
(
m
3
/s
e
co
n
d
/k
m
2
)
The percentage of occurance peak discharge
Kejalen (81 forest)
Gagakn (47% forest)
Figure 7. The Percentage of Peak Discharge Occurrence at the Kejalen and Gagakan Catchments.
4. Conclusions
Daily rainfall, of 12 to 163 mm/day, causes the increase of streamflow in Kejalen catchment and Gagakan catchment. In addition, this study indicates a trend that the peak discharge at the catchment with larger teak forest cover (Kejalen catchment) is lower
factors including daily rainfall, antecedent soil moisture content, and rainfall intensity. The coefficient of determination between peak discharge and daily rainfall was 0.64 at the catchment with higher percentage of forest cover (Kejalen catchment) and 0.61 at the catchment with lower percentage of teak forest (Gagakan catchment).
5. Acknowledgements
The authors would like to express gratitude for Watershed Management Technology Center for the financial support of this research. Furthermore, we would like to thank to the reviewers who provided constructive suggestions.
6. References
Anna, A.N., Suharjo, dan Cholil, M. (2011) Analisis Fluktuasi Hujan dan Morfologi Sungai Terhadap Konsentrasi Banjir Daerah Surakarta. Forum Geografi, 25 (1): 41-52.
Asfaha, T.G., Frankal, A., Haile, M., Zenebe, A., and Nyssen, J. (2015) Determinants of Peak Discharge in Steep Mountain Catchments–Case of the Rift Valley Escarpment of Northern Ethiopia. Journal of Hydrology529 (3): 1725-1739.
Ayalew, T.B., Krajewski, W.F. & Mantilla, R. (2014) Connecting the Power-Law Scaling Structure of Peak-Discharges to Spatially Variable Rainfall and Catchment Physical Properties.
Advances in Water Resources, 71: 32–43.
Bathurst, J.C., Iroumé, A., Cisneros, F., Fallas, J., Iturraspe, R., Novillo, M.G., Urciuolo, A., De Bièvre, B., Borges, V.G., Coello, C., others (2011) Forest impact on floods due to extreme rainfall and snowmelt in four Latin American environments 1: Field data analysis. Journal of Hydrology 400: 281–291.
Birkinshaw, S.J. Iroumé, A., and Palacios, E. (2011) The Effect of Forest Cover on Peak Flow and Sediment Discharge—An Integrated Field and Modelling Study in Central–Southern Chile,
Hydrological Processes, 25: 1284–1297.
Bosch, J.M. and Hewlett, J.D. (1982) A Review of Catchment Experiments to Determine the Effect of Vegetation Changes on Water Yield and Evapotranspiration. Journal of Hydrology, 55: 3-23.
Brown, S.C., Versace, V.L., Lesker, R.E., Walter, M.T. (2015) Assessing the Impact of Drought and Forestry on Streamflows in South-Eastern Australia Using a Physically Hydrological Model. Environmental Earth Sciences. DOI 10.1007/s12665-015-4628-8.
Bruijnzeel, L.A. (2004) Hydrological functions of tropical forests: not seeing the soil for the trees?
Agriculture, ecosystems & environment 104: 185–228.
Du, E., Link, T.E., Wei, L., and Marshall, D. (2015) Evaluating Hydrologic Effects of Spatial and Temporal Patterns of Forest Canopy Change Using Numerical Modelling. Hydrological Processes. DOI: 10.1002/hyp.10591.
Dunne, T. and Leopold, L.B. (1978) Water in Environmental Planning. New York: W.H. Freeman and Company.
Genreyohannes, T., Frank, A., Haile, M., Abraham, A., Monsieurs, E., and Nyssen, J. (2015) Peak Discharge in Steep Mountain Catchments in Relation to Rainfall Variability, Vegetation Cover and Geomorphology of the Rift Valley Escarpment of Northern Ethiopia.Geophysical Research Abstract. Vol.17, EGU 2015-2947-1. EGU General Assembly 2015.
Geris, J., Tetzlaff, D., McDonnell, J., and Soulsby, C. (2014) The Relative Role of Soil Type and Tree Cover on Water Storage and Transmission in Northern Headwater Catchments.
Hydrological Process. DOI: 10.1002/hyp.10289.
Igarashi, Y., Kumagai, T., Yoshifuji, N., Sato, T., Tanaka, N., Tanaka, K., Suzuki, M., Tantasirin, C. (2015) Environmental control of canopy stomatal conductance in a tropical deciduous forest in northern Thailand. Agricultural and Forest Meteorology 202: 1–10.
Iroumé, A. and Palacios, H. (2013) Afforestation and Changes in Forest Composition Affect Runoff in Large River Basins with Pluvial Regime and Mediterranean Climate, Chile. Journal of Hydrology, 505: 113-125.
Isik, S., Kalin, L., Schoonover, J.E., Srivastava, P., and Lockaby, B.G. (2013) Modeling Effects of Changing Land Use/Cover on Daily Streamflow: An Artificial Neural Network and Curve Number Based Hybrid Approach. Journal of Hydrology, 485: 103–112.
Junaidi, E., Tarigan, S.D. (2011) Pengaruh hutan dalam pengaturan tata air dan proses sedimentasi Daerah Aliran Sungai (DAS): Studi Kasus di DAS Cisadane. Jurnal Penelitian Hutan dan Konservasi Alam,8(2): 155-176
Lane, P.N., Mackay, S.M. (2001) Streamflow response of mixed-species eucalypt forests to patch cutting and thinning treatments. Forest Ecology and Management 143: 131–142.
Paschalis, A., Fatichi, S., Molnar, P., Rimkus, S., and Burlando, P.(2014) On the Effects of Small Scale Space-Time Vaiability of Rainfall on Basin Flood Response.Journal of Hydrology, 54: 313-327.
Pramono, I.B., Wahyuningrum, N., Wuryanta, A. (2016) Penerapan Metode Rational Untuk Estimasi Debit Puncak Pada Beberapa Luas Sub DAS. Jurnal Penelitian Hutan dan Konservasi Alam 7: 161–176.
Robinson, M., Cognard-Plancq, A.L., Consandey, C., David, J., Fűhrer, H.W., Hall, R., Hendriques, M.O., Marc, V., McCarthey, R., McDonnell, M., Martin, C., Nisbet, I., O’Dea, P., Rodgers, M., and Zollner, A. (2003) Studies of the Impact of Forests on Peak Flows and Baseflows: a European Perspective. Forest Ecology and Management, 186: 85-97.
Scott, D.F. and Lesch, W. (1997) Streamflow Responses to Afforestation with Eucalyptus grandis and Pinuspatula and to Felling in the Mokobulaan Experimental Catchments, South Africa. Journal of Hydrology, 199: 360–377.
Stoelzle, M., Stahl, K., Morhard, A., Weiler, M.(2014) Streamflow Sensitivity to Drought Scenarios in Catchments with Different Geology. Geophysical Research Letters, 41(17):6174–6183. Vannier, O., Braud, I., and Anquetin, S. (2014) Regional Estimation of Catchment-Scale Soil
Properties by Means of Streamflow Recession Analysis for Use in Distributed Hydrological Models. Hydrological Processes, 28(26): 6276–6291.