Refer to Important disclosures in the last page of this report
Stock DataTarget price (Rp) Rp1,010
Prior TP (Rp) Rp850
Shareprice (Rp) Rp1,090
Upside/downside (%) (8,0)
Sharesoutstanding (m) 6,186
Marketcap. (US$ m) 444
PT Indoritel Makmur Intl’ 25,8%
Bonlight Investment, Ltd 20,7%
Demeter Indo Investment Pte. 15,2%
Estimate Change; Vs. Consensus
2018F 2019F
PT Indo Premier Sekuritas [email protected] +62 21 5793 1168
Seeking new growth equilibrium
Low sales return rate hosts better 3Q18 earnings.
Product dropping optimization wanes revenue growth.
New product introduction shall support the future growth.
Maintained HOLD albeit with higher TP of Rp1,010.
3Q18 earnings improved though still below consensus. PT Nippon Sariroti (ROTI)
booked a 9M18 net profit of Rp103bn (+6% yoy), forming 65%/68% of our and market FY18F consensus. On quarterly basis, the net sales hiked to Rp709bn (+11% yoy) due to a significant improvement in 3Q18 sales return rate to 10.5% of gross sales (2Q18: 20%). This better return rate also expands 3Q18 GPM, OPM, and NPM to 53%, 11%, and 9%, consecutively (2Q18: 52%, 1%, and 2%) and helps easing selling expenses growth (+10% yoy vs. 5-yr Avg. at 16%) as a lower return plunges defective inventory costs (-18% yoy) which account for a fifth of total operating costs.
Product dropping reoriented. A high product return as witnessed in last five quarters
(c.19%-26%) was resulted from an aggressive introduction of 45 new SKUs with an improper product placing. ROTI mitigated this by harnessing its in-house algorithm processing the bought big data from its Modern Trade (MT) partner, Indomart and Alfamart, to determine its product dropping and this partially explains a lukewarm gross sales growth of 9% in 9M18 (vs. 5-yr Avg. at 16%) besides industry competition. Presumably, a moderating 3Q18 return rate is also a by-product of this initiative. We thus lower our return rate forecast to 18%/16% (from 19%) and our gross sales growth assumption by 3%/4% in FY18F/19F to account for lower penetration rate in its MT channel due to the optimization of dropping strategy.
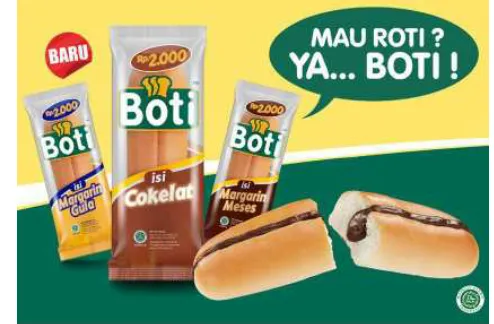
New product launched. ROTI introduces a new fighting brand “Boti” to penetrate the
Indonesia and The Philippines General Trade (GT) channel in October 2018 and 1Q19, respectively. This channel carries no product return, better operating turnovers, and an upfront payment feature. ROTI starts with 3 SKUs (sugar-coated margarine, chocolate, and filled chocolate sprinkle margarine). This 12-day shelf life bread is priced at Rp2,000 to capture the low-income segment. We factored in this step by increasing GT segment sales (3-yr CAGR FY17-20F at 23%) to 21%-23% for FY18F-20F (3-yr Avg. at 20%).
Maintained HOLD with higher TP of Rp1,010. We tweaked our earnings forecast by
5%/-6% for FY18F/19F as we consider three factors. First, we remain cautious on ROTI’s acumen to manage the opportunity cost of low return rate as an improved product return potentially brings down revenue growth due to selective product dropping in its MT channel (which contributes to more than half of gross sales). Second, an expansion to GT channel should unleash positive growth catalyst both in ROTI’s domestic and overseas market, with the caveat on competition. Third, we expect 100bps decrease in FY19F GPM due to an upward adjustment (+5%) in its flour contract (c.40% of COGS) which will be renewed in 1Q19. We transfer coverage from Putri Tobing to Willy Goutama and maintained our HOLD rating for the stock with higher TP of Rp1,010 (reflecting target P/E FY18F of 37.4x).
Nippon Indosari
(
ROTI IJ
)
Source: ROTI, IndoPremier Share Price Closing as of : 23-October-2018
ROTI IJ Results Note
2
Refer to Important disclosures in the last page of this report
Fig. 1: Gross and Net Sales (rolling 4-q) vs. Return Rate Fig. 2: Revenue growth remains frail
Source: Indopremier, ROTI Source: Indopremier, ROTI
Fig. 3: GT channel spiked up as ROTI introduced Boti in Oct’18
Fig. 4: Expects better return rate and margins
Source: Indopremier, ROTI Source: Indopremier, ROTI
Fig. 5: Shelving optimization should lower operating cycles Fig. 6: ROTI introduced 3 new SKUs to penetrate GT channel
Source: Indopremier, ROTI Source: ROTI
0%
Return Rate (% GS) Gross Sales Net Sales
-10%
Gross Sales % Growth
78%
2011 2012 2013 2014 2015 2016 2017 2018F 2019F 2020F
MT GT
2013 2014 2015 2016 2017 2018F 2019F 2020F
GPM OPM NPM
2011 2012 2013 2014 2015 2016 2017 2018F 2019F 2020F
3
Refer to Important disclosures in the last page of this report
Year To 31 Dec (RpBn) 2016A 2017A 2018F 2019F 2020F
Cash & Equivalent 611 1.895 1.352 1.209 662
Receivable 280 324 274 312 352
Inventory 51 50 63 73 84
Other Current Assets 7 51 3 4 4
Total Current Assets 949 2.320 1.693 1.598 1.102
Fixed Assets - Net 1.842 1.994 2.380 2.739 3.071
Goodwill 62 62 63 63 63
Non Current Assets 68 184 0 0 0
Total Assets 2.921 4.560 4.135 4.400 4.236
ST Loans 0 119 0 0 0
Payable 172 149 0 208 239
Other Payables 148 260 196 228 261
Current Portion of LT Loans 0 499 0 500 0
Total Current Liab. 321 1.027 375 936 499
Long Term Loans 996 498 500 0 0
Other LT Liab. 160 214 200 220 242
Total Liabilities 1.477 1.739 1.075 1.156 741
Equity 274 1.582 1.708 1.708 1.708
Retained Earnings 1.127 1.193 1.347 1.572 1.867
Minority Interest 43 46 6 (36) (80)
Total SHE + Minority Int. 1.444 2.821 3.061 3.244 3.495
Total Liabilities & Equity 2.921 4.560 4.135 4.400 4.236
ROTI IJ Results Note
4
Refer to Important disclosures in the last page of this report
Year to 31 Dec 2016A 2017A 2018F 2019F 2020F
Cash Flow
Net Income (Excl.Extraordinary&Min.Int) 280 135 206 284 371
Depr. & Amortization 95 114 146 174 200
Changes in Working Capital (46) 15 (5) (9) (10)
Others 157 (23) (73) (32) (90)
Cash Flow From Operating 486 241 274 417 471
Capital Expenditure (170) (384) (350) (533) (533)
Others 22 35 90 85 80
Cash Flow From Investing (148) (349) (260) (448) (453)
Loans 2 120 (616) 0 (500)
Equity 0 1.308 126 0 0
Dividends 0 0 0 0 0
Others (16) (35) (124) (62) (35)
Cash Flow From Financing (15) 1.393 (614) (62) (535)
Changes in Cash 323 1.284 (600) (93) (517)
Financial Ratios
Gross Margin (%) 51,6 52,5 54,3 53,3 52,5
Operating Margin (%) 15,2 8,1 7,6 9,1 10,6
Pre-Tax Margin (%) 14,7 7,5 10,0 12,1 14,0
Net Margin (%) 11,1 5,0 6,1 7,8 9,3
ROA (%) 9,9 3,3 3,8 5,7 7,6
ROE (%) 21,2 5,8 5,6 7,7 9,7
ROIC (%) 13,2 4,6 6,9 8,4 11,1
Acct. Receivables TO (days) 38,3 44,3 39,8 34,3 34,4
Acct. Receivables - Other TO (days) 0,0 0,0 0,0 0,0 0,0
Inventory TO (days) 26,0 23,5 22,2 21,5 21,4
Payable TO (days) 49,7 49,6 47,8 48,5 48,8
Acct. Payables - Other TO (days) 0,0 0,0 0,0 0,0 0,0
Debt to Equity (%) 69,0 39,6 16,3 15,4 0,0
Interest Coverage Ratio (x) 0,2 0,5 0,3 0,1 0,0
Net Gearing (%) 26,7 (27,6) (27,8) (21,9) (19,0)
Head Office
PT INDO PREMIER SEKURITAS
Wisma GKBI 7/F Suite 718
Jl. Jend. Sudirman No.28
Jakarta 10210 - Indonesia
p +62.21.5793.1168
f +62.21.5793.1167
INVESTMENT RATINGS
BUY : Expected total return of 10% or more within a 12-month period HOLD : Expected total return between -10% and 10% within a 12-month period SELL : Expected total return of -10% or worse within a 12-month period
ANALYSTS CERTIFICATION.
The views expressed in this research report accurately reflect the analysts personal views about any and all of the subject securities or issuers; and no part of the research analyst's compensation was, is, or will be, directly or indirectly, related to the specific recommendations or views expressed in the report.
DISCLAIMERS