Refer to Important disclosures in the last page of this report
Stock DataTarget price (Rp) Rp21,200
Prior TP (Rp) Rp20,500
Share price (Rp) Rp22,900
Upside/downside (%) (7.4)
Shares outstanding (m) 24,655
Market cap. (US$ m) 37,174
PT Dwimuria Investama 54.9%
Estimate Change; Vs. Consensus
2018F 2019F
PT Indo Premier Sekuritas [email protected] +62 21 5793 1168
Stronger growth outlook as rate rises
Modest profit growth in 9M18 (+10%) despite strong loan growth.
However, NIM downtrend reversed in 3Q (+17bps qoq) as rate rises.
Stable asset quality and credit cost in line with our expectation.
We raised our earnings and TP slightly but keep our HOLD rating.
Modest results.
BBCA’s net profit of Rp18.5tn in 9M18 (+9.9% yoy) came in line
with our forecast and consensus expectations. We view this as modest results,
with steady, albeit moderating, profit growth reflecting its strong asset quality.
Quarterly profit jumped 20% qoq in 3Q18, driven by better NIMs, strong trading
incomes while operating cost eased after seasonally higher costs in the first two
quarters. Going forward, we expect stronger earnings growth outlook in next 2
years, given a trend reversal in rates on the back of BI’s 125bps policy rate rises
this year, which usually has positive impact on BBCA’s NIMs.
NIM trend reversal
. BBCA’s NIM of 6.51% in 9M18 (our calculation) was only
8bps lower than in the prior year, reflecting the effect of declining rates which was
mitigated by much stronger loan vs. deposit growth (17.3% vs. 6.9%). However,
with interest rates started rising this year, owing to Indonesia’s worsening current
account deficit and its weakening currency, BBCA’s NIM widened to 6.62% in 3Q
(+17bps qoq), a trend which we believe will be sustained in next 2 years given
the bank’s strong deposit mix (CASA: 78%). BBCA’s strong loan growth was
driven by corporate lending (+23%) and commercial/SME loans (+17%) while its
consumer loans grew only 9% due to slowing home mortgage loans.
Asset quality
. BBCA’s asset quality remained very strong with low and stable
NPL ratio of 1.4% and high provision coverage of 187%. Over the past year, NPL
ratios for its corporate loans improved to 1.0% (from 1.2%), commercial/SME
loans eased to 2.0% (from 2.3%) while consumer NPLs worsened to 1.3% (from
1.1%). Meanwhile, the bank’s credit cost rose to 71bps in 3Q (2Q: 51bps) but at
only 46bps in 9M18, the credit cost was still lower than last year (56bps) and it
was still in line with our forecast assumption of 54bps for FY18F. We expect the
bank’s credit cost to remain at this levels in the next 2 years.
Valuation
. We raised our earnings forecasts by 3% for FY19F/FY20F on the back
of better NIMs, and lift up TP slightly to Rp21,200 (from Rp20,500). Our
GGM-derived TP assumes LT ROAE of 22.4% (from 22.0%), LT growth of 8.5%, cost of
equity of 12.5%. We estimate BBCA’s LT ROAE based on our DuPont analysis,
assuming LT ROAA of 2.80% and asset/equity leverage of 8x. Despite BBCA’s
steady growth, high earnings quality, and its stronger earnings growth outlook in
the next 2 years on the back of rising rates, we reiterate our HOLD rating due to
the stock’s premium valuation over peer major banks in Indonesia.
Bank Central Asia
(
BBCA IJ
)
26 October 2018
Results Note
HOLD
(Unchanged)
Year To 31 Dec 2016A 2017A 2018F 2019F 2020F
Operating income (RpBn) 53,643 56,950 62,586 69,915 78,379
PPOP (RpBn) 30,264 31,760 34,877 39,434 45,136
Source: BBCA, IndoPremier Share Price Closing as of : 25-October-2018
2
Refer to Important disclosures in the last page of this report
Fig. 1: Net Interest Income (Rp bn) and NIMs (%) Fig. 2: Non-Interest Income (Rp bn; % of Gross Income)
Source: Company, IndoPremier Source: Company, IndoPremier
Fig. 3: Operating Expense (Rp bn) and Cost/Income Ratio (%)
Fig. 4: Pre-Provision Profit (Rp bn; % of Average Assets)
Source: Company, IndoPremier Source: Company, IndoPremier
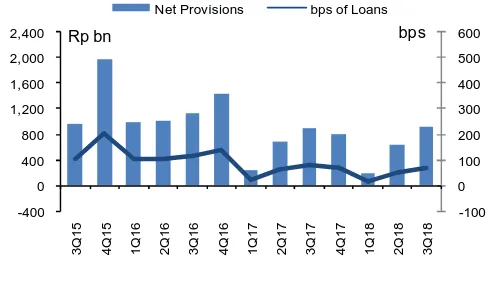
Fig. 5: Net Loan Provisioning (Rp bn; bps of Average Loans) Fig. 6: Net Profit (Rp bn) and ROAA (%)
Source: Company, IndoPremier Source: Company, IndoPremier
2%
Net Interest Income Net Interest Margin
Rp bn
Other Income Other Income % of Total
Rp bn
Operating Expenses Cost-Income Ratio
Rp bn
Pre-Provision Profit Pre-Provision Profit ROAA
Rp bn
Net Provisions bps of Loans
bps
Net Profit Net Profit ROAA
3
Refer to Important disclosures in the last page of this report
Third-Quarter 2018 Results
Results (Rp Bn) 9M18 9M17 % Y-Y 3Q18 2Q18 % Q-Q
Risk-Weighted Assets 623,734 544,478 14.6 623,734 601,841 3.6
Shareholders’ Funds 143,607 127,317 12.8 143,607 136,747 5.0
4
Refer to Important disclosures in the last page of this report
Year To 31 Dec (RpBn) 2016A 2017A 2018F 2019F 2020F
Income Statement
Interest income 50,426 53,768 57,076 67,386 77,131
Interest expense (10,347) (11,941) (11,888) (15,732) (18,868)
Net interest income 40,079 41,826 45,188 51,653 58,264
Fees and commissions 9,401 10,386 11,736 12,910 14,201
Trading income 2,210 1,772 2,400 1,600 1,600
Other operating income 1,954 2,966 3,262 3,752 4,315
Total operating income 53,643 56,950 62,586 69,915 78,379
Personnel expenses (10,630) (11,335) (12,469) (13,716) (14,950)
G&A expenses (11,229) (12,306) (13,536) (14,890) (16,230)
Other operating expenses (1,520) (1,550) (1,704) (1,875) (2,062)
Pre-provision operating profit 30,264 31,760 34,877 39,434 45,136
Provisions (4,561) (2,633) (2,743) (2,986) (3,688)
Loan recovery income 0 0 0 0 0
Operating profit 25,703 29,127 32,134 36,449 41,449
Non-operating profit 0 0 0 0 0
Exceptional items 0 0 0 0 0
Pre-tax profit 25,703 29,127 32,134 36,449 41,449
Income tax (5,207) (5,838) (6,555) (7,290) (8,290)
Minority interests (27) (11) 0 (10) (10)
Reported net profit 20,470 23,278 25,579 29,149 33,149
Balance Sheet
Cash 15,944 16,754 25,093 28,203 31,744
Current account with BI 40,597 43,473 44,083 49,369 55,380
Placements at BI & other banks 47,830 28,063 29,466 30,940 32,487
Short-term investments 44,365 76,977 85,987 96,161 107,667
Government bonds 72,019 69,388 75,278 78,700 82,293
Gross loans 427,866 480,584 551,287 632,457 695,703
Loan provisions (12,849) (13,686) (14,537) (16,072) (18,310)
Other assets 40,968 48,766 51,204 53,764 56,453
Total Assets 676,739 750,320 847,862 953,522 1,043,416
Customer deposits 530,134 581,115 651,749 731,950 823,177
Deposits from other banks 4,901 5,758 6,768 7,966 9,387
Securities and borrowings 5,121 3,651 4,016 4,418 4,860
Other liabilities 23,504 27,914 34,615 35,697 6,611
Total Liabilities 563,659 618,439 697,148 780,030 844,035
Share capital 7,105 7,090 7,090 7,090 7,090
Reserves and others 6,824 8,215 8,215 8,215 8,215
Retained earnings 98,503 115,998 135,291 158,045 183,907
Shareholders' equity 112,433 131,304 150,596 173,350 199,212
Minority interest 282 98 118 141 170
Total Liabilities & Equity 676,374 749,841 847,862 953,522 1,043,416
5
Refer to Important disclosures in the last page of this report
Year To 31 Dec 2016A 2017A 2018F 2019F 2020F
Growth Ratios (% yoy)
Gross loans 7.4 12.3 14.7 14.7 10.0
Total assets 13.9 10.9 13.0 12.5 9.4
Customer deposits 11.9 9.6 12.2 12.3 12.5
Net interest income 11.7 4.4 8.0 14.3 12.8
Non-interest income 13.2 11.5 15.0 5.0 10.2
Total operating income 13.6 13.3 10.3 13.4 13.7
Operating expense 7.7 7.7 10.0 10.0 9.1
PPOP 15.8 4.9 9.8 13.1 14.5
Net profit 13.7 13.7 9.9 14.0 13.7
Profitability Ratios
ROAA (%) 3.24 3.23 3.25 3.24 3.32
ROAE (%) 19.8 19.1 18.3 18.0 17.8
NIM (%) 7.17 6.59 6.53 6.58 6.72
Credit cost (bps) 114.7 59.4 53.8 50.4 55.5
Cost/income (%) 43.6 44.2 44.3 43.6 42.4
LDR (%) 80.7 82.7 84.6 86.4 84.5
CAR (%) 22.2 20.4 20.4 20.5 21.3
NPL ratio (%) 1.3 1.4 1.4 1.4 1.5
Provisions/NPL (%) 235.7 197.1 182.1 177.5 170.9
Head Office
PT INDO PREMIER SEKURITAS
Wisma GKBI 7/F Suite 718
Jl. Jend. Sudirman No.28
Jakarta 10210 - Indonesia
p +62.21.5793.1168
f +62.21.5793.1167
INVESTMENT RATINGS
BUY : Expected total return of 10% or more within a 12-month period HOLD : Expected total return between -10% and 10% within a 12-month period SELL : Expected total return of -10% or worse within a 12-month period
ANALYSTS CERTIFICATION.
The views expressed in this research report accurately reflect the analyst;s personal views about any and all of the subject securities or issuers; and no part of the research analyst's compensation was, is, or will be, directly or indirectly, related to the specific recommendations or views expressed in the report.
DISCLAIMERS