REPORT FHWA/NY/SR-00/134
Design, Fabrication, Construction, and
Testing of an FRP Superstructure
SREENIVAS ALAMPALLI JEROME O’CONNOR ARTHUR P. YANNOTTI
SPECIAL REPORT 134
TRANSPORTATION RESEARCH AND DEVELOPMENT BUREAU NEW YORK STATE DEPARTMENT OF TRANSPORTATION
DESIGN, FABRICATION, CONSTRUCTION, AND
TESTING OF AN FRP SUPERSTRUCTURE
Sreenivas Alampalli, Engineering Research Specialist II Jerome O’Connor, Civil Engineer III
Arthur P. Yannotti, Civil Engineer III
Special Report 134 December 2000
TRANSPORTATION RESEARCH AND DEVELOPMENT BUREAU
ABSTRACT
I. INTRODUCTION
The transportation infrastructure is the backbone of American commerce and industry, and includes more than 6.3 million km (3.9 million miles) or 12 million lane-km (8.1 million lane-miles) of public roads. Major highways incorporate more than 580,000 large bridges, according to the National Bridge Inventory. This network is deteriorating at an alarming rate and public agencies are hard-pressed to cope with this trend, due to the staggeringly high cost of repair and replacement (1).
Of these 580,000 bridges, more than 180,000 are deficient – 31.4 % or nearly one-third. The Federal Highway Administration (FHWA) estimates that repair of deficient or obsolete bridges will cost more than 20 billion dollars (2). Structural “deficiency” does not imply that a bridge is unsafe or likely to
collapse. With proper weight restrictions and enforcement, most deficient bridges can continue serving traffic safely when limited to posted maximum loads (3). The main reasons for classifying
a bridge as structurally deficient are low load ratings (or weight restrictions), deteriorated decks, or deteriorated substructures. About 114,000 bridges nationwide are posted or should be posted. More than 21,000 are classified as structurally deficient solely because of a low load rating, approximately 14,000 because of an inadequate substructure, and over 8,000 because of poor deck condition (1).
2
Table 1. Current status of bridges in New York State.
Owner Number of Bridges
New materials, methods, and technologies such as fiber-reinforced-polymer (FRP) composite systems, are badly needed for cost-effective strengthening of bridges. Also, sensing and monitoring technologies are necessary to collect long-term performance data on these materials. New York engineers have been seeking alternatives to steel and concrete that may be less vulnerable to environmental damage. Additionally, rising public concerns about traffic delays experienced during the construction increasingly concern influenced engineers to design bridges with materials and details that can be built rapidly. At the same time, life-cycle costs must be competitive with traditional materials because of the limited resources available to maintain the highway infrastructure.
Although relatively new in bridge applications in the United States, FRPs have a long record of use in Europe and Japan (4). New York has recently begun using and evaluating FRPs as viable
alternatives for bridge repair to strengthen deteriorated components, to remove load postings, and to prolong service life (5-8). This report describes one such application that allowed a deteriorated
Figure 2. Deteriorated superstructure.
5
II. BRIDGE STRUCTURE
New York State Route 248 is a rural two lane highway in Steuben County. There is an average daily traffic of approximately 300 vehicles per day, 17% of which is truck traffic. The economy in the area is agriculturally based, therefore the highway regularly carries farm vehicles, milk trucks, and logging trucks. The road is classified as a rural major collector.
The bridge crossing Bennetts Creek, just south of Rexville, NY, is a state owned bridge (see Figure 1). It was built in 1926 in an environmentally sensitive area, with designated wetlands immediately adjacent to the north side of the highway. The highway alignment in the project area is on tangent and the grade is nearly flat. Both approaches consist of two 2.75-m lanes with a 900-mm shoulder on each side.
The existing reinforced concrete slab bridge was constructed at a 30-degree skew to the creek. There was approximately 1.2 m of clearance between the channel and the superstructure. The total length of the bridge was 7.6 m, with a 6.4 m clear span distance. The existing structure width was 10 m out-to-out. Railing consisted of an integral vertical face, concrete parapet.
De-icing salts had deteriorated the structure significantly (see Figure 2). Full depth holes had developed along the curb lines and the slab had been overlaid with several courses of asphalt pavement over the years which resulted in a total thickness of concrete slab and asphalt measuring 864 mm deep. The overall condition of the bridge was poor with a computed weighted average condition rating (9) of 1.917 (see Table 2 for condition rating scale) and a federal sufficiency rating (10) of 40
(of a possible 100).
Table 2. New York State Department of Transportation Condition Ratings (9).
Rating Condition
1 Totally deteriorated
2 Used to shade between ratings of 1 and 3
3 Serious deterioration or not functioning as originally designed
4 Used to shade between ratings of 3 and 5
5 Minor deterioration and functioning as originally designed
6 Used to shade between ratings of 6 and 7
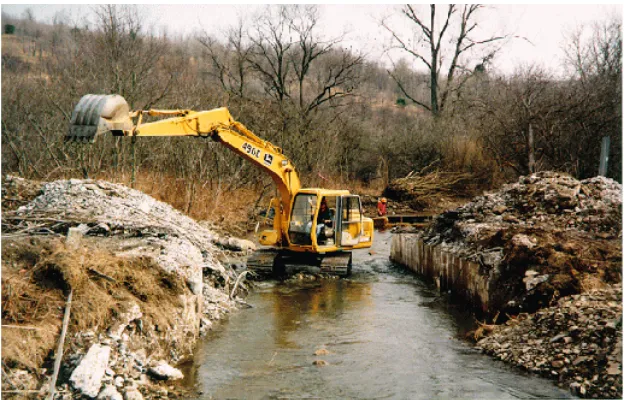
The bridge was posted with a 10-ton weight restriction in March of 1997 because of its poor condition and reduced load capacity. Detoured truck traffic used local county roads to circumvent the restricted structure. In addition to the added distance and expense to truckers, this created a concern on the part of the county about potential damage to their roads. At the same time, the 10-ton bridge posting was a hardship to local residents due to the economic impact of the detours. A capital construction project being designed provided a new structure that would not have been in service until January of 2000. This was viewed by local residents as too long a wait. In response to the situation, the county proposed to build an on-site detour that would allow trucks unrestricted use of route 248. The detour was completed in March of 1998 (see Figure 3).
NYSDOT had been investigating the feasibility of using FRP composites for a short span bridge superstructure and this site provided an excellent opportunity for such efforts. NYSDOT Region 6 reached an agreement with composite manufacturer Hardcore Composites, LLC to construct the bridge as a demonstration project at the Steuben County site. A Partnering Agreement was drawn up (Appendix A) in March 1998. The partnership team included: NYSDOT (Transportation R&D Bureau, Region 6 Bridge Maintenance and Structures, Structures Design and Construction Division), Town of West Union, Steuben County, FHWA, Hardcore Composites, Wagh Engineers, and Century Engineering.
7 Figure 3. On-site detour built before bridge rehabilitation.
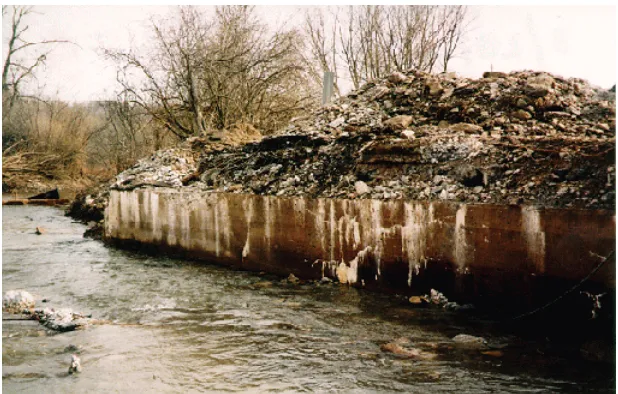
Figure 5. Typical abutment prior to reconstruction.
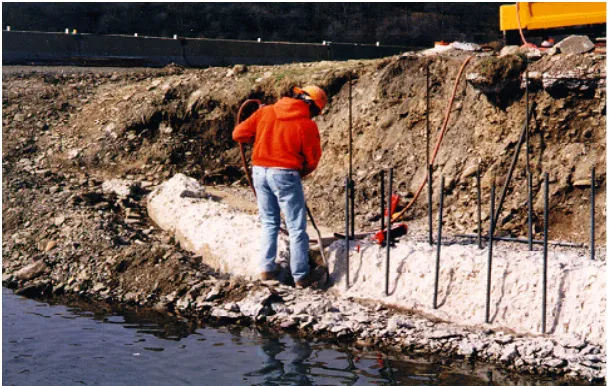
9 Figure 7. Abutment reconstruction.
Figure 8. Form work for the abutment reconstruction.
III. DESIGN
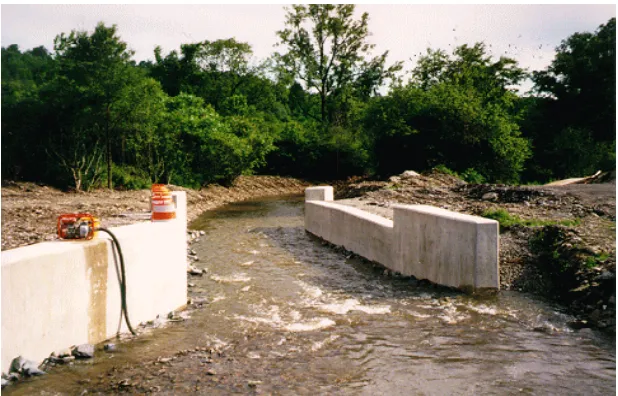
Figure 10. Completed abutments ready for FRP superstructure. Figure 9. Plan-view of the new abutments.
The substructure and approach details were prepared by NYSDOT Region 6. The FRP superstructure was designed for standard AASHTO loadings (11). Additional criteria were
specified wherever the code did not specifically address FRP structures. The standard New York live load of AASHTO MS 23 (HS-25) was used with the maximum strain on the composite material limited to 20% of ultimate under service loads. Live load deflection was limited to the span length divided by 800, the same as the AASHTO standard. In this case, the FRP superstructure was limited to a maximum live load deflection of 8.76 mm. A dead load allowance for a 50 mm future wearing surface was made. A team consisting of Hardcore Composites, LLC, Century Engineering International, Inc., and Wagh Engineers, P.C. designed the FRP superstructure using a finite element method. The design was reviewed by the NYSDOT engineering team responsible for the construction of the bridge.
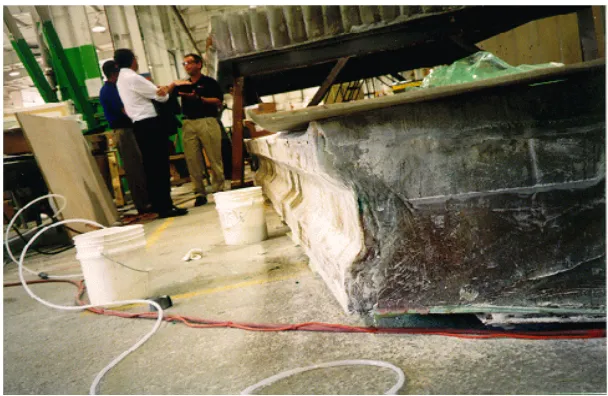
11 Figure 11. FRP superstructure during shop-fabrication showing
centerline shear-key.
The superstructure was fabricated from an E-glass-stitched bonded fabric and vinyl ester resin (See Figure 11). The superstructure used a cell core system that provides stiffness in two directions. The deck was manufactured using a resin infusion molding process (12). The
composite material was considered isotropic in the horizontal plane and was designed with the following properties:
Linear Elastic Modulus in Compression 18479 MPa Linear Elastic Modulus in Tension 18479 MPa
Shear Modulus 5861 MPa
Density of Material 1826 Kg/m3
Ultimate Tensile Strength 310 MPa
Ultimate Compressive Strength 221 MPa
Ultimate Shear Strength 114 MPa
Coefficient of Thermal Expansion 0.0000144/oC
The elastic modulus in tension was verified to be in the range of values obtained from the laboratory testing conducted according to ASTM specifications (13-16). Ultimate breaking
stress was found to be 235.9 MPa. The fiber mass was 77.3%, with average specific density of 1927.6 kg/m3. The laboratory test results are given in Appendix B.
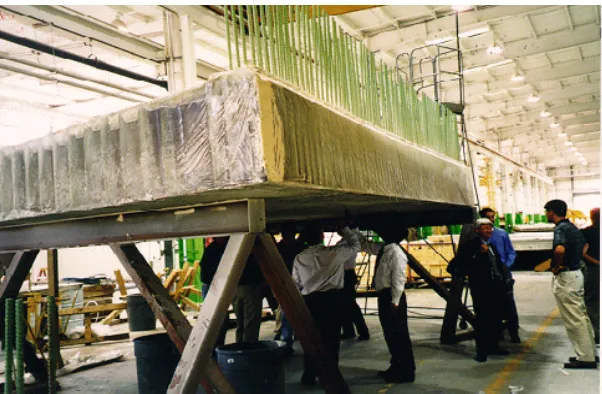
Figure 12. FRP superstructure during shop-fabrication showing epoxy rebars protruding for the parapet.
B. Design Section
The details of the superstructure are shown in Appendix C. The superstructure has a depth of 621 mm with a 10-mm thick polymer-concrete integral wearing surface. The superstructure was fabricated in two skewed pieces -- each 5.036 m wide and 7.807 m long -- with a longitudinal joint along the centerline of the bridge (see Figure 11). This was designed to carry the shear that developed along this plane resulting from the differential deflection of the two superstructure panels. The shear at the joint was resisted through a combination of a mechanical key-way and a resin glue. In addition, a bottom face plate was installed over the bottom of the longitudinal joint. The face plate was attached to one section first and glued on the other section after both deck panels were in place.
The bridge is skewed at 30 degrees. A cross slope of 2% with a crown at the centerline is provided by sloping the bridge seat. The design section of the superstructure consists of interior foam cell cores with top and bottom fiber mats. The interior cell cores are 200 mm x 200 mm x 600 mm foam and are wrapped with a 1 ply fiber mat. The top and bottom face skin mats are each composed of 7 plies of fiber mat (see Table 3). Each mat has a total thickness of 12.8 mm. Each ply has fiber orientations of 0E (warp), 90E(weft), +45E and -45E.
The fascias have three plies of fiber mat with the warp parallel to the span direction. The span ends also have three plies with the warp oriented vertically. All exposed composite surfaces are coated with epoxy paint for UV protection.
13 Table 3. Material Specifications.
Fiber Mass Component No. of Plies Total Thickness (mm)
0.915 Top Skin 7 12.80
0.559 Bottom Skin 7 12.80
0.415 Rib Cores 2 3.60
0.415 Sides 3 3.60
C. Wearing Surface
The wearing surface is a Transpo Corporation T-48 epoxy thin polymer-concrete overlay that was applied in the shop. Spot repairs were made in the field where lifting lugs were located, and where the anchor bolts were drilled and grouted.
D. Railing
The railings on the structure are built with two steel box beams attached to a vertical faced concrete parapet. The parapet consists of composite facing panels that are used as stay-in-place forms for conventional concrete. The concrete parapet is of the same dimension and has the same reinforcing steel as a conventional crash tested barrier. The epoxy coated steel reinforcing bars are embedded in the FRP superstructure (see Figure 12). Pull out tests were conducted to verify that the reinforcement could develop its full strength. After the composite facing panels were filled with concrete, composite cap pieces were glued in place.
In lieu of the normal practice of transitioning steel box beams to a concrete parapet, steel box beams run completely across the bridge on the inside face of the parapet. This was done because of the extremely short length of the bridge. This decision simplifies the details, is more economical, and is also more aesthetically pleasing. The parapet was designed with a gap at midspan so that the barrier would not provide unintended, additional stiffness to the FRP slab.
E. Load Ratings
Since the design is controlled by deflection criteria, both the computed inventory and operating ratings are very high. The load ratings (17) are summarized as follows:
Inventory Rating: MS-120, 114 Metric Tons (HS-118, 236 tons) Operating Rating: MS-160, 286 Metric Tons (HS-158, 315 Tons)
IV. FABRICATION
Bennett’s Creek FRP Bridge was fabricated by Hardcore Composites, LLC, using a vacuum assisted resin transfer molding process which saturates a dry fabric preform with a vinyl ester resin by vacuum force at room temperature (12) . The resin cures after full wet out of the dry fabric pre-form is
achieved resulting in a high fiber volume, low void content, high performance FRP composite. Cell cores are utilized to create an internal core structure for bridge sections. Cell core is a term used to describe a foam or polyethylene rectangular prismatic section having characteristic resin distribution grooves on all of it surfaces. The foam or polyethylene prismatic sections are wrapped in a dry fabric pre-form and stacked next to one another forming an internal lattice structure or grid. This grid is captured on all sides by upper and lower face skins which, when infused with the resin, bond intimately with the cell core structure and form a sandwich panel. Upper and lower face skins with core create the deck section (see Figures 11-12).
The tooling, i.e. the form-work for fabricating the deck, was set on an angle (60E) to reflect the bridge
skew. The entire bridge section was laid-up all at once with an internal key way placed midway through the transverse direction of the bridge deck (A two-piece deck was necessary due to shipping constraints). In addition, the key-way was fabricated with a 2-degree angle so that when both deck sections were mated in the field, the deck would have a 2% grade from the center to the edge. Initially, 7 plies of QM6408 E-glass stitched fabric (supplied by Brunswick Technologies, Inc.) were placed in the bottom of the mold. The internal cell core then was placed on top of the lower face skins. The cell core was constructed of 9-N (2-lb) closed cell foam machined in 200 mm x 200 mm parallelogram sections nominally 600 mm tall. The cells were wrapped with one ply of QM6408 E-glass stitched fabric and placed side by side in the tool. Cells that were sized approximately half of the above dimensions were placed on the edges to accommodate placement of the #16 U-rebar for the parapet connection. After all the cells had been placed, 7 plies of QM 6408 E-glass stitched fabric were placed on top of the core, forming the upper face skins. Placement of the top skins were followed by insertion of the #16 U-rebars on 114 mm centers on each side of the deck. These bars were placed at the corner interface of the internal cells. A vacuum bag was placed over the entire assembly. Vacuum was applied to the system and Dow Derekane 411-PC vinyl ester resin was infused into the deck saturating the lower face skins, core, and upper face skins. The infusion process also locked the parapet rebar in place. After approximately 4 hours, the resin gelled and the superstructure sat for an additional 24 hours to ensure adequate curing of the resin. Lastly, the vacuum bag, process disposables, and tools were pulled away from the composite deck structure.
16
Figure 13. Transportation of the superstructure components.
Figure 14. Placement of bearing pads during construction.
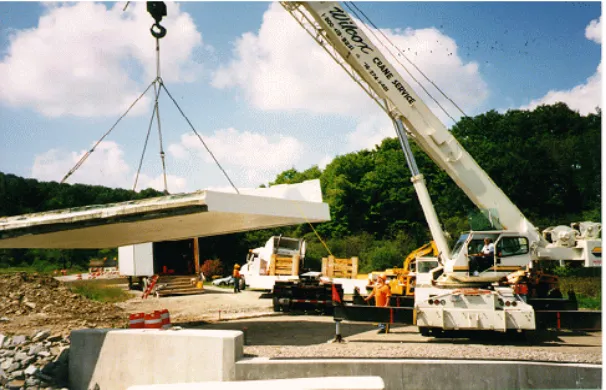
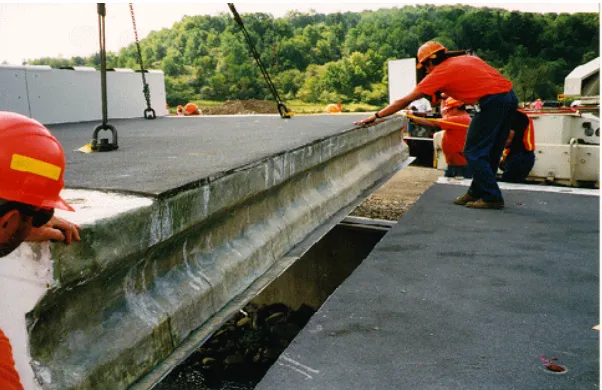
Figure 15. Placement of the first half of the superstructure.
18
V. INSTALLATION A. Transportation
The superstructure was transported from Hardcore's plant in New Castle, Delaware to the bridge site near Rexville, New York by truck (see Figure 13). Special oversize vehicle permits were required because of the width of the shipment. The superstructure was shipped in two pieces, each 5.03 m wide. The shipping weight of each piece was approximately 71 kN. The cost of shipping from New Castle, Delaware to the job site was approximately $7,000. Both pieces were shipped on one truck.
B. Erection
The truck carrying the two superstructure pieces arrived on-site at approximately 10:30 a.m. on August 26, 1998. Erection was performed by NYSDOT Bridge Maintenance crews. A rented 75 ton capacity crane provided ample capacity to position the two superstructure pieces. A representative from Hardcore Composites was on site to provide technical guidance.
When the truck arrived on-site, the neoprene bearing pads were placed on the abutment bridge seats in preparation for installation of the superstructure sections (see Figure 14). The face plate along the bottom of the longitudinal joint was glued to one section while it was still on the truck using an acrylic adhesive. The holes for the anchor dowels at the centerline of bearings were also drilled while the superstructure sections were still on the truck. This operation probably could have been done in the fabrication shop to reduce the time required in the field.
20
Figure 19. Placement of the second-half of the superstructure. Figure 18. Placement of the second half of the superstructure.
C. Completion of Construction
The structure was completed over the next several weeks (Figures 20-23). The remaining work consisted of:
CPlacement of concrete inside the FRP shells for the traffic barrier (see Figure 20).
CPlacement of 5-m long concrete approach slabs (see Figure 21).
CInstallation of pourable silicone joint seal between deck and approach slabs.
CPlacement of remaining portions of concrete wing walls to meet the FRP deck.
Figure 21. Construction of concrete approach slabs. Figure 20. Traffic barriers before concrete placement.
CPlacement of gravel and asphalt shoulders on the approach.
CInstallation of steel box beam bridge and approach railing.
22
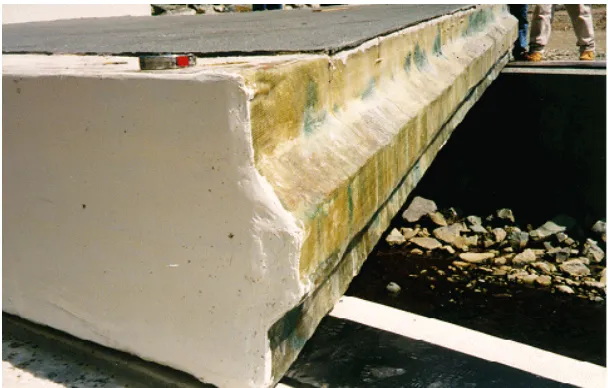
Figure 22. Finished bridge opened to traffic.
Figure 23. Proof-testing of the structure.
VI. PROOF TESTING
The bridge was instrumented and a load test was conducted before the structure was opened to traffic. This was done for three reasons. First, to ensure the structure’s integrity before opening it to the public. Second, to establish base line conditions for a future monitoring program. Third, to compare actual performance with theoretical calculations.
Proof load tests establish inventory and operating ratings for bridges using a test operating factor (1.4 in this case). A target proof load is employed to load the bridge beyond the design load (18). Four
ten-wheel, loaded dump trucks were used during the load test (see Figure 23). They were loaded to capacity and weighed on-site with portable truck scales. Although the target proof load could not be reached, due to truck size and load limitations, MS 23 (HS 25) loadings were achieved (Table 4).
Table 4. Comparison of test loads with proof-load and MS23 load.
MS23 Target
24
µ,
Figure 24. Location of the strain gages in field testing.
B. Proof Load Test Procedure
During the load testing conducted in October 1998, four different load cases were used, such that the load was increased in increments, as follows: Case 1. Two Empty Trucks, Case 2. Two Loaded Trucks (Normal Load), Case 3. Four Loaded Trucks (Normal Load), and Case 4. Four Loaded Trucks (Overload). Case 4 was the proof-load condition. The trucks were placed at pre-marked positions on the bridge to maximize bending moments. Each truck was moved on and off the bridge individually for each load case and data was recorded at each step. For the cases involving four trucks, the trucks in each lane were placed back to back (see Fig. 23).
C. Load Test Results
-50 Table 5. Strain data from Load Case 4.
Gage Strain (µå) Gage Strain (µå) Gage Strain (µå) Gage Strain (µå)
0 33 6 127 12 62 18 -30
The data from other load cases is generally consistent in the sequence and symmetry of the loading. The data also tends to show generally lower strains in the southeast portion of the bridge (gages 11, 14, and 17) than corresponding gages in other quadrants. This may be attributed to a greater fixity of the superstructure to substructure attachment in the southeast quadrant due to variations in drilling and grouting of the anchor bolts during the construction.
26
The maximum strain recorded at any gage was 204 µå during Load Case 4. This was considerably less than the approximately 600 µå predicted by analysis. This indicates a significantly higher load capacity than that determined by analysis.
D. Deflection Results
The maximum deflection at mid-span during Case 4 was measured to be less than 3.5 mm, which is considerably less than the Span(L)/800 design limitation of 8.8 mm.
E. Follow-up Load Test
VII. LONG-TERM MONITORING
In addition to the strain and deflection gage monitoring of the bridge, other in-service monitoring techniques are also being used. The bridge is, of course, subject to the general bridge inspection requirements required by the National Bridge Inspection Standards (NBIS) for all bridges carrying public highway traffic. The Route 248 bridge has also been subjected to more frequent, supplemental inspections because of its experimental nature. Because most bridge inspectors are unfamiliar with FRP materials, supplemental inspection guidelines have been prepared by Hardcore Composites, LLC, the manufacturer of the superstructure. Particularly, inspectors have been alerted to check for delaminations in the FRP materials. This has been done by tapping the underside of the bridge surface with a rubber mallet. A coin or small rounded stone has proven to be equally effective. A void in the bottom of the deck was discovered soon after placement. The void was repaired in June 2000 by injecting resin.
Monitoring has also included the checking for cracks in the FRP materials and any signs of ultraviolet or moisture deterioration. In addition, the condition of the 10-mm polymer concrete wearing surface has been checked. This has been done by both visual inspection and chain dragging to check for delamination between the polymer concrete and the FRP structure. Some damage to the polymer concrete wearing surface at the bridge ends has been noted. The damage has been attributed to heavy equipment used during approach paving operations or snow plows during the winter. Excessive wear was reported after the first 1.5 years of service. The wearing surface was renewed in June 2000 by applying a broom ‘n’ seed application of the Transpo T- 48 surface after sand blasting the old surface clean.
In addition to periodic visual and tactile inspections, the load testing will be repeated at six-month intervals until sufficient confidence is established that the bridge performance is stable. At that time, an evaluation will be made to extend the interval between load tests. Modal analysis-based techniques will be used to collect the data to characterize the dynamic behavior of the structure (see Figure 26). A detailed finite element analysis model is being developed and calibrated using the static and dynamic data obtained through field test results (19). This data will be used to conduct a
28
VIII. COST-BENEFIT ANALYSIS
The comparison of costs and benefits is subjective since most of the project was done using in-house staff. The time taken from closing the deteriorated bridge to opening the new bridge to traffic was about 6 months, in contrast to more than 2 years needed by the the original plans based on the capital program schedule. Region 6 maintenance forces were responsible for construction and erection of the bridge and approaches. Engineers from NYSDOT Region 6 Design Section, Main Office Structures Design and Construction Division, Transportation Research and Development Bureau, and Federal Highway Administration (FHWA) worked with Hardcore Composites staff and their consultants to finalize design specifications and detailing. The Transportation Research and Development Bureau instrumented the bridge and conducted the proof-load testing. The FRP superstructure with integral wearing surface was supplied free-of-cost by Hardcore Composites. However, Hardcore Composites provided the estimated cost of engineering and fabrication for the project. Thus, the project costs, given in Table 6, do not include the time spent by in-house engineers and researchers, overhead charges, and the profit normally charged by the manufacturer.
Table 6. Project costs.
Organization Item Description Cost
Hardcore Composites Engineering and Fabrication $116,000
NYSDOT Construction $171,000
NYSDOT Detour and approaches $ 55,000
Steuben County Detour $ 53,000
NYSDOT Testing $ 5,000
TOTAL COST $400,000
30
cost from the Capital Project Estimates are given in Table 7. Note that right-of-way and utilities costs were not included, as they were the same, regardless of the project type.
Table 7. Estimated traditional reconstruction costs.
Item Description Cost
Bridge $672,000
Highway $477,000
Pre-Engineering @ 15% $172,000
Construction Inspection @ 12% $138,000
IX. CONCLUSIONS
33
ACKNOWLEDGMENTS
REFERENCES
1. Chase, S. “Dynamics and Field Testing of Bridges in New Millennium: A Look Forward”, A White Paper prepared for Transportation Research Board Technical Committee A2C05 on Dynamics and Field Testing of Bridges, January 1999.
2. Alberski, T., and Alampalli, S. (1998) “Composite Materials in Highway Bridge Construction.” Research Proposal for Project 227-1, Transportation R&D Bureau, NYSDOT.
3. “The Status of the Nation’s Highway Bridges: Highway Bridge Replacement and Rehabilitation Program and National Bridge Inventory,” Thirteenth Report to the United States Congress, Federal Highway Administration, U.S. Department of Transportation, May 1997.
4. “Advanced Composites in Europe and Japan,” Scanning Program Report, Federal Highway Administration, USDOT, 1997.
5. Alampalli, S., O’Connor, J.S., and Yannotti, A.P.“Advanced Composites for Cost-Effective Rehabilitation of Bridges”, Advances in Composite Materials and Mechanics, ASCE Special Publication, pp. 76-84, 1999.
6. O’Connor, J.S., Hoyos, H., Yannotti, A., Alampalli, S., and Luu, K.T. “Reinforced Concrete Capbeam Strengthening Using Fiber Reinforced Polymer Composites, Fourth International Symposium on Fiber Reinforced Polymer Reinforcement for RC Structures,” SP-188, ACI, Baltimore, Maryland, pp. 481-490, 1999.
7. Hag-Elsafi, O., and Alampalli, S. “Strengthening Prestressed-Concrete Beams Using Bonded FRP Laminates”, Structural Materials Technology: An NDT Conference,” Atlantic City, NJ, pp. 287-292, February-March 2000.
8. Hag-Elsafi, O., Alampalli, S., Kunin, J., and Lund, R. “Application of FRP Materials in Bridge Retrofit,” Seventh Annual International Conference on Composites Engineering, Denver, CO, pp. 305-306, July 2000.
36
10. “Recording and Coding Guide for the Structure Inventory and Appraisal of the Nations’ Bridges,” Report No. FHWA-PD-96-001, Federal Highway Administration, December 1995.
11. “Standard Specifications for Highway Bridges,” American Association for Highway and Transportation Officials, 15th Edition, Washington, D.C., 1994.
12. “Fabrication Process Used for Bennett’s Creek Bridge,” Personal Communication from Hardcore Composites, 1999.
13. Bucinell, R.B. “Evaluation of the Composite Bridge Repair Material System,” Report prepared for New York State Department of Transportation, June 1999.
14. “Standard Test Method for Tensile Properties of Polymer Matrix Composite Materials,”
ASTM-D3039/D3039M - 95a.
15. “Test Methods for Fiber Content of Resin Matrix Composites by Matrix Digestion,” ASTM-D3171-76.
16. “Test Methods for Specific Gravity (Relative Density) and Density of Plastics by Displacement,”
ASTM-D792-91.
17. “Level 1 Load Rating - BIN 1043150" Report submitted to New York State Department of Transportation by Wagh Engineers, P.C., January 1999.
18. Lichtenstein, A.G. “Bridge Rating Through Nondestructive Load Testing,” Technical Report, NCHRP Project 12-28 (13)A, June 1993.
MATERIAL TEST RESULTS
The testing of material samples was conducted at Union College, Schenectady, NY. The following were excepted from the test results (13).
Table B2. Summary of tensile test results.
ID Width
Table B3. Summary of ASTM D3171-76 fiber content tests using hydrolysis.
Table B4. Summary of ASTM D792-91 density tests.