International Conference on Methods and Models in Computer Science, 2009
An Efficient Minimum Spanning Tree based
Clustering Algorithm
Prasanta K. Jana 1, Senior Member, IEEE and Azad Naik2
1
Department of Computer Science & Engineering Indian School of Mines
Dhanbad 826 004, India 2
Aricent Technologies Plot 31, Gurgaon 122001, India
e-mail:prasantajana@ yahoo.com, naik.azad@gmail.com
Abstract— Clustering analysis has been an emerging research issue in data mining due its variety of applications. In the recent years, it has become an essential tool for gene expression analysis. Many clustering algorithms have been proposed so far. However, each algorithm has its own merits and demerits and can not work for all real situations. In this paper, we present a clustering algorithm that is inspired by minimum spanning tree. To automate and evaluate our algorithm, we incorporate the concept of ratio between the intra-cluster distance (measuring compactness) and the inter-cluster distance (measuring isolation). Experimental results on some complex as well as real world data sets reveal that the proposed algorithm is efficient and competitive with the existing clustering algorithms.
Keywords-Clustering; minimum spanning tree; gene expression data; k-means algorithm
I. INTRODUCTION
Clustering is a process which partitions a given dataset into homogeneous groups based on given features such that similar objects are kept in a group whereas dissimilar objects are in different groups. Clustering plays an important role in various fields including image processing, computational biology, mobile communication, medicine and economics. With the recent advances of microarray technology, there has been tremendous growth of the microarray data. Identifying co-regulated genes to organize them into meaningful groups has been an important research in bioinformatics. Therefore, clustering analysis has become an essential and valuable tool in microarray or gene expression data analysis [1]. In the recent years, although a number of clustering algorithms [2], [3], [4], [5], [6], [7] have been developed, most of them are confronted in meeting the robustness, quality and fastness at the same time. Minimum spanning tree (MST) is an useful data structure that has been used to design many clustering algorithms. Initially, Zahn [8] proposed an MST based clustering algorithm. Later MST has been extensively studied for clustering by several researchers in biological data analysis [9], image processing [10], [11], [12] pattern recognition [13], etc. One approach [8] of the MST based clustering algorithm is to first construct MST over the whole dataset. Then the inconsistent edges are repeatedly removed to form connected
components until some terminating criterion is met. The resultant connected components represent the different clustering groups. The other approach is to maximize or minimize the degrees of the vertices [14], which is usually computationally expensive. Recently, Wang et al. [15] proposed a MST based clustering algorithm using divide and conquer paradigm. Gryorash et al. proposed another MST based clustering algorithm that can be found in [16]. As stated in [9] that MST based clustering algorithm does not depend on the detailed geometric structure of a cluster and therefore, it can overcome many of the problems that are faced by many classical clustering algorithms. The other graphical structures such as relative neighborhood graph (RNG) Gabriel graph (GG), Delaunay triangulation (DT) have also been used for cluster analysis. The relationship among these graphs can be seen asMST ⊆RNG⊆GG⊆DT[18]. However, they may not produce good clustering results for the dimension more than five [15].
Motivated with this, we propose, in this paper, a new MST based clustering algorithm. Our algorithm has no specific requirement of prior knowledge of some parameters and the dimensionality of the data sets. We run our algorithm on a number of synthetic dataset as well as real world dataset. For visual judgment of the performance of the proposed algorithm, we show the experimental results on some already known data sets as well as some real world data sets from UCI machine learning repository [17].
The rest of the paper is organized as follows. We introduce the necessary concept of MST and other terminologies in section II. The proposed algorithm is presented in section III. The experimental results are shown in section IV followed by the conclusion in section V.
II. TERMINOLOGIES
A. Minimum Spanning Tree (MST)
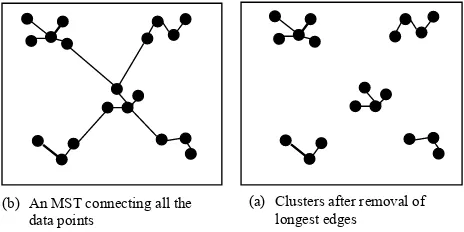
for each edge, is usually considered as the distance between the end points forming the edge. Removal of the longest edge results into two-group clustering. Removal of the next longest edge results into three-group clustering and so on [15]. Five-group clustering after removal of successive longest edges (four) is shown in Fig. 1.
B. Validity Index
Validity index is generally used to evaluate the clustering results quantitatively. In this paper we focus on the validity index, which is based on compactness and isolation. Compactness measures the internal cohesion among the data elements whereas isolation measures separation between the clusters [18]. We measure the compactness by Intra-cluster distance and separation by Inter-cluster distance, which are defined as follows.
Intra-cluster distance: This is the average distance of all the points within a cluster from the cluster centre given by
Intra =
Inter-cluster distance: This is the minimum of the pair wise distance between any two cluster centers given by
Inter = Minzi−zj 2 (2)
In the evaluation of our clustering algorithm, we use the validity index proposed by Ray and Turi [19] as follows
Ratio (validity) =
Inter Intra
(3)
Threshold value: This denotes the limit when two points get disconnected if the distance between them is greater than this limit.
III. PROPOSED ALGORITHM
The basic idea of our proposed algorithm is as follows.
We first construct MST using Kruskal algorithm and then set a threshold value and a step size. We then remove those edges from the MST, whose lengths are greater than the threshold value. We next calculate the ratio between the intra-cluster distance and inter-cluster distance using equation (3) and record the ratio as well as the threshold. We update the threshold value by incrementing the step size. Every time we obtain the new (updated) threshold value, we repeat the above procedure. We stop repeating, when we encounter a situation such that the threshold value is maximum and as such no MST edges can be removed. In such situation, all the data points belong to a single cluster. Finally we obtain the minimum value of the recorded ratio and form the clusters corresponding to the stored threshold value. The above algorithm has two extreme cases: 1) with the zero threshold value, each point remains within a single cluster; 2) with the maximum threshold value all the points lie within a single cluster. Therefore, the proposed algorithm searches for that optimum value of the threshold for which the Intra-Inter distance ratio is minimum. It needs not to mention that this optimum value of the threshold must lie between these two extreme values of the threshold. However, in order to reduce the number of iteration we never set the initial threshold value to zero.
Let us now describe the notations used in the pseudocode of our algorithm as follows.
Notations used:
N: Number of data points; D: Dimension of each data point Data[N][D]: Data matrix
Step_size: Step size by which to increment the threshold after each iteration.
Signal: Variable used to check termination criterion.
ARatio[N]: Array which holds ratio (equation 3) after each iteration.
AThreshold[ ]: Array which holds threshold value after each iteration.
T[N][N]: Adjacency matrix returned by Kruskal algorithm. Storage[2(N-1)][D+1]: Matrix used to store the end points of the edges that are removed from MST .
Counter1: Variable to keep track of the rows of the Storage matrix.
Index[N]: Array to hold the cluster number, a data point belongs to.
Store[N - 1]: Array used to store connected components. Cluster_no[ ]: Stores the number of cluster center.
Counter2, Counter3, Cluster_no, iteration: Temporary variable.
d(i, j): denotes Euclidean distance between data points i and j. *: denotes all the columns (dimensions) for multivariate data.
Pseudocode ofAlgorithm MST_Clustering:
Initialize Threshold, Step_size, Signal:= 0; iteration := 1 Apply Kruskal algorithm to get adjacency matrix T
while (Signal = 0) do // checking whether all the data point are in a single cluster //
Counter:= 1; Cluster_no:= 0; (b) An MST connecting all the
data points
(a) Clusters after removal of longest edges
Index [i]:= 0.0, 1 ≤i≤N
AThreshold[iteration] := Threshold
// storing end points with edge weight > Threshold and removing that edge from MST //
Storage[i][j]:= 0.0, 1 ≤i≤ 2(N - 1), 1 ≤ j≤D + 1
Time Complexity: It can be seen that the proposed algorithm consists of two phases. In the first phase, we construct the MST using Kruskal algorithm that requires O(N log N) time. In the second phase we find the connected components by removing those edges from MST whose edge weight (length) is greater than the chosen threshold. The outermost while loop of this iterates k times. Inside it, the nested while-for / for-while loops may run at most N2 times. Therefore, the overall
time complexity isO(kN2).This is comparable with k-means.
IV. EXPERIMENTAL RESULTS
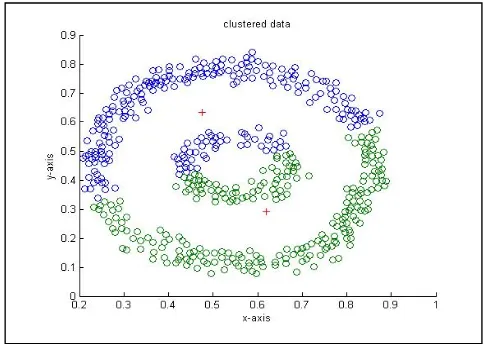
curve and kernel (ring inside a ring) shapes which are known to be difficult clustering. The results of the proposed and the
k-means algorithm are shown in Figs. 4-7. This is important to note that the clusters generated by the k-means are interspersed (see Fig. 5 and Fig. 7), whereas our proposed algorithm has successfully created two clusters as shown in Fig. 4 and Fig. 6.
We next run on multi-dimensional data sets, namely Iris, Wine and Spect heart [17] with 4, 14 and 22 attributes form UCI machine learning repository. The descriptions of these data sets can be found in [17]. The results of the runs of our algorithm are compared with the k-means algorithm with respect to the Intra-inter ratio (equation 3) as shown in
Table 1. It clearly shows that our proposed algorithm has better intra-inter ratios than the k-means.
V. CONCLUSION
In this paper, we have presented a clustering algorithm which is based on minimum spanning tree. Unlike the other algorithms such as k-means, the algorithm does not require any prior parametric value, e.g., number of clusters, initial cluster seeds etc. We have shown the experimental results of our algorithm on some synthetic as well as multivariate real data sets, namely Iris, Wine and Spect heart. Experimental results demonstrate that the proposed algorithm performs better than the k-means.
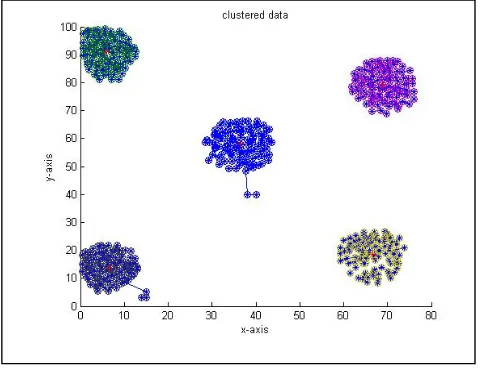
Figure 2. Result of the proposed algorithm on synthetic data of size 510
Figure 5. Result of k-means on curve data of size 550
Figure 3. Result of k-means on synthetic data of size 510
Figure 4. Result of the proposed algorithm on curve data of size 550
TABLE 1 COMPARISON WITH RESPECT TO INTRA-INTER DISTANCE RATIO
Name Attributes Data Cluster Ratio Ratio Size Number (K-means) (Ours)
Iris 4 150 3 0.2888 0.1492
Wine 13 178 3 0.1895 0.0924
Spect-heart 22 267 2 2.3652 1.8806
ACKNOWLEDGMENT
This research has been supported by Council of Scientific and Industrial Research (CSIR) under the grand no. 25 (0177) / 09 / EMR-II. The authors would like to thank CSIR for this support.
REFERENCES
[1] Daxin Jiang, Chun Tang and Aidong Zhang, “Cluster Analysis for Gene Expression Data: A Survey”, IEEE Transactions on Knowledge and Data Engineering, vol. 16, pp. 1370 – 1385, 2004.
[2] Vincent S. Tseng, Ching-Pin Kao, “Efficiently Mining Gene Expression Data via a Novel Parameterless Clustering Method”, IEEE/ACM Transactions on Computational Biology and Bioinformatics, vol. 2, 355-364, 2005.
[3] G. Kerr, H.J. Ruskin, M. Crane and P. Doolan, “Techniques for clustering gene expression data,” Computers in Biology and Medicine, vol.38, No. 3, pp.283-293, 2008.
[4] A. Ban-Dor, R. Shamir, Z. Yakhini, “Clustering gene expression patterns, Journal of Computational Biology”, vol. 6, pp. 281-297, 1999. [5] Zhihua Du, YiweiWang, Zhen Ji, PK-means: A new algorithm for gene
clustering,” Computational Biology and Chemistry, vol. 32, pp. 243–247, 2008.
[6] S. Seal, S. Komarina and S. Aluru, “An optimal hierarchical clustering algorithm for gene expression data,” Information Processing Letters, vol. 93, pp. 143-147, 2005.
[7] Frank De Smet et al., ”Adaptive quality-based clustering of gene expression profiles”, Bioinformatics, vol. 18, pp. 735–746, 2002. [8] C. T. Zahn, “graph-Theriotical methos for detecting and describing
getalt clusters,” IEEE Trans. Computers, vol. 20, no. 1, pp. 68-86, 1971. [9] Y. Xu, V. Olman and D. Xu, “Clustering gene expression data using a
graph-Theriotic approach: An application of minimum spanning trees,” Bioinformatics, vol. 18, no. 4, pp. 536-545, 2002.
[10] Y. Xu, V. Olman and E. C. Uberbacher, “A mentation using minimum spanning trees,” Image and Vission Computing, vol. 15, pp. 47-57, 1997.
[11] Zhi Min Wang, Yeng Chai Soh, Qing Song, Kang Sim, “Adaptive spatial information-theoretic clustering for image segmentation,” Pattern Recognition, vol. 42, no. 9, pp. 2029-2044, 2009.
[12] [Li Peihua, “A clustering-based color model and integral images for fast object tracking, Signal Processing: Image Communication”, vol. 21, pp. 676-687, 2006.
[13] A. Vathy-Fogarassy, A. Kiss and J. Abonyi, “Hybrid minimal spanning tree and mixure of Gaussians based clustering algorithm,” Foundations of Information and Knowledge systems, pp. 313-330, Springer, 2006. [14] N. Paivinen, “Clustering with a minimum spanning tree of
scale-free-like structure,” Pattern Recognition Letters, vol. 26, no. 7, pp.921-930, Elsevier, 2005.
[15] Xiaochun Wang, Xiali Wang and D. Mitchell Wilkes, “A divide-and-conquer approach for minimum spanning tree-based clustering,” IEEE Trans. Knowledge and Data Engg., vol. 21, 2009.
[16] O. Gryorash, Y. Zhou ands Z, Jorgenssn, “Minimum spanning tree-based clustering algorithms,” Proc. IEEE Int’l Conf. Tools with Artificial Intelligence, pp. 73-81, 2006.
[17] http://archive.ics.uci.edu/ml/datasets.html.
[18] A. K. Jain, Algorithms for Clustering Data, Prentice Hall, Englewood Cliffs, New Jersey, 1988.
[19] S. Ray, R.H. Turi, “Determination of Number of Clusters in K–Means Clustering and application in colour Image Segmentation”, Proc. 4th
Intl. Conf. ICAPRDT ‘99, Calcutta India, 1999, pp. 137-143.
[20] Amir Ahmad and Lipika Dey, “A k--mean clustering algorithm for mixed numeric and categorical data”, Data & Knowledge Engineering, vol. 63 pp. 503-527, 2007.
[21] J. Shen, S. I. Chang, E. Stanley, Y. Deng and S. Brown, “Determination of cluster number in clustering microarray data,” Applied Mathematics and Computation, vol. 169, pp. 1172-1185, 2005.
Figure 6. Result of the proposed algorithm on kernel data


