Vol. 8 No. 1, p 49 – 54 [email protected] ISSN: 1412-0070
Performance Efficiency of the Indonesian Banking
Benny Lule*
Fakultas Ekonomi Universitas Klabat
This paper aims to measure and analyze the performance efficiency of the Indonesian banking listed in IDX for LQ 45 during period 2003 – 2007. The study uses Output-Oriented Malmquist Productivity Index (DEA approach) to analyze 35 panel data composed of 7 banks and 5 year periods. The findings show that the Indonesian banking is productive and efficient as a whole. There are positive growth productivity and efficiency rate as much as 5.1 percent and 2.4 percent, respectively. However, the findings show that 29 percent of the banks are non-productive and 43 percent is inefficient ones.
Key words:Banking Performance, Data Envelopment Analysis (DEA), Output-Oriented Malmquist Productivity Index.
INTRODUCTION
Economic performance of a country is influenced by many factors. One of them is the financial institution performance particularly banking industry. Since the banking industry plays an important role to stabilize an economic system of a country, the banking industry performance has to be managed, monitored and evaluated carefully. There were a number of studies about banking industry in the world. Particularly in Asia, there were some previous studies in this field. Some of them are: Pulley and Braunstein (1992), which was expanded by McKillop et al. (1996) for Japanese banks; Kwan (2002), for Hong Kong banks; Gilbert and Wilson (1998), for Korean banks; Dogan and Fausten (2003), for Malaysian banks; Chu and Lim (1998), for Singaporean banks; Unite and Sullivan (2003), for Philippine banks; and Leightner and Knox Lovell (1998), for Thai banks. These previous studies used various methodologies to do their studies. Some used in both non-parametric and parametric approaches.
In addition, based on the researcher observation there were two previous studies about the Indonesian banking system. Firstly, the study conducted by Sengkey (2006) entitled ―Performance of the Regional Development Banks in Indonesia: An Application of Camel and Anova test. Secondly, the study conducted by Hadad, et al (2008) entitled ―Banking Efficiency and Stock Market Performance: An Analysis of Listed Indonesian Banks‖. This study examined the efficiency of listed Indonesian banks, by using monthly supervisory data collected by Bank Indonesia during 2006 and 2007.
In Indonesia, financial system stability relies heavily on the banking industry. About 90 percent of the financial system’s total asset in Indonesia is dominated by the banking industry. Therefore, the banking industry has to be monitored and evaluated by government through the Indonesian Bank Central (BI) due to the important role of the bank industry in keeping the economic/financial stability of a country.
*corresponding author
Bank industries in Indonesia have a big role concerning with economic development In Indonesia. Not just in Indonesia, bank industries in most of the countries are needed for the economic development as well. At the beginning of 2008, the global financial crisis has influenced the Indonesia’s economic particularly in stock exchange market. As known, economic condition cannot be separately from bank industries. They have close relationship to each other. In general, if the economic goes down, the bank industries performance goes down as well or vice versa. An economic crisis influences banking liquidity. It causes money flowing in the financial market becomes slowly. Money borrower gets some difficulty to get borrowing. This makes all business sectors have to anticipate it, and they have to manage their financial carefully. According to Toelle (2008) the global crisis has not directly impacted the Indonesia’s banking yet as occurred in the stock market recently. However, the bank industries have to anticipate it and they have to improve their performances so that they can survive and have stronger performance
Based on the Indonesia Bank Central (BI) reporting, at the end of June 2007 there were 130 banks operating in Indonesia with a combined balance sheet amounted US$ 190 billion. It consisted of 5 state-owned banks, 35 foreign exchange private national banks, 36 non-foreign exchange private national banks, 26 regional government-owned banks, 17 joint venture banks and 11 foreign banks. This figure compared with the figure, namely 222, in December 1997. There was a large shrinkage due to post-crisis liquidation and suspension, initiated by the Indonesian Bank Restructuring Agency (IBRA) under agreement with the IMF (Jao, 2001).
be measured and analyzed appropriately by using the right methods. The purpose of this study, therefore, is to measure and analyze the performance efficiency of the Indonesian banking industry particularly the banks those listed in the determinant factors for productivity and non-productivity of the Indonesian banking listed in IDX for LQ 45 during period 2003 – 2007? 3. What are the determinant factors for efficient and non-efficient of the Indonesian banking listed in IDX for LQ 45 during period 2003 – 2007?
Theoretical Framework. This section gives an overview about the bank management theory and the corporate performance theory. These two theories are the fundamental theory of this study.
Bank Management Theory. A Bank, according to the rules of Republic of Indonesia number 10, year 1998 on date 10 November 1998 says what is mean by the word bank is a branch with an effort that gather the fund from the people/community as a depositor, than channeled it to the people ascredits and/or as other usage other that it in order to increase the Indonesian people life’s. Bank Industries is a trust institutions with a high price level that makes people who invest their money are given a save conditions to minimize losses to occur. Another reason is because of the internal and external environments conditions are getting improvement rapidly as well as the business risks are more complex. In order to anticipate those situations, therefore, the banking system has to be improved continuously. By knowing some economic condition that affects bank industries, bank should increase their performance efficiencies in order to keep loyal customers. People would invest their money to the right place where they feel save and believe are on the right place. One way of approaching, giving a belief where to invest is by knowing the performance of the banks. By doing a regular health check up on the performance of banks, it maintains the confidence of private sector in financial system of the country and protect the interest of depositors, lenders, shareholders as well as other stakeholders.
According to Mishkin (2003) there are four main concerning of the banking management in order to manage a banking system. Those concern are: 1). To make sure that bank has enough ready cash to pay its depositors when there are withdrawing from depositors; 2). The bank manager must persuade an acceptably low level of risk by acquiring assets that have a low rate of default and by identifying asset holding (asset management); 3). To acquire fund at low cost (liability management); and 4). The bank manager must decide the amount of capital the bank
must maintain (capital adequacy management). Corporate Performance Theory. How do you know if a company is doing well and what are the best measures to use to find out? This is one of the many questions posed to senior managers and academicians in terms of corporate performance evaluation. According to Beaver (2001) the answer of this question can be either easy or difficult. It depends on what techniques are being employed and what is being measured as an indicator of organizational performance and corporate health. It is important to establish when the exercise is undertaken, by whom and for what purpose. In addition, O’Mara et al. (1998) mentioned that the core of any performance measurement system will be those traditional, financially-based performance measures which periodically summarize the organization’s performance for the benefits of shareholders, lenders, creditors and statutory authorities. Furthermore, Beaver (2001) mentioned that financial information is the most widely available information source on companies but it is rarely neutral or objective. The figures can be very misleading if they have been manipulated in such a way as to present a spurious reflection of the organization’s performance. Therefore it is important to carefully study the notes to the accounts if a clear and balanced evaluation is to emerge and even then, the accounting techniques employed will be used to present a particular picture of the company’s performance.
Performance appraisal is a serious business and not some academic fad that will fade like so much of the indulgent language and management tools and techniques currently in vague. It is the principal means for an organization to assess the effectiveness of its decision making. In 1996, Crowther indicated that the importance of corporate performance evaluation is not just to the academic community but also to the business community. Furthermore, he mentioned that performance evaluation is not just concerned with the past but is also oriented towards the future in the selection of alternatives which will shape the strategic direction of the business and ensure its future viability. The ability to evaluate realistically performance of the business, and the ability to select suitable dimensions along which to carry out that evaluation, is critically important not just to the managers of the business, nor just to the owners of the business, but to the whole stakeholder community of that business.
the comparison of one business, sector or nation with another; (c) strategically by enabling alternative courses of action and their projected consequences to be compared. quantitative approach to performance evaluation is essential, even if some aspects of performance are qualitative in nature. It is necessity, therefore, that measurement is a constituent of performance evaluation. It is necessary to determine what should be measured in order to evaluate performance. It is thus essential therefore to select appropriate measures for the purpose of the evaluation. It is argued, however, that appropriate measures cannot be selected until the purpose of evaluation has been determined. Furthermore, Crowther (1996) stated that there are four purposes of evaluation: (1) evaluation for control, (2) evaluation for strategy formulation, (3) evaluation for accountability, and (4) the reporting performance.
METHODOLOGY AND DATA SAMPLE
This section describes how this study was conducted. It describes the research model and the data sample was employed in the study. This study was designed to measure and analyze the productivity and efficiency of the Indonesian banks listed in IDX for LQ 45 during period 2003 – 2007. The aggregate period of analysis was 35 years. The study used panel, cross-sectional, and time-series data of 7 Indonesia banks listed in IDX during the study period or during 5 years.
In order to measure and analyze the productivity and efficiency of the Indonesian banks, this study used Data Envelopment Analysis (DEA) approach—particularly, Output-oriented DEA Malmquist Productivity Index Method introduced by Fare, Grosskopf, Norris, and Zhang (1994). There were 3 inputs and 3 outputs used in this study. The inputs were: 1). Total assets; 2). Total equity; and 3). Total interest expenses. Whereas, the outputs were: 1). Total number of stocks; 2). annually average of share price; and 3). Net Income.
DEA Malmquist Index defines a productivity index based on output distance DEA Malmquist Index defines a productivity index based on output distance function. The index is the geometric mean of two Malmquist productivity indices. The output-oriented Malmquist productivity index can be defined as follow (Fare et al., 1994, p. 71):
Where: Mo = Malmquist productivity Do = Output-oriented distance function
The Mo in Equation 1 represents the productivity index that measures the change over time, t+1 and t, of input (xt+1) and output (yt+1),
relative to a starting production point of input and output (xt, yt). The input(s) and output(s) are
represented by xt and yt, respectively. The Total
Factor Productivity (TFP) growth is the geometric mean of two outputs-based indices from period t to period t+1. TFP is a ratio of the distances between the two data points in a given output (y) and an input (x).
All values derived from the Malmquist index which are greater than one indicates a positive TFP growth from period t to period t+1 while all values are lesser than one indicates a decrease in TFP growth or performance relative to the previous year (Tong, 2001). Equation (3.1) can be broken down into two components, namely: Efficiency Change (EFFCH) and Technical Change (TECHCH).
Equations (2) and (3).
Efficiency change (Equation 3.2) measures the movement towards the frontier from period t to period t+1. Technical change (Equation 3.3) measures the shift in the frontier technology. Thus, the Malmquist index of total factor productivity change (TFPCH) is the product of efficiency change (EFFCH) and technological change (TECHCH). This study used the output-oriented model of DEA-Malmquist to emphasize much on the expansion of output quantity out of a given level of inputs.
Data Envelopment Analysis (DEA) particularly Output-Oriented Malmquist Productivity Index of Total Factor Productivity was employed. Table 1 summarizes the Malmquist index of annual means (averages) of the Indonesian banks listed in IDX for LQ 45 ranked by Total Factor Productivity (TFPCH) over period 2003 – 2007. The table shows that there are five (5) productive Indonesian banks namely: bank 6, 3, 2, 1, and 4 have TFP indices greater than one (1.000). Whereas, the other banks namely: bank 7 and 5 are non-productive banks because they have TFP indices less than one. Furthermore, table 1 indicates that the bank 6 is the best productive
performer because it has the highest TFP index (1.177) while the bank 5 is the worst productive performer because it has the lowest TFP index (0.870). Since bank 6 has a TFP index 1.177, implies there is a positive productivity growth of 17.7 percent per year. The TFP index 1.177 of the bank 6 decomposed to managerial or technical efficiency change (EFFCH) index 1.228 and the technological change (TECHCH) index 0.958. This indicates that the positive growth of 17.7 percent of the bank 6 is influenced by EFFCH because it has a positive growth as well but not by TECHCH.
Table 1. Malmquist Index Summary of Annual Means of Indonesian Banking Ranked by TFPCH Over Period 2003 – 2007.
BANK TFPCH EFFCH TECHCH
6 1.177 1.228 0.958
3 1.152 1.000 1.152
2 1.134 1.031 1.100
1 1.094 1.019 1.074
4 1.080 0.975 1.109
7 0.898 0.964 0.932
5 0.870 0.975 0.893
Geometric Mean 1.051 1.024 1.027
In addition, table 1 shows that Indonesian banks has TFP index mean of 1.051 that decomposed to EFFCH index mean of 1.024 and TECHCH index mean of 1.027. This indicates that Indonesian banks have a positive productivity growth of 5.1 percent per year. The productivity growth is supported by increasing 2.4 percent per year of managerial progress (EFFCH) and it is also supported by increasing 2.7 percent per year of technological progress (TECHCH). However, the productivity growth of the Indonesian banks is more dominated by technological progress than managerial progress. Specifically, this table shows that 5 of 7 or 71 percent of the entire Indonesian banks have a TFP equal to
or greater than one (1.000) while 2 of 7 or 29 percent have a TFP less than one (1.000). Based on the findings, therefore, majority of the Indonesian banks listed in IDX for LQ 45 operated efficiently and productively during the test period. This implies that the Indonesian banks listed in IDX for LQ 45 have managed their output such as transaction volume of stock, share/stock price, and net income and their inputs such as total assets, total equity, and total interest expenses productively over the test period. How efficient and what the determinant factors of efficiency and inefficiency of the Indonesian banks.
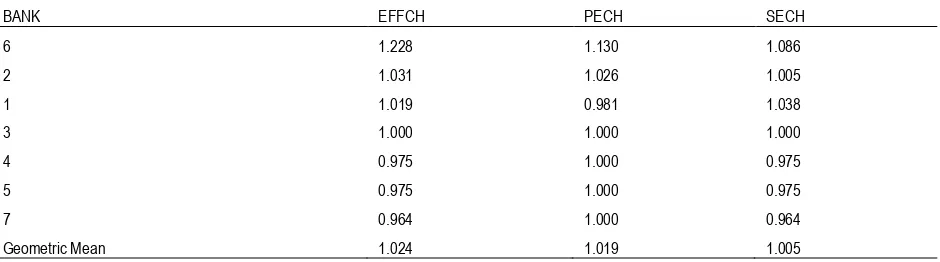
Table 2. Ranking of Technical Efficiency and Its Components of the Indonesian Banks Ranked by EFFCH Over Period 2003 – 2007.
BANK EFFCH PECH SECH
6 1.228 1.130 1.086
2 1.031 1.026 1.005
1 1.019 0.981 1.038
3 1.000 1.000 1.000
4 0.975 1.000 0.975
5 0.975 1.000 0.975
7 0.964 1.000 0.964
Table 2 summarizes the ranking of the technical efficiency change and its components. It reveals that the bank 6 is the highest efficient performer while the bank 7 is the lowest one. The bank 6 indices are 1.228, 1.130 and 1.086 for EFFCH, PECH and PECH respectively. Since its EFFCH index is 1.228, meaning there is an efficient growth rate of 2.8 percent per year. The contributing factors of the efficient growth are both PECH and SECH due to their indices are above one (1.000).
Table 2 also reveals that the bank 7 is the lowest efficient performer or the most inefficient of the Indonesian banks. Its indices are 0.964, 1.000 and 0.964 respectively. Since its EFFCH is 0,964, meaning there is an efficient decline rate of 3.6 percent (1 minus 0.964) annually. The contributor of the decline is SECH with index below one (0.964). This bank needs to be improved by increasing its performance by at least 3.6 percent annually.
Furthermore, table 2 reveals that 4 of 7 or 57 percent of the Indonesian banks have operated efficiently during the test period. The efficient Indonesian banks are 6, 2, 1 and 3. These efficient Indonesian banks have EFFCH index mean of 1.070 (see Table 2 or Figure1). It means that there is an efficient growth of 7 percent annually where the contributory of the growth comes from PECH (1.034) and SECH (0.032). On the other hand, there are six (3) Indonesian banks which operate inefficiently. Those are bank 4, 5 and 7. Their EFFCH index mean is 0.985 (see Figure 1). It means there is an efficient decline rate of 1.5 percent (1 minus 0.985) annually.
Therefore, these inefficient ones need to be improved by at least 1.5 percent annually so that they can operate efficiently in the same level as their peers.
Figure 1. Summary of efficient & inefficient performance of Indonesian banks over period 2003 – 2007
CONCLUSIONS
This last section presents a summary and significance of the findings arrived at in addressing the objectives of the study. The conclusions drawn from this study are as follow:
Generally, the Indonesian banks listed in IDX for LQ 45 over period 2003 – 2007 is productive banks because those banks have Total Factor Productivity (TFPCH) index 1.051. It means there is positive productivity growth of the banks 5.1 percent annually. This positive growth of 5.1 percent is influenced by EFFCH and TECHCH because they have a positive growth as well.
There are 71 percent of the Indonesian banks that is productive banks. They are bank: 6, 3, 2, 1 and 4. Whereas, the other banks (29 percent) namely: bank 7 and 5 are non-productive ones.
The most productive bank is bank 6 which has TFP index 1.177. This productivity is contributed by EFFCH which has index 1.228, however it is not supported by TECHCH that has index less than one (0.958).
The worst productive bank is bank 5 which has TFP index 0.870. This non-productive is influenced by its EFFCH and TECHCH which have indices 0.975 and 0.893 respectively.
The management of the non-productive banks has to improve their productive by increasing their outputs such as the transaction volume of stock, the share price and the net income.
As a whole the Indonesian banks listed in IDX for LQ 45 over period 2003 – 2007 is efficient banks because it has EFFCH index 1.024. It means there is positive growth 2.4 percent annually.
The positive growth of EFFCH is contributed by PECH and SECH because they have indices greater than one, namely: 1.019 and 1.005 respectively.
57 percent of the Indonesian banks listed in IDX for LQ 45 over period 2003 -2007 are efficient banks, whereas 43 percent is inefficient ones.
The index mean of inefficient banks is 0.985. It means there is an efficient decline rate of 1.5 percent annually. Therefore, these inefficient ones need to be improved by at least 1.5 percent annually so that they can operate efficiently in the same level as their peers.
Bank 6 is the highest efficient performer while bank 7 is the lowest one. The bank 6 indices are 1.228, 1.130 and 1.186 for EFFCH, PECH and SECH, respectively. Since its EFFCH index is 1.228, meaning there is an efficient growth rate of 2.8 percent per year.
REFERENCES
Beaver, Graham. (2001). Editorial Corporate Performance and Shareholder Value. Strategic Change 10(5), 241-245.
Chu, S.F. and Lim, G.H. (1998), ―Share performance and profit efficiency of banks in an oligopolistic market: evidence from Singapore,‖ Journal of MultinationalFinancial Management, 8, 55-168
Crowther, David E.A. (1996). Corporate performance operates in three dimensions. Managerial Auditing Journal. 11(8), 4-14.
Dogan, E. and Fausten, D.K. (2003), "Productivity and Technical Change in Malaysian Banking: 1989–1998," Asia-Pacific Financial Markets, 10, 205-237.
Fare, Rolf et. al. (1994). Productivity Growth. Technical Progress, and Efficiency Change in Industrialized Countries. The American Economic Review 84, 66-83.
Gilbert, R.A. and Wilson, P.W. (1998), ―Effects of Deregulation on the Productivity of Korean Banks,‖ Journal of Economics and Business, 50, 133-155.
Hadad, M.D., et al (2008), Banking Efficiency and Stock Market Performance: An Analysis of listed Indonesian Banks. Department of Economics Discussion Paper Series. WP 2008 – 07.
Jao, Y.C. (2001), The Asian Financial Crisis and the Ordeal of Hong Kong, Quorum Books,
Greenwood Publishing.
Kwan, S. H. (2002), "The X-Efficiency of Commercial Banks in Hong Kong," HKIMRWorking Paper No. 12/2002.
Leightner, J.E. and Knox-Lovell, C.A. (1998), ―The Impact of Financial Liberalization on the Performance of Thai Banks,‖ Journal of Economics and Business, 50, 115-131.
McKillop, D.G., Glass, J.C. and Morikawa, Y. (1996), "The Composite Cost Function and Efficiency in Giant Japanese Banks," Journal of Banking & Finance, 20 (10), 1651-1671 O’Mara, Charles E., Hyland, Paul W. and Chapman,
Ross L. (1998). Performance measurement and strategic change. Managing Service Quality 8(3), 178-183.
Pulley, L.B. and Braunstein, Y.B. (1992), ―A Composite Cost Function for Multiproduct Firms With an Application to Economies of Scope in Banking,‖ Review of Economics and Statistics, 74, 214-230.
Mishkin, Frederic S. (2003). The Economics of Money, Banking and Financial Markets. Columbia University USA. Addison Wesley. 6th Ed.,
211-237. Newbury Park, CA: Sage.
Sengkey, M (2006). ―Performance of the Regional Development Banks in Indonesia: An Application of Camel and Anova test‖. Journal of Business and Economics Universitas Klabat. Vol. 5 No. 2 pp. 1-19.