Business Intelligence Transformed
―
Rohit Kumar
Machine
Machine Learning
and Cognition in
Enterprises
Business Intelligence Transformed
Rohit Kumar Pune, Maharashtra, India
ISBN-13 (pbk): 978-1-4842-3068-8 ISBN-13 (electronic): 978-1-4842-3069-5 https://doi.org/10.1007/978-1-4842-3069-5
Library of Congress Control Number: 2017959563 Copyright © 2017 by Rohit Kumar
This work is subject to copyright. All rights are reserved by the Publisher, whether the whole or part of the material is concerned, specifically the rights of translation, reprinting, reuse of illustrations, recitation, broadcasting, reproduction on microfilms or in any other physical way, and transmission or information storage and retrieval, electronic adaptation, computer software, or by similar or dissimilar methodology now known or hereafter developed. Trademarked names, logos, and images may appear in this book. Rather than use a trademark symbol with every occurrence of a trademarked name, logo, or image we use the names, logos, and images only in an editorial fashion and to the benefit of the trademark owner, with no intention of infringement of the trademark.
The use in this publication of trade names, trademarks, service marks, and similar terms, even if they are not identified as such, is not to be taken as an expression of opinion as to whether or not they are subject to proprietary rights.
While the advice and information in this book are believed to be true and accurate at the date of publication, neither the authors nor the editors nor the publisher can accept any legal responsibility for any errors or omissions that may be made. The publisher makes no warranty, express or implied, with respect to the material contained herein.
Cover image by Freepik (www.freepik.com) Managing Director: Welmoed Spahr Editorial Director: Todd Green
Acquisitions Editor: Celestin Suresh John Development Editor: Matthew Moodie Technical Reviewer: Jojo John Moolayil Coordinating Editor: Sanchita Mandal Copy Editor: Brendan Frost
Compositor: SPi Global Indexer: SPi Global Artist: SPi Global
Distributed to the book trade worldwide by Springer Science+Business Media New York, 233 Spring Street, 6th Floor, New York, NY 10013. Phone 1-800-SPRINGER, fax (201) 348-4505, e-mail [email protected], or visit www.springeronline.com. Apress Media, LLC is a California LLC and the sole member (owner) is Springer Science + Business Media Finance Inc (SSBM Finance Inc). SSBM Finance Inc is a Delaware corporation.
For information on translations, please e-mail [email protected], or visit http://www.apress.com/rights-permissions.
Apress titles may be purchased in bulk for academic, corporate, or promotional use. eBook versions and licenses are also available for most titles. For more information, reference our Print and eBook Bulk Sales web page at http://www.apress.com/bulk-sales.
&
Contents at a Glance
About the Author ... xix
About the Technical Reviewer ... xxi
Acknowledgments ... xxiii
Introduction ...xxv
■
Chapter 1: Journey of Business Intelligence ... 1
■
Chapter 2: Why Cognitive and Machine Learning? ... 27
■
Chapter 3: Artificial Intelligence—Basics ... 33
■
Chapter 4: Machine Learning—Basics ... 51
■
Chapter 5: Natural Language Processing ... 65
■
Chapter 6: Predictive Analytics ... 75
■
Chapter 7: Cognitive Computing ... 99
■
Chapter 8: Principles for Cognitive Systems ... 129
■
Chapter 9: Parallel Evolving IT-BI Systems ... 163
■
Chapter 10: Transformation Roadmap ... 195
■
Chapter 11: Transformation Road Blockers ... 233
■
Chapter 12: Self-Evolving Cognitive Business ... 261
■
Chapter 13: Path Ahead ... 279
Contents
About the Author ... xix
About the Technical Reviewer ... xxi
Acknowledgments ... xxiii
Introduction ...xxv
■
Chapter 1: Journey of Business Intelligence ... 1
Business Intelligence ... 1
Why & How It Started ... 4
Going Ahead ... 5
By the 1980s ... 5
On Entering the 2000s ... 7
Initial Use Cases ... 7
Later Use Cases ... 10
Shifting Paradigm ... 12
Customer Relationship Management ... 15
Market Research Analysis ... 16
Loyalty Management ... 16
Product Release ... 16
Case Study ... 18
BI Before Paradigm Shift ... 19
■
Chapter 2: Why Cognitive and Machine Learning? ... 27
Artificial Intelligence (AI) and Machine Learning (ML) ... 27
Why Artificial Intelligence and Machine Learning? ... 28
Why Cognitive? ... 30
■
Chapter 3: Artificial Intelligence—Basics ... 33
Overview ... 33
Goals of Artificial Intelligence ... 34
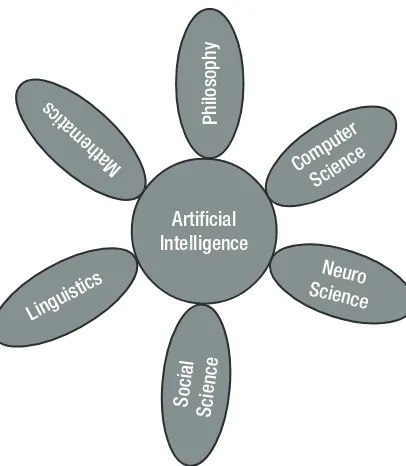
Components of Artificial Intelligence ... 35
Why AI?... 40
Approaches ... 41
Symbolic Approaches ... 43
Mixed Symbolic Approaches... 44
Agent-Oriented and Distributive Approaches ... 44
Integrative Approaches ... 44
Tools ... 45
Logic Programming ... 45
Automated Reasoning ... 46
Search Algorithms ... 46
Artificial Neural Networks ... 48
Summary ... 48
■
Chapter 4: Machine Learning—Basics ... 51
Machine Learning ... 51
Machine Learning Tasks ... 55
Classification ... 55
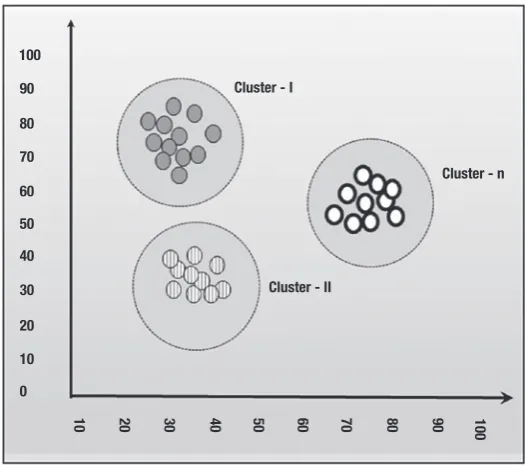
Clustering ... 55
Connected Key Concepts ... 57
Deep Learning ... 57
Genetic Algorithms ... 60
Decision Tree and Association Rule ... 60
Bayesian Network ... 60
Speech Recognition ... 60
Biosurveillance ... 61
Machine Learning vs. Statistics ... 61
Business Use Case Example ... 62
■
Chapter 5: Natural Language Processing ... 65
Natural Language ... 65
Natural Language Processing—Overview ... 66
NLP and Machine Learning ... 68
How NLP Works ... 69
Words and Letters First ... 69
Sentences Come After ... 70
Pragmatics... 72
Business Cases ... 72
Chatbots ... 72
Spam Filters ... 72
Sentiment Analysis ... 73
Search Engines ... 73
Question Answering ... 73
■
Chapter 6: Predictive Analytics ... 75
Overview ... 75
Data Relevancy ... 77
Fresh and Genuine ... 78
Avoid Noise ... 79
Avoid Personal or Sensitive Data ... 80
Data Retention Period ... 81
Past, Current, and Future Value ... 81
Consistent and Not a Liability ... 81
Outdated or Out of Purpose ... 82
Predictive Analytics—Process ... 82
Sources and Storage ... 84
Data Modeling ... 84
Analytics ... 85
Reporting ... 85
Types of Analytics ... 85
Descriptive Analytics ... 88
Diagnostic Analytics ... 89
Prescriptive Analytics ... 90
Tools ... 91
SAP HANA Predictive Analytics ... 92
Apache Mahout ... 92
IBM SPSS ... 92
SAS ... 92
Statistical ... 92
Oracle Advanced Analytics ... 92
Actuate ... 93
Some Applications ... 93
Manufacturing ... 93
Marketing and Demand Management ... 94
Predictive Maintenance ... 95
Flexi Pricing ... 96
Weather Forecast ... 97
Epidemic Management ... 97
R&D ... 97
■
Chapter 7: Cognitive Computing ... 99
Cognition ... 99
Cognitive Computing ... 103
Cognitive Era ... 107
Cognitive Architecture ... 109
Soar ... 110
ACT-R ... 110
CMAC ... 110
CLARION ... 110
Cognitive Chip ... 111
Why Cognitive? ... 111
Was Always Desired ... 113
Big Data and Insights... 113
Advisory ... 114
IoT Leverage ... 114
Business Continuity ... 114
Utilize Resources ... 114
Efficiency ... 114
Customer Satisfaction ... 115
More Ad Hoc ... 115
Generate What’s Required ... 116
Look Inside ... 116
Cognitive + IoT ... 121
Use Cases ... 122
Cybersecurity ... 122
Oil and Gas ... 123
Healthcare ... 124
Clinical Trials ... 125
Summary ... 126
■
Chapter 8: Principles for Cognitive Systems ... 129
Design Principles ... 129
Identify Problem Area or Need ... 131
High-Level Scoping... 131
References... 132
Feasibility and Rescoping ... 132
Identify Finer Requirements or Associations ... 133
Blueprinting ... 134
Detailed Execution Plan ... 135
Identify Validation Checks... 137
Develop Pilot or Test ... 137
Validation ... 138
Fix Defects or Deviations ... 138
Optimize... 138
Feedback Assessment ... 138
Cognitive Design Principle... 139
Identify Problem Area or Need ... 139
References... 141
Feasibility and Rescoping ... 141
Identify Finer Requirements or Associations ... 141
Blueprinting ... 141
Detailed Execution Plan ... 142
Identify Validation Checks... 145
Develop Pilot or Test ... 146
Fix Defects or Deviations ... 146
Optimize... 146
Feedback Assessment ... 146
Cognitive Work Analysis ... 146
Workspace Design ... 148
Cognitive Knowledge Generation and Sources ... 148
Language Capabilities (Natural Language Processing) ... 150
Conversation or Communication Capabilities ... 150
Connectivity with All Sources of Data ... 151
Ability to Process All Types of Data ... 151
Knowledge Generation Capability ... 152
Recommendation Capabilities ... 152
Knowledge Generation—Some Details ... 152
Interfaces ... 156
Web-Based ... 156
IoT Interfaces ... 157
User Inputs ... 157
Business Data ... 157
Standard Data Feeds ... 158
Financial and Business Networks... 158
Failed Machines ... 158
Relation with Artificial Intelligence and Machine Learning ... 159
Summary ... 161
■
Chapter 9: Parallel Evolving IT-BI Systems ... 163
Where Do We Go from Here? ... 163
IT and Business Relations Today ... 164
Business and IT Scopes ... 165
Business & IT Relationship: Boundary ... 166
IT and Business Relationship: Where Is It Heading?... 170
Global Economics ... 171
Bountiful Data ... 171
Analytics ... 172
Speed to Market ... 172
Customer Relations ... 172
Look Inside ... 173
Collaboration Is Key ... 173
What Are Parallel Evolving IT-BI Systems? ... 174
Where Is This Placed? ... 178
Working Through a Plan... 181
Properties of PEIB Framework ... 182
Cognitive Capabilities ... 183
No Differentiation ... 183
Filling the Gaps ... 184
Single Version of Truth ... 184
Somatic Control ... 185
Sensory Reflexes ... 185
Unitary Decision Model ... 185
Collaborative to Core ... 187
Optimal Effort ... 187
Simplicity ... 187
Data Driven ... 188
Beyond the Surface ... 188
Is It Complicated? ... 189
Why Is This a Game Changer? ... 190
Case Study ... 191
Summary ... 193
■
Chapter 10: Transformation Roadmap ... 195
Some Facts ... 195
IT Expense Priorities ... 195
Latest Trends ... 197
Enterprise or Business Size ... 197
PEIB Framework ... 198
Initialize ... 200
Formalize ... 201
Scenario Arrival Matrix ... 202
Scenario Checklist ... 206
Scenario Priority List ... 215
Knowledge and KPI Checklist ... 216
Develop ... 224
Blueprint and Design ... 225
Development and Training ... 226
Validation and User Feedback ... 227
Deployment... 227
Integrate ... 228
Digital Transformation ... 229
A Holistic Transformation ... 230
Cognitive in Manufacturing ... 230
Summary ... 231
■
Chapter 11: Transformation Road Blockers ... 233
Method or Scope Related ... 234
Use Case Relevance ... 234
Assorted Demos ... 235
Traditional Methods ... 236
Planning Related ... 236
Strategy ... 236
Top Down ... 237
Wrong Initiation ... 238
Vendor Entry ... 238
Milestone Tracking ... 239
Right Involvement ... 239
Knowledge Resource ... 240
Resource Alignment ... 240
Implementation Related ... 242
Scope and Blueprint Alignment ... 242
Anchor Points ... 243
System Training ... 243
Adoption Related ... 244
Ignorance ... 244
Cost Factor ... 245
Industry Core Absence ... 245
Culture Shock ... 248
Risks ... 249
People-Related Risks... 250
Process-Related Risks ... 253
Technology-Related Risks ... 256
Management-Related Risks ... 257
Summary ... 258
■
Chapter 12: Self-Evolving Cognitive Business ... 261
Conventional vs. Cognitive Self-Evolving Systems ... 262
Silos ... 262
Mixing Areas for Decision ... 266
Leadership Effectiveness... 267
Expansion and Integration Issues ... 269
Wastage and Overkill ... 271
HR Management ... 271
What Then Is Self-Evolving Business? ... 272
Reality Check About Cognitive ... 273
Is Cognitive for Everyone? ... 274
Is Cognitive Foolproof? ... 275
Are All Vendors/Products Good? ... 276
Self-Cognitive Capability? ... 276
Is Cognitive Taking Jobs Away? ... 277
Summary ... 277
■
Chapter 13: Path Ahead ... 279
Path Ahead: Implementing Organizations ... 279
Strategic Value ... 280
Transform People and Culture ... 281
Top Down ... 282
Customization and Usage ... 282
Right Partner and Solution... 283
Three Keys ... 283
Decentralization ... 285
Momentum ... 285
Security ... 285
Path Ahead: IT Service and Product Companies... 286
Strategy Build ... 287
Product Quality ... 288
Incubation and Inculcation ... 290
Market Outreach ... 290
Center of Excellence (COE) ... 291
Project Management COE ... 292
Collaboration... 292
Skill Development and Maturity ... 292
Path Ahead: IT Consultants ... 293
Existing Workforce ... 294
New Workforce ... 296
Thanks and Goodbye! ... 297
About the Author
Rohit Kumar has a masters in computer science including artificial intelligence, bioinformatics, and business intelligence.
He has been working as a senior enterprise architect and project manager in business intelligence, business process automation, reporting, and big data analytics.
He has worked with organizations like IBM, Cognizant, Patni (now Capgemini), and PriceWaterhouse Coopers.
He also has experience/interests in Omnichannel marketing solutions, BlockChain, Data Lake, cognitive computing, and cloud technologies.
He has consulted for 30+ clients across the globe in multiple industry verticals toward IT transformation. He has experience with customers in various industries (e.g., Fast Moving Consumer Goods (FMCG), retail, pharmaceutical, telecommunications, electronics, education, manufacturing, healthcare, logistics, utilities, banking, real estate, e-commerce, and publishing).
Rohit also serves as guest lecturer for faculty development and PhD scholars for various universities while creating extensive learning programs in SAP and analytics for various organizations. He already has numerous online publications on SAP SDN and LinkedIn. He also has contributed many offline contents for various organizations. Rohit has also conducted multiple training programs for many top IT organizations and headed training departments in the areas of business intelligence, e-commerce, analytics, big data, data security, and encryption.
About the Technical
Reviewer
Jojo Moolayil is a data scientist and the author of the book Smarter Decisions: The Intersection of Internet of Things and Decision Science (Packt, 2016). With over five years of industrial experience in data science, decision science, and IoT, he has worked with industry leaders on high-impact and critical projects across multiple verticals. He is currently associated with General Electric, the pioneer and leader in data science for industrial IoT, and lives in Bengaluru, the Silicon Valley of India.
He was born and raised in Pune, India and graduated from the University of Pune with a major in information technology engineering. He started his career with Mu Sigma Inc., the world’s largest pure play analytics provider, and has worked with the leaders of many Fortune 50 clients. One of the early enthusiasts to venture into IoT analytics, he converged his learnings from decision science to bring the problem-solving frameworks and his learnings from data and decision science to IoT analytics.
To cement his foundations in data science for industrial IoT and scale the impact of the problem-solving experiments, he joined a fast-growing IoT analytics startup called Flutura based in Bangalore and headquartered in the valley. After a short stint with Flutura, Jojo moved on to work with the leaders of industrial IoT, including General Electric, in Bangalore, where he focused on solving decision science problems for industrial IoT use cases. As a part of his role at GE, Jojo also focuses on developing data science and decision science products and platforms for industrial IoT.
Apart from authoring books on decision science and IoT, Jojo has also been the technical reviewer for various books on machine learning, deep learning, and business analytics from Apress. He is an active data science tutor and maintains a blog at http://www.jojomoolayil.com/web/blog/.
Profile
http://www.jojomoolayil.com/
https://www.linkedin.com/in/jojo62000
Acknowledgments
I acknowledge Vagisha and Smriti for helping in refining project process definition areas. And for all the late-night coffees. Without their support it would have been very difficult to manage my work and writing. They helped me to keep free from everything else and focus.
Gaurav Kumar (IBM) for allowing the use of his picture and also doing modeling for one picture in the book.
Introduction
In my experiences in technology and consulting for my various clients, I have seen that there is always a new technology around the corner which is fascinating and promises lots of new stuff in terms of usability and functionalities. The good thing is that these technologies are progressively more potent and vivid in functionality and business use cases, but they can be confusing too.
The reasons are interesting. The technology follows business needs and progresses along with it. But not all businesses are very much into the latest technology adoption based on their exact needs and various other reasons. Even so, there is always a bigger chunk of business that actually tries to follow what is needed progressively for them in terms of technology adoption. This is where the confusion starts. When an organization wakes up to look for a change, the technology might be generations ahead from what they are into currently. That is where good consulting capabilities come into the picture. Also, awareness on the part of the CXO and other decision makers is absolutely important. But there might be gaps here as well: technology notoriously progresses in leaps and bounds, and attempting to understand it in terms of how it was earlier won’t help at all.
This book is centered around this problem. This is designed first to provide all the basic knowledge toward understanding machine learning and cognitive computing and the other topics covered. But it also presents a new framework called PEIB (a brand-new framework I have defined in this book), which is designed to help decision makers understand where to start with adopting and adapting these technologies for their specific organizational needs and structures and how to achieve success in this process. This is seen in the core chapter of this book: Chapter 10, Transformation Roadmap.
Readers are advised to go progressively through the chapters and build the prerequisite understanding in the right order.
I have tried to keep the details and descriptions of even the technical areas as much possible in business-understandable language and with plenty of examples.
Wherever needed, I have provided real and hypothetical business use cases or case studies to ensure that the concepts are well absorbed.
Let me first describe here the details covered through the chapters, and then I will present a general idea of the book.
Details Through the Chapters
In Chapter 2, we briefly discuss the need to go for cognitive and machine learning. For the sake of understanding there, we have a small discussion about the difference between artificial intelligence and machine learning. The reason we have this here, though we have these topics handled individually in further chapters, is just to set the right context of the discussion within the scope of this chapter. We conclude this chapter with a quick discussion about why cognitive computing is necessary. This chapter is the springboard for the discussion about each of the individual topics further, while just giving a quick idea about why these were required.
Chapter 3 is centered around basics of AI. The basics of AI are needed to be able to have prerequisite understanding of further concepts, like machine learning and cognitive computing. The scope of this book is not technical and so in-depth technical descriptions and details are not included. I have taken only those basics which help us to harness needed knowledge to be able to adopt and adapt these technologies. Supervised learning, unsupervised learning, and reinforced learning are also explained with examples and figures. The need for AI is again discussed here but in further depth. Approaches toward AI are also discussed here.
Chapter 4 talks about machine learning basics. It includes some detailed examples about training models and tasks. The very interesting technological concept of deep learning is also discussed with an example for easy understanding. Some good examples are mentioned throughout this chapter as well, and a very interesting business use case of Netflix is presented at the end.
Throughout the book you will notice various graphs and pictures drawn with great effort to help visualize things better.
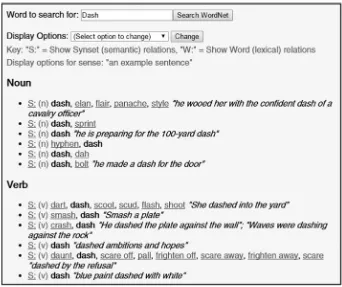
From here we move to the interesting topic of natural language processing (NLP) in Chapter 5. NLP is a very wide area of study. For the scope of our book, we have kept it to just the minimum needed. The topic is described briefly with examples and clear steps to explain how it works.
Predictive analytics is another topic discussed in some detail in this book in Chapter 6. The discussion starts with an overview of predictive analytics and also talks about the properties of the data which has to be taken care of to have a proper Predictive analytics. In some detail, the process of predictive analytics is then discussed together with a clear figure to visualize it. Also, different types of analytics are discussed. Some important products are also mentioned in this chapter. The chapter ends with some interesting use case examples for a better understanding.
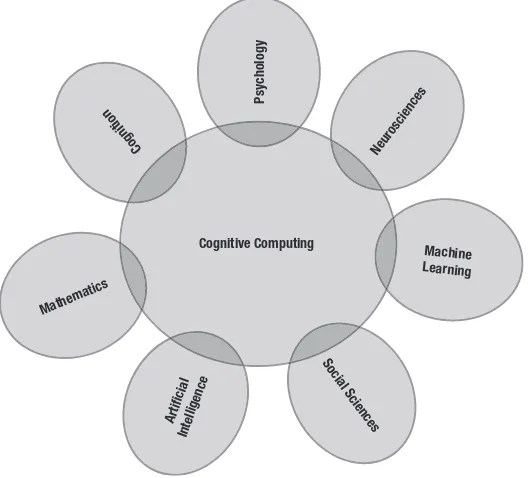
Chapters 7 and 8 are dedicated to build up knowledge toward cognitive computing. Cognitive computing is an area which is deeply influenced by human or animal cognition studies and properties. So, Chapter 7 starts with a discussion of cognition. The concepts of cognitive computing follow after that. The cognitive architecture and, in some more detail now, the question of “Why cognitive?” are mentioned in this chapter. Some interesting use cases are presented too. The chapters also include within them the design principles of cognitively designed systems. This is a very important discussion. Details are explained by a simple day-to-day example. The complexity of decisions possible using the cognitive solution is also discussed here. Various examples are presented to understand the underlying concepts. A detail on the relationship of cognitive to AI and ML is also presented in this chapter.
of how the IT and business relationship works today. Gaps and limitations are examined in this chapter. Then we discuss the changing paradigm in this relationship and the need for the same. I have defined this new term PEIB then in this chapter and also how it is placed. Some very interesting figures are added to supplement understanding. Then, the properties of such a system are described further and it’s examined why this is a game changer for business. Chapter 8 ends with a case study to understand all inputs from Chapters 7 and 8.
Chapter 10 is the core chapter. I have defined a new framework, the PEIB framework, in this chapter. So, this is the actual chapter which helps in answering the question that may be asked: “Yes, the technology is good, but how should I go about these changes and where should I start?” This has a detailed description and definition of this framework. Since this is the core chapter, it’s also the longest. I can’t describe much further about this chapter, as something which hasn’t existed heretofore is detailed there. So, the only way to better understand that is to reach there and learn.
Chapter 11 talks about the road blockers, hurdles, risks, and mitigations that could get in the way of such a transformation as discussed in Chapter 10.
Chapter 12 talks about the parallel evolving cognitive business. This is also a term I have created, and now with all the knowledge accumulated through all previous chapters, is used to define and describe a real cognitive system.
The concluding chapter, Chapter 13, talks about the path ahead for organizations implementing such solutions or planning to go through such transformations, including a detailed discussion for IT service providers and IT consultants.
General Idea of Book
The book focuses on the problem of helping organizations adopt and adapt ML and cognitive computing toward transforming into data-driven and cognitive organizations.
So, there are four areas of this book. The basics of technical concepts needed as prerequisites are detailed in the first area. Here, the basics of AI, ML, NLP, predictive analytics, and cognitive computing are discussed. Since the book is not intended to be technical, these are explained in simple language and with plenty of examples. The concepts of cognitive computing are explained in comparison to human cognition.
Once the basic knowledge has been built and a clear understanding of its need has been obtained, the next and core part now is around the problem area of how to adopt and adapt. It mentions in great detail the intricacies of how it should be done, via a new framework defined and presented through this book and named the PEIB framework.
The third part is about the possible blockers, risks, and mitigations that need to be considered to ensure that everything mentioned in the previous parts can be done very successfully.
The fourth and final part then describes the concept of the cognitively driven business to give a glimpse into the results; it concludes with a deep thought about the path ahead.
I hope this book helps my readers come up with a sound understanding about the adoption and adaptation of such technology and the way of business transformation, along with all the necessary basic technical awareness needed.
I finish this introduction with a quote by Bil Keane:
Yesterday’s the past, tomorrow’s the future, but today is a gift. That’s why it’s called the present.
Journey of Business
Intelligence
The scope of this chapter is to build up an initial understanding of business intelligence (BI) with definitions. This chapter is also aimed at building a basic understanding of how it started and what the initial use cases for it were. I will also cover the paradigm shift into the industry business usability use case for business intelligence.
■
Note
This chapter stresses building up readers’ initial understanding of the core
subject area. So, even if you are familiar with business intelligence terms, it is still advisable
to go through this chapter in order to connect with the thought process initiated via this
chapter; this will help in the presentation of more advanced topics in later chapters.
Business Intelligence
Business intelligence is not an alien word for the IT and business departments within almost all corporations, whether small or big. There are already many players with business intelligence products on the market. The following are some of the popular players in the market (in order of price, from high to low):
• SAP
• IBM Cognos
• SAS
• Pentaho
• Alteryx
• MS SQL – BI Edition
• GoodData
• Board
• BI360 Suite
• iDashboard
• Mits Distributor Analytics
• Dundas BI
It is of the utmost importance for a business to have at least some business
intelligence solutions so that it can act and manage operations intelligently. This required data as information to be right in front of their eyes. It could be as simple as Microsoft Excel–based pivot tables and charts.
Here is my definition: “business intelligence is a set of technologies and means to acquire data in various formats from various inbound data sources and to churn out meaningful reports, or visualizations, or alerts from it, which in turn supports the business in its various aspects and in turn business as a whole.”
So, the definition itself puts forward the importance and vast applicability of these technologies, that is, churning out content about what and how you are doing from all data sources you have been working with. With today’s technologies, it is even possible to use structured as well as unstructured data equally for business intelligence–based interpretation of data.
Until recently, a data warehouse was the primary or even sole source of business intelligence. However, with changing technologies and high-speed memory–based databases (e.g., HANA), it is even possible to do entirely without a data warehouse. A transactional system could be directly utilized for reporting. The division between separate OLTP (online transaction processing) and OLAP (online analytical processing) systems is going away. OLTP systems used to have primary responsibility for supporting day-to-day business transactions, with OLAP systems running modeling and reporting exercises on subsets of data extracted into them from OLTP. This is data warehousing capabilities and business intelligence.
Technology now has made it possible to bring in advances to provide the best possible analytical business intelligence, and on the other hand it is also helping it become more agile, simpler to achieve, and more scalable; it has also made it possible to have more rapid deployments and achieve more return on investment (ROI) with less investment overall. In other words, the diminishing line between OLTP and OLAP has made it possible to avoid having two separate systems and has resulted in further cost reductions.
terms, it means less redevelopment in deploying solutions with new additions that stem from the changing needs of the business.
Analytics is a subset of business intelligence which is primarily related to running statistical algorithms (generic for business process or customized for organizations) in the back end before more complex results are displayed using reports and dashboards. Various kinds of analytics are part of the off-the-shelf packages of almost all business intelligence products.
The most basic business intelligence reporting is limited to simple reporting based on key performance indicators (KPIs) aggregated to display performance summaries of business processes and areas for business decision improvement; this is also called a decision support system (DSS). At times, it serves to report organizational summaries to top management; thus, it may also be known as a management information system (MIS). In the preceding scenarios, the reporting could be technically just an aggregation of various levels with a multidimensional organization of data for a more flexible display of information.
■
Note
With the advancement in database technologies and landscape simplification,
it is possible to achieve more real-time information via business intelligence.
The various usability use cases of business intelligence are as follows:
• Measurement of performance matrix & KPIs
• Providing a collaborative platform for data integration & exchange
• Visualization of department data
• Knowledge management
• Regulation compliance management
• Planning operation support
• Predictions
Current statistics show that total business intelligence market revenues stand at $13.3 billion worldwide. Also, as a prediction, almost 75% of people in businesses will be using one or another business intelligence tool by 2020.1
Increasing the scope of cloud-based software-as-a-service (SaaS) and infrastructure-as-a-service (IaaS) is helping business intelligence products find their way to customers of all sizes, as they need to pay-as-per-use according to their requirements.
Due to lower maintenance costs and higher security commitment, even some bigger players have dropped inhibitions and have moved to cloud solutions. Some customers worth mentioning are Coca Cola, HTC, Best Buy, and PricewaterhouseCoopers (PwC).
1
This book will take you on a journey through the world of business intelligence, including its association with cognitive science and its theories. It will then help you through a framework to achieve the expertise you desire.
Let us first peek into the past and observe just how business intelligence started in some detail.
Why & How It Started
The intelligence driven by business intelligence is supported by multiple types of multisource and single-source data. Just like we demonstrate our intelligence by mixing up multiple sources of present and past data and experiences, business intelligence does the same. This is not possible to do with just a single source of information. Until now, the concept of learning from experience—“thinking”—was the missing link, but now this can be achieved using cognitive computing and analytics. Cognitive computing and analytics concepts are discussed from Chapter 2 onward.
The very first to mention the term “business intelligence” was Richard Millar Devens in his work Cyclopedia of Commercial and Business Anecdotes2 in 1865.
From the book: “Henry Furnese figures largely among the bygone bankers who gave renown to the financiers of that period. Throughout Holland, Flanders, France, and Germany, he maintained a complete and perfect train of Business Intelligence.”
This example of a banker using relevant information to win business use cases as early as the 1860s speaks to the critical importance of business intelligence. Unfortunately, he used this knowledge harvesting and interpretation technique to win business by fraudulent means, and so the first use of business intelligence was in a negative direction. Whether for good or for ill, however, business intelligence was limited at that time to being a tool to make relatively simple decisions; multiple-use cases evolved only with time.
Other important names in this regard are Hans Peter Luhn (IBM) in 1958 and Howard Dresner (Gartner) in 1989.
Devens first mentioned the label “business intelligence,” and Dresner coined its modern definition; but due to the actual first thorough work in this subject, Luhn is considered to be the father of business intelligence.
In October 1958, Luhn published an article in IBM Journal on the topic.3 He
mentioned that “an automatic system is being developed to disseminate information to the various sections of any industrial, scientific or government organization. This intelligence system will utilize data-processing machines for abstracting and auto-encoding of documents and for creating interest profiles for each of the ‘action points’ in an organization. Both incoming and internally generated documents are automatically abstracted, characterized by a word pattern, and sent automatically to appropriate action points.”
2
https://archive.org/stream/cyclopaediacomm00devegoog#page/n262/mode/2up/search/ business+intelligence
3
He ended his article saying that “the auto-abstracting and auto-encoding systems are in their early stage of development and a great deal of research has yet to be done to perfect them. Perhaps the techniques which ultimately find greatest use will bear little resemblance to those now visualized, but some form of automation will ultimately provide an effective answer to business intelligence problems.”
Luhn described business intelligence solutions to the problem of apprehending the interrelationships of presented facts in such a way as to guide action toward a desired goal.
Going Ahead
With the onset of the 20th century, the technology to hold larger volumes of data and to manipulate it electronically became available. This technological maturity also fed upon itself, in a sense, to propel even more data management capability. After World War II, the world was going through a postwar economic boom. This period, called a golden age of capitalism by some, was seen as a rapid second industrial revolution. These factors all led to research like Luhn’s on business intelligence to help businesses to adapt, prosper, and better manage their resources.
Many things described in his paper are still considered to be important: ad hoc or individual queries as differentiated from regular standard queries, security and data ownership (who should know what), auditing of data, performance optimization, and learning systems based on individual use patterns.
Significantly, he also mentions that advanced machines and technologies would be required to achieve all of that.
So, it would be wrong to think that self-learning machines, delivering business intelligence based on artificial or cognitive intelligence, are a new concept. Luhn, the father of business intelligence, even conceived of social features. Only the onset of demand in business with growing global competition was necessary for their achievement through advancements in technology.
Luhn presented a research paper called “The Automatic Creation of Literature Abstracts” to demonstrate technical research in this area.4
At its core, he described business intelligence systems as the ones which understand, create abstracts, and churn out reports from large volumes of data to establish
interrelations that provide insights to help in making decisions.
Luhn provided a broad vision at a very early time which is still valid; moreover, he provided initial ideas to connect it with various use cases to help in making smart decisions.
By the 1980s
Then, one by one came a series of products as DBMS systems to hold large volumes of data. After hierarchical DBMS by IBM and network DBMS by Honeywell in the 60s, finally the legendary “relational DBMS” was born at IBM in the late 70s. This provided the possibility of highly organized and huge DBMS to store everything possible using computers instead of paper or punch cards. So, technology integrated transaction systems directly as sources of data. This data was huge and organized with a complete presence in electronic format; no more need to convert format or preprocess. So, businesses were generating data which could be used in situ for business intelligence. This was a good change, because it provided a platform where business intelligence and its usability could be focused on more precisely, instead of merely thinking about possibilities.
Businesses started to see the advent of new departments called information centers, which sat in between IT and business. IT was focused on maintenance of all IT systems—hardware, software, and network—while information centers were data-centric. They knew which kind of data sits in which format and where. They were responsible for helping business to get hold of right data and for identifying and using the correct tools for it. Some of the initially available tools were Crystal Reports, MicroStrategy, and Business Objects. All this started to happen around the 80s.
The 80s saw the emergence of the concept of data warehouses as dedicated systems to help in business intelligence reporting. This was developed first by Barry and Paul (IBM). It emphasized distinct OLTP and OLAP systems. It said that for maximum effect in letting the data warehouse run business smartly, OLTP systems and decision support business intelligence systems should be used in conjunction. This concept of warehouse systems brought about the concept of ETL (extraction, transformation, and loading). It provided concepts, best practices, and data flow methods to extract relevant data to these warehouses from OLTP systems.
Data from disparate OLTP systems started to flow in a common format into these data warehouses using various ETL methods and tools.
These data warehouses would extract data into respective business areas and then, based on reporting requirements, would compress it into smaller data marts for performance. These systems, also called OLAP systems, were good at providing responses to complex analytical queries of these stored data.
This growth of business intelligence was parallel to ERP (enterprise resource planning). So, businesses could establish synergy between multiple departments and, without bothering with data entry, use it to get critical answers for their questions.
In 1989, Howard Dresner from Gartner Group coined the term “business intelligence” as an umbrella term for all related concepts such as DSS, executive information systems (EIS), data warehouse–based data storage, extraction and analysis, OLAP, and ETL. By this time, the birth of business intelligence 1.0 was done.
Business intelligence 1.0, termed BI 1.0 for short, was a full-fledged ETL-based system. It was good in terms of performance and usability, but the key demerits were as follows:
• It took too much time to see data, and there were delays in seeing data after its generation in OLTP system
• It was very complex and cumbersome to get the solution in hand
• It was too dependent on experts to use the tools
So, on one hand, a successful first generation of fully functional business intelligence had been born. On the other hand, after the initial honeymoon period, it was becoming apparent that good results were too time consuming to achieve due to the complexity of use. So, it was a little like a razor which before each shave must have its blades replaced by designated experts only, or at the very least under their training (and this training takes a long time).
Another issue was high maintenance costs of application, solutions, and hardware. This also had a limiting effect on its use in industries.
So, BI 1.0 had two facets: data and reporting. One end handled the entry of data up to data marts, and the other pulled reports out of it.
On Entering the 2000s
Technological advances in the late 2000s started to overcome these primary difficulties and drawbacks. More real-time data access possibility and self-service options brought in the era of business intelligence 2.0, or BI 2.0 for short.
The most important differentiating factor between BI 1.0 and 2.0 was that while 1.0 focused on ETL and reporting using tools, 2.0 focused on better access, easier access, and expanding the databases. It could include wider databases by utilizing more of the Internet.
BI 2.5, which was the next in the series around 2005, added even more huge data computation capabilities onto what was already a huge data scope by then; it did this by using the Internet. Zettabytes of data were capable of being processed in little time to process information in dimensions previously unthought of. Data democratization also came as another important change. Cloud capabilities are further added advantages in this era.
Now with the addition of cognitive capabilities, business intelligence is entering the new era of BI 3.0. The scope of this book’s subsequent chapters is to describe this new BI 3.0 and cover how to implement it in and adapt it to your organization.
So, as a conclusion to “why and how,” we can say that it started with the emerging needs of expanding markets and its increasing operating complexities. Although the very first thought process by Luhn, the father of business intelligence, covered all aspects of a complete business intelligence system, it has yet to be implemented successfully in his full definition. BI 3.0 probably will complete this long-awaited implementation. On one hand, its origin and growth are need based, and on the other hand, technology had been a limiting factor. In his article “A Business Intelligence System,” Luhn described how these systems would cover social aspects; this was more or less accomplished by the time we reached up to BI 2.5. But he also described an “adaptive system to the need of the user,” and that seems to be happening in BI 3.0 via cognitive capabilities.
Initial Use Cases
The initial use cases for business intelligence could be broadly divided into two time frames: in the 1960s and in the 1980s up to the late 90s.
overhead and full of redundant data. Spread across hardcopy files and folders, the data was hard to reconcile or audit. The initial idea was to just automate this record-keeping in a way that would sort out all the shortcomings mentioned earlier. The technology was not that all supportive; it still needed the hybrid action of using paper or punch records and then transferring them manually to microfilms and tapes. But all this taking of pains was still worthwhile to get a neat electronic record as a result. Meanwhile, somewhere in IBM’s lab, Edgar Codd was inventing a new way of database management: the relational database management we use even now.
By the 70s, Codd’s (IBM) version of the database was in place, which was good enough to store data in new tabular forms; however, data was quite fragmented. The data was missing the relationship functionalities necessary to generate good business intelligence–supported visualizations. The technology was a limiter in this case; if it would have been feasible technically, businesses would certainly have cherished that. But with the kind of technology available then, all they could achieve was electronic records which could be retrieved on demand; of course, this alone was much better than bulky and unmanageable paper cabinets and folders. So, this era did not have actual use cases where some data mash-up and visualization were provided or even possible; what happened instead was bringing data entry to files and then to fragmented tables as electronic records. Other use cases were in the form of MRP in production management and control.
The start of the 80s brought along with some new technology leaps in the form of relational databases and data warehousing concepts. This age brought in technologies to seek and get more in terms of actual business intelligence solutions and products. The very first breed of efficient and cutting-edge tools came in this period, and with this it was possible to run use cases like DSS, EIS, and MIS on consolidated data utilizing central data warehouses. Practicing ETL required bringing data to so-called OLAP systems to run complex business queries. Businesses started to see new IT-business hybrid departments known as information centers. These people would know where the data is and would use tools to extract desired information for business users and analysts. This was the time for real IT-owned developments happening on large scales. Businesses would plan to their satisfaction a summary of queries they would like to see from various departments or combinations. IT would figure them out, develop them, and hand them over. They could see combinations of data from multiple departments; for example, production people could see sales pipeline data, and finance could easily keep an eye on day-to-day expenses incurred by marketing. As personal computers were already in place and even first-generation ERPs were already there, no data entry manual effort was required. Automated ETL activity would take care of this. There were rich visualization tools available, like business objects, to allow fine visualization on top of data. Use cases would run, as every department even in big enterprises had the central warehouse get data harmonized and stored in one place, to be automatically displayed via reports developed by IT.
So, as a summary initial use case, between the 60s and the 80s, business intelligence went from the very beginnings of data entry automation all the way to advanced
database-supported data warehouse marts and the ability to support rich combined data with great visualizations on top of it.
AT&T invested millions of dollars to have a huge legacy-based data warehouse to churn data from services and customers. Although initially it was used for so few users that it was possible to count them on your fingers, it nevertheless later helped to establish a system which had all the data and business intelligence tools to be able to segment prospective customers. This took a lot of time, effort, and money, but it paid off in the form of the gain of millions of accounts just because of that. With time, AT&T upgraded its warehouses and business intelligence solutions, and so its grip on market and customers increased. The initial business intelligence, by setting up a legacy-based warehouse, brought down its customer acquisition cost to lower than ever before. Investment for the cause was bringing more value for the money. At that time in history, however, data warehouse and business intelligence were so new that no one bothered to think in the direction of establishing a concept of return on investment (ROI) for these investments. Developments were cumbersome, complicated, and time consuming. But with the distinct rise in profits because of this, ROI benefits were visible and were flaunted by business intelligence– and data warehouse–selling companies.
The early 90s saw government agencies like the US Naval Warfare Center coming to use these solutions. A data warehousing and business intelligence project was launched to combine data from 30 different disparate systems to bring together 12GB of data (a big project in 1991) equivalent to about 12 billion characters of information. This served 700 users across Virginia, Maryland, and Florida, simplifying the naval information management system. The efforts to get accurate and timely details on any planned or executed project would flow in harmony to the desired user on demand, instead of tapping in into 30 systems with unharmonized data. This came up as one of the early adoptions of these technologies by any government. Later government adopters were healthcare and financial organizations.
One of the prominent and successful early use cases of business intelligence was that of insurance agencies. Aetna Life Insurance and Travelers Insurance were leaders in the 90s. They were getting mountains of data from individual motorist insurance and claim data. This gave them an opportunity to visualize the cost separation between underinsured and uninsured motorists, but it was nearly impossible to take advantage of this opportunity without these technologies. This helped them to negotiate insurance rates with government, issue competitive pricing when new competitors entered the market, and analyze sales in multiple product areas. Some even claimed to gain 1000% more ROI due to this.
Later Use Cases
The later use cases for business intelligence could be divided broadly into two time frames: the early 2000s and the later 2000s before 2015.
By the start of the 2000s, businesses were having a myriad of business intelligence products running on top of data warehouses. They could by now in reality see ROI benefits brought forward by these solutions. That was all fine and dandy, but something had also changed by this time. Businesses were using this for over a decade and slowly almost everyone came to be using the same. This brought the ROI and any other benefit graph to a plateau. The businesses, depending on the type of industry vertical and the subarea of interest, were mostly using standard scenarios. Industry standard contents were not very well established, and due to coming from a generation of data entry automation into the first generation of data warehousing, the businesses were implementing identical IT solutions in their respective areas. The solutions were more strategic in nature to achieve only tactical objectives at the end: a big machinery of IT and business churning out a big catalogue of reporting after a long and complex process. As you may imagine, there were fewer chances for agility or scalability of solutions. To differentiate themselves from competitors, these businesses required a more direct tactical solution, one more responsive to individual business change plans and one that could be adopted more rapidly. More user-friendly tools serving users with little or no IT background were also desired. It was previously the IT specialist’s domain, but now the concept of more potent power users was desired.
Unfortunately, this was not yet the time when completely user-friendly solutions had arrived on the market. Lighter products with less time to production were available by now, but IT teams were still required to develop every bit of them.
With the onset of additional products, it was even possible to have ad hoc querying possibilities and vastly faster calculations on ultrafast new-generation databases like the in-memory–based SAP HANA database.
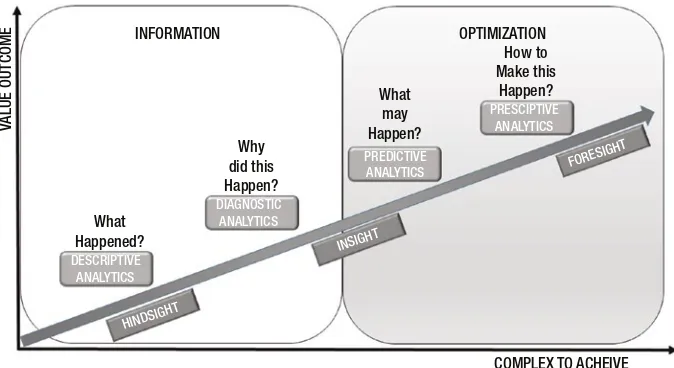
By now, highly agile developments incorporated the latest visualization possibilities, including mobile-based reporting solutions. Ultrapowerful databases had lightning-fast reporting capabilities, at times even without actual ETL. On top of that, social integration and the use of unstructured data at par with structured data filled a good number of the gaps. Cloud was another enabler for further reducing cost and increasing availability. It brought along solutions with SaaS (software-as-a-service), IaaS (infrastructure-as-a-service), and PaaS (platform-as-a-service) kinds of options. So, business intelligence along with the latest and most modern data warehousing capabilities was looked upon as the most possible mature solution. A report connected virtually with multiple OLTP sources would do a million calculations in a few seconds and display, in real time, data sheets or visualizations on a user’s screen. Several high-end analytic capabilities also came up (e.g., predictive analytics, descriptive analytics, diagnostic analytics). Prescriptive analytics has still not been achieved to its fullest. But this is not the last stop. We will discuss this in the next section, “Shifting Paradigm.”
The following are brief descriptions of all four types of analytics:
1. Descriptive Analytics: This is about what has happened. The result set throws details on “what happened” during the timeline in question (e.g., a company considering a certain cost case to analyze where the flab is and how to get rid of that). About 35% of organizations do it frequently. This is coming out of the historical data and thus is considered hindsight. It is the least complex to achieve, as this is mostly data drilled up or down. The value is considered to be the least, as it just helps in finding out “what happened” and nothing beyond.
2. Diagnostic Analytics: This is about “why this happened”; it’s mostly to solve a specific problem. This is assisted by techniques like data drill down, data mining, and analysis of correlations. Approximately 10% of organizations use these techniques, and only half of them do so frequently. Diagnostic analytics is also done mostly using historical data, but it goes beyond the previous in terms of data mining and correlating pattern analysis. It takes the historical data beyond just looking at it as it is and converts it into data points to understand “why this must have happened.” In short, this is insight from the historical data.
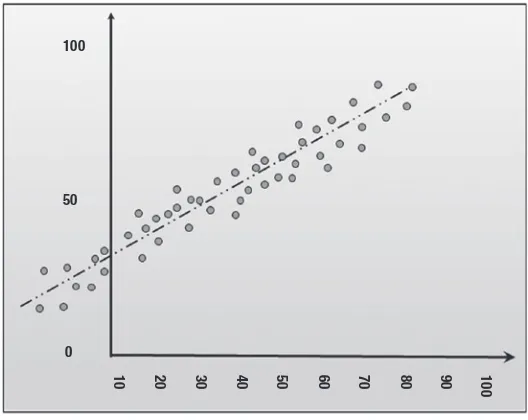
3. Predictive Analytics: This type of analysis shows “what may happen.” It combines contextual data with behavioral data and determines probable future outcomes (e.g., modern CRM and marketing solutions for understanding customer patterns in order to decide which campaign should be addressed to which customer segment). Currently, very few organizations use it frequently, as it is far more complex; on the other hand, it provides great value. It needs some complex mathematical models to predict using an array of data mixed with the operational data of business.
4. Prescriptive Analytics: This goes one step further and proposes “better paths of actions to avoid less good or bad ones.” This is not easily available in mature form now but it is on the verge of getting into that bracket. It includes the use of machine learning and cognition. It’s the most complex of the four and goes beyond to add further technologies to be able to prescribe solutions by thinking about the problem. We will be covering thinking machines in Chapters 7 and 8.
Shifting Paradigm
From the latter half of 2014, business intelligence saw a shifting paradigm; the use case went more toward predictive and prescriptive analytics. Also, the use case of IT has been expanding its scope and its changing role. From being known as supporting business, IT started moving into space as a main driver of innovation (Figure 1-2). IT now impacts business strategies and even plays a role in driving them.
Conventionally, IT has played a role in facilitating the achievement of business goals. They have been the people, right from the 80s information center days, who provided the means to get visibility for required data: picture the back end of business running some expensive projects just because data is invested in so many disparate systems that they are required to consolidate it and then bring out prescribed details “as per business wish.” With technical capabilities and most modern delivery methodologies supported by Agile and Lean, they could do it faster. With the latest technical advances in the area of databases, they could do so in a very lean and mean data model, but the crux remains the same—IT was and is the back end for business. They never had been thought of as contributing to business growth or expansion or reaching out to customers by themselves.
But then, with everything connected to everything (Internet of Things [IoT]), things changed. More and more use of the Internet in a globally connected society started to bring about customer preference patterns on the Web. Social media posts started to become guiding lights and have the capability to crumple products and companies in no time. Word against a product or service spreads like a forest fire. Any organization not geared up to manage this in near real time could face image issues that damage its reputation too much to be able to manage (e.g., how many would have known in the 90s, when the Internet and social media didn’t have as much presence, that any company selling phones with batteries that caught fire would have a global issue, not just a local one?). Even if the impact back then were global, it would have taken time to reach people.
Now, one such event happens somewhere with even just one or two people sitting in two different continents. They post it on social media, and within a matter of hours this is a hot news item. Sales across the world drop to zero in a matter of hours, or people who already bought the product flood the customer care centers. If this is a genuine issue, it will ultimately help the company too, as painful as it may seem at the time, to recall the product for the safety of customers. But what if, instead, some mischief were afoot? Companies should have the capability now to have business intelligence manage this as well.
There are companies now driving their business goal setting completely utilizing IT resources (e.g., computers with human-like thinking and reasoning capabilities, as discussed in detail later in further chapters). There are examples of companies that are driving customer reach and planning expansions in a completely integrated fashion with their IT assets, and so the IT role is now essential for their success. IT resources were a major part of their success stories, running hand in hand with the business plan and even as the main executor. Worth mentioning is Netflix. The decision to put on board and invest even without watching a pilot for the complete TV series House of Cards, a show worth $100 million, was completely an IT-supported decision. Netflix does not depend on media houses to advertise but gains its footprint by internal IT data assets. So, Netflix has a ROI based on member subscriptions rather than on media house–based advertising expenses. It is an example of a company moving toward the optimized IT-driven
organization of the future, which will be very capable of using extensive prescriptive analytics. This is a great example of the paradigm shift in the IT role.
of about 125 million hours of content per day. The viewing pattern and behavior aspects of all its viewers and the likelihood of people watching a series with lead actor Kevin Spacey gave them solid predictions about its success. Not limited to the identification and confirmed prediction of this content, the analytics also divided the viewer base into ten different categories based on behavioral and content preference choices demonstrated, which helped them to promote House of Cards. Based on these analytics, ten different trailers were made to be presented to relevant groups of viewers (e.g., people who prefer watching action more should see the one with more action packed into it, people with a higher choice index for watching Kevin should see the one with maximum exposure of Kevin, and people watching mostly female-centric movies were shown the one suiting their taste). So instead of going to any media house for promotion data acquisition or execution of a promotion plan, Netflix took a decision based on user data and promoted back exactly based on their user preference. This is a good example of the changing paradigm of IT. Instead of just back-end data processing, ETL, and presenting to business, IT in this example is a great enabler of business for Netflix. They have a data-driven, and thus IT-driven, business model. The business expansion and product expansion details are taken very well considering the scope of business and with utilizing user data, and even promotions are handled that way. Before this, Netflix didn’t utilize this aspect of the IT-business connection. Before 2002, Netflix had only suggestions running based on the geography of users.
By understanding user viewing patterns and other facts exposed via its vast big data collection, Netflix tries to push a new Netflix site visitor towards a subscription in 60 to 90 seconds. This particular time frame is important, since if an individual does not settle down in this interval to watch something he or she finds interesting or relevant, they might abandon the web site or if already a viewer may even plan to cancel their subscription. Even the videos uploaded on its Amazon AWS cloud servers have been watched and tagged into over 80,000 types of microgenres to be able to map to individual user preference across the globe.
Netflix also manages something called the continuous watch aspect. If a user does not watch about twenty minutes of content per session it is found that there is a high chance that he will abandon the subscription.
So, the Netflix use case is one example of how a company is leveraging IT as a business enabler for its organic growth and sustainability. This is the start of an era where the equation of the IT-business relationship is changing from one of consumer and supplier to one of partners in success. The Internet and various facets thereof like social media are changing the way a product or service life cycle is managed. More and more customer service-centric approaches have changed the way businesses must operate.
Social media has a multidimensional impact on the businesses. Some of these are detailed in the following sections.
Customer Relationship Management
Word-of-mouth praise is good. It might take a thousand words of praise to get a good reputation with even just one or two customers. But it takes just one bad word to shatter this all. This has been never so impactful as now, and the reason is social media. One bad word in social media could go spiraling up and down to millions, maybe billions, of people in just a few hours. So, this needs to be tracked in real time. If we just talk about Facebook, there are about 1.7 billion monthly active users (MAU). There is about a 15% MAU increase expected each year. About 4.5 billion likes are generated per day (in 2013), about 10 million web sites are affected by Facebook likes or shares per day (in 2014), and 42% of marketers reported the critical importance of Facebook for their business (source: State of Inbound Marketing 2012). Other social media platforms also have big numbers, and the grand total of all these together is huge. On top of that, there are feedback web sites. So, there has been a tremendous effort from organizations to capture these, and moreover in real time.
User being able to watch preferred content, based on Geography, personal
preference etc.
Business Intelligence Layer Learning+Machine
Assumed High Level Landscape plan. Not Real.
Preferred Content Suggestion Video-video similarity or Because you watched Geography server & content match
Content Metadata Video Snapshot Analysis Other User Data
Apart from this, the technology now allows outreach to individual customers and customized benefits and services for them. Say, a grocery chain customer in a subgeography might have expected a reasonable season promotion offer for the community there, which was the maximum possibility until recently. But with technologies available, it is very much possible to provide promotions customized or personalized for that individual customer. This may seem to have no direct relation to social media impact, but individual-level personalized promotions tend to help with damage control and can happen on the same channel.
Market Research Analysis
Netflix again is one of very strong example of this. Social media and all means of digital media should be ears for organizations. This brings in much valuable information about culture, preferences, reactions, lifestyle, age and gender mix, and feedback about self and competitors for the desired customer base. This is like reaching in a billion copies individually to each customer individually and noting their properties and preferences, which obviously can help in establishing best-in-breed surgically targeted marketing campaigns.
Loyalty Management
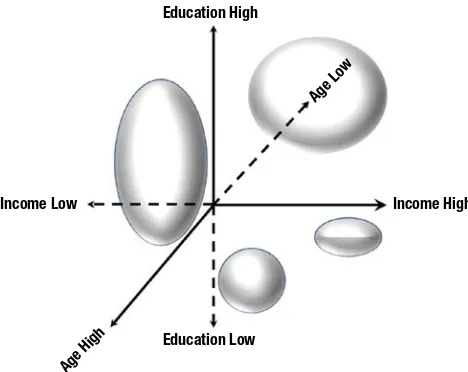
Customer loyalty management means plugging holes in the ship. Every business desires a heavier loyalty-based customer base. The target group of consumers registered as “loyal” do double duty: they bring in a fixed source of business, and they also spread good word-of-mouth to people around these customers. As a controlled group, these customers are also invited for new releases to get their first-cut feedback on whether a product is good enough to go further to target new audiences. Happy customers and their stories are considered trusted examples by prospective customers. An organization should ensure a healthy number of loyal registered customers equally in all categories of desired audiences. This will again in turn help them to reach out to further prospective customers with relevant examples; for example, a prospective customer in a low-income group would like to see and analyze a story which is relevant to his income level to gauge the benefits for him or her. He or she might consider the product or service too expensive if shown examples drawn from a story of a billionaire from the same state. Some people argue to keep the success stories free from social or financial grades. The reality is that this might work well in some cases, but a story from a similar grade always has more impact. Perhaps this kind of targeting was more difficult earlier with paper and billboard campaigns, but with technology for personalization it is very much possible. Research says that most people who tend to stick with a brand on social media even convert into businesses with that brand.
Product Release
The details about the prospective customer base provide exactly what needs to be released in a given geography. This increases the success rate of the released product.