i THESIS
BY
RUSMAYA NURLINDA
STATE ISLAMIC INSTITUTE OF PALANGKA RAYA FACULTY OF TEACHER TRAINING AND EDUCATION
DEPARTMENT OF LANGUAGE EDUCATION STUDY PROGRAM OF ENGLISH EDUCATION
ENGLISH STUDENTS’ PERCEPTION ON THE DIFFICULTIES IN ORAL PRESENTATION AS A FORM OF SPEAKING SKILL
ASSESSMENT AT IAIN PALANGKA RAYA
THESIS
Presented to
State Islamic Institute of Palangka Raya In partial fulfillment of the requirements
For the degree of Sarjana in English Language Education
BY
RUSMAYA NURLINDA NIM 1301120891
STATE ISLAMIC INSTITUTE OF PALANGKA RAYA FACULTY OF TEACHER TRAINING AND EDUCATION
DEPARTMENT OF LANGUAGE EDUCATION STUDY PROGRAM OF ENGLISH EDUCATION
MOTTO AND DEDICATION
Successful people Never Stop Learning
This Thesis is dedicated to:
My beloved Father Berlin and Alm. Mother Normawati for their valuable endless prayer, sacrifice, and support. My beloved sister Erlinae Hartatie and My beloved friends for their support.
ABSTRACT
Nurlinda, R. 2017.English Students’ Perception of the Difficulties in Oral PresentattionAs A Form of Speaking Skill Assessment at IAIN Palangka Raya. Thesis, Department of Language Education, Faculty of Teacher Training and Education, State Islamic Institute of Palangka Raya. Advisors: (I) M. Zaini Miftah, M.Pd., (II) Aris Sugianto, M.Pd.
Key words: perception, oral presentation, speaking skill
This study was aimed at investigating English students‟ perception of the the difficulties in oral presentation as a form of speaking skill assessment at IAIN Palangka Raya. One research questions were formulated in this study. (1) How is the English students‟ perception on the difficulties in oral presentation as a form of speaking skill assessment at IAIN Palangka Raya.
This study used descriptive quantitative.The population of this research
from English Department Students‟ academic year 2014//2015, 2015/2016, and 2016/2017 which consisted 214 students and 107 students were taken as the sample to fill questionnaire questions.
This research belonged to survey research. The technique of collecting the data questionnaire. In analyzing the data, some procedure were used such as compiling data, and displaying data.
The results showed that most of the students agreed with items that asked about the difficulties in oral presentation as a form of speaking skill assessment at IAIN Palangka Raya, it could be seen from the score of Mode showed 4 frequently appeared or in the chart was red color, and also the median stated the same as Mode namely 4. Thus, the students given positive responsed to the difficulties in oral presentation as a form of speaking skill assessment at IAIN Palangka Raya.
ABSTRAK
Nurlinda, R. 2017.Persepsi Siswa terhadap kesulitan dalam presentasi lisan Sebagai bentuk penilaian kemampuan berbicara di IAIN Palangka Raya. Skripsi, Jurusan Pendidikan bahasa, Fakultas Tarbiyah dan Ilmu Keguruan, Institut Agama Islam Negeri Palangka Raya. Pembimbing: (1) M. Zaini Miftah, M.Pd., (II) Aris Sugianto, M.Pd.
Kata Kunci: persepsi, presentasi lisan, kemampuan berbicara
Penelitian ini bertujuan untuk menginvestigasi persepsi siswa terhadap kesulitan dalam presentasi lisan sebagai sebuah bentuk penilaian kemampuan berbicara di IAIN Palangka Raya. Dalam penelitian ini merumuskan satu pertanyaan. (1) Bagaimana persepsi siswa terhadap kesulitan dalam presentasi lisan sebagai bentuk penilaian kemampuan berbicara di IAIN Palangka Raya.
Dalam penelitian ini menggunakan kuantitatif deskriptive. Populasi dalam penelitian ini adalah mahasiswa jurusan Bahasa Inggris dari 2014//2015, 2015/2016, dan 2016/2017 dengan jumlah 214 mahasiswa dan 107 mahasiswa diambil untuk menjawab angket pertanyaan.
Hasil menunjukkan bahwa banyak siswa setuju dengan soal tentang kesulitan dalam presentasi lisan sebagai sebuah bentuk penilaian kemamuan berbicara di IAIN Palangka Raya, itu terlihat dari nilai yang sering muncul (modus) yaitu 4, atau dalam grafik menunjukkan warna merah, dan juga median menunjukkan nilai yang sama seperti modus 4. Dengan demikian siswa-siswa memberikan tanggapan positif untuk kesiulitan dalam presentasi lisan sebagai sebuah bentuk penilaian kemamuan berbicara di IAIN Palangka Raya
ACKNOWLEDGEMENTS
The writer would like to express her sincere gratitude to Allah SWT., for the blessing bestowed in her whole life particularly during the thesis writing without which this thesis would not have come to its final form. Sholawat and salam always be bestowed to the last prophet Muhammad SAW., having shown us the role of life to make our life true.
Her appreciation is addressed to:
1. Dean of Faculty of Teacher Training and Education of the State Islamic Institute of Palangka Raya, Drs. Fahmi, M.Pd., for his invaluable assistance both in academic and administrative matters.
2. Vice Dean in Academic Affairs, Drs. Hj. Raudhatul Jennah,M.Pd., for her invaluable assistance both in academic and administrative matters.
3. Chair of Department of Language Education, Santi Erliana,M.Pd., for her invaluable assistance both in academic and administrative matters.
4. Chair of Study Program of English Education, M. Zaini Miftah, M.Pd., for his invaluable assistance both in academic and administrative matters. 5. Her thesis advisors, M. Zaini Miftah, M.Pd, and Aris Sugianto, M.Pd for
their generous advice, valuable guidance and elaborate correction during their busy time to the completion of her thesis.
6. Both the members of the board of examiners, for their corrections, comments and suggestions which are profitable to the accomplishing of this thesis.
7. All lecturers of Study Program of English Education from whom she got in-dept knowledge of English and English teaching.
8. Her classmates of Study Program of English Education, especially the 2013 period, for the support in sadness and happiness during the study in undergraduate program and for their spirits to accomplish my study
9. Her beloved parents, Berlin and Alm. Normawati, and her beloved sister, Erlinae Hartatie for their moral support and endless prayer so that she is able to finish her study. May Allah SWT bless them all. Amin.
Palangka Raya, 25 October 2017 The writer,
Rusmaya Nurlinda NIM 1301120891
TABLE OF CONTENT
COVER ... i
COVER (Second Page) ... ii
ADVISOR APPROVAL ... iii
THESIS APPROVAL ... iv
MOTTO AND DEDICATION ... v
DECLARATION OF AUTHORSHIP ... vi
ABSTRACT ... vii
ABSTRAK ... ... viii
ACKNOWLEDGEMENTS ... ix
TABLE OF CONTENT ... xi
LIST OF TABLE ... xiii
LIST OF FIGURES... xvi
LIST OF APPENDICES... xvii
LIST OF ABBREVIATION ... xviii
1. Definition of Perception ... 7
2. Process of Students Perception ... 9
C. Oral Presentation ... 9
1. Definition of Teacher Feedback ... 9
2. Types of Oral Presentation ... 11
1) Controlled Oral Presentation... 11
2) Guide Oral Presentation... 12
3) Free Oral Presentation... 12
3. Principle for Delivering Effective Presentation... 13
4. Advantage of Oral presentation ... 19
D. Speaking ... 20
1. The Nature of Speaking ... 20
2. Types of Speaking ... 21
3. Speaking Skills... 24
4. Sub Skills of Speaking... 24
5. Speaking Assessment ... 26
E. Problem in Speaking ... 26
CHAPTER III RESEARCH METHOD ... 28
A. Research Design ... 28
B. Population and Sample ... 28
C. Research Instruments ... 30
1. Research Instrument Development... 30
2. Instrument Try Out... 32
3. Instrument Validity... 33
4. Instrument Reliability... 35
D. Data Collection Procedures ... 36
E. Data Analysis Procedure ... 38
CHAPTER IV RESEARCH FINDINGS AND DISCUSSION ... 44
A. Data Presentation ... 44
B. Research Findings ... 48
C. Discussion ... 67
CHAPTER V CONCLUSION AND SUGGESTION ... 80
A. Conclusion ... 80
B. Suggestion ... 80 REFERENCES
APPENDICES
LIST OF TABLES
Table Page
3.1 Population of theResearch ... 29
3.2 Sample of the research... 30
3.3 The instrument and data needed... 30
3.4 Interpretation of the difficulties in oral presentation... 32
3.5 Item specification of questionnaire... 32
3.6 Result of reliable... ... 36
3.7 Item total statistic... ... 36
4.1 Results of the Questionnaire... 44
4.2 The calculation of Mean of students‟ perception (item 1)... 49
4.3 The Calculation of Deviation Score and Standard Deviation of Students‟ Perception (Item 1)... 50
4.4 Results of analysis of survey item_1... 50
4.5 Results of analysis of survey Item_2... 51
4.6 Results of analysis of survey Item_3... 51
4.7 Results of analysis of survey Item_4... 51
4.9 Results of analysis of survey Item_6... 53
4.10 Results of analysis of survey Item_7... 53
4.11 Results of analysis of survey Item_8... 54
4.12 Results of analysis of survey Item_9... 54
4.13 Results of analysis of survey Item_10... 55
4.14 Results of analysis of survey Item_11... 55
4.15 Results of analysis of survey Item_12... 56
4.16 Results of analysis of survey Item_13... 56
4.17 Results of analysis of survey Item_14... 57
4.18 Results of analysis of survey Item_15... 57
4.19 Results of analysis of survey Item_16... 58
4.20 Results of analysis of survey Item_17... 58
4.21 Results of analysis of survey Item_18... 59
4.22 Results of analysis of survey Item_19... 59
4.23 Results of analysis of survey Item_20... 60
4.24 Results of analysis of survey Item_21... 60
4.25 Results of analysis of survey Item_22... 61
4.26 Results of analysis of survey Item_23... 61
4.27 Results of analysis of survey Item_24... 62
4.28 Results of analysis of survey Item_25... 62
4.30 Results of analysis of survey Item_27... 63
4.31 Results of analysis of survey Item_28... 64
4.32 Results of analysis of survey Item_29... 64
4.33 Results of analysis of survey Item_30... 65
4. 34 Results of analysis of survey Item_31... 65
4. 35 Results of analysis of survey Item_32... 66
4.36 Personal Traits... 68
4.37 Presentation skills... 72
4.38 Audience and instructor... 76
LIST OF FIGURES
table Page
4.1Chart of Students‟ Perception on the Difficulties in Oral Presentation as a form of speaking skill assessment at IAIN Palangka Raya... 67
LIST OF APPENDICES
Appendix Page
1. Research Schedule ... 83 2. Questionnaires ... 85 3. Research Decrees (Surat Izin Penelitian dan Surat Pernyataan
telah Mengadakan Penelitian) ... 95 4. Photo of Research ... 96 5. Curriculum Vitae ... 98
xvi IAIN : Institut Agama Islam Negeri
1
problem, an objective of the study, scope and limitation, significance of the study, definition of a key term.
A.Background of the study
Yahay and Kheirzadeh (2015, p. 114) state speaking is a productive necessary skill to communicate effectively in any language, especially when speakers are not using their native language. Language learners often think the ability to speak a language is the product of language learning; however, this skill is also an important part of the language learning process.
In this research the researcher saw some English students‟ at IAIN
Palangka Raya seldom practice to speak English Foreign Language outside class, seldom speak English in a classroom and often use mother language with their friends in the class except when they use oral presentation. The oral presentation is one of all process develop the speaking skill, for example, given and received information between presenter and audiences so that can develop communication skill. When their presentation they can interact and speak naturally with their own word to make audience understands about the topic.
appropriately. Richards applies Jones and Burns‟ proposal to categorize
speech activities into three main division: talk as interaction, talk as the transaction, and talk as performance. Talk as interaction, in his definition, is
what normally means a „conversation‟, which describes interactions with a
social function; Talk as transaction is defined as a situation in which the focus is on what is said or done; and Talk as performance is defined as a public talk, i.e., talk that gives information to audience, which is made of a recognizable format and is similar to written language rather than conversational language.
Second, based on Fallows & Steven cited by (zivkovic, 2014, p. 468) that "Today's challenging economic situation means that it is no longer sufficient for a new graduate to have knowledge of an academic subject; it is necessary for students to gain those skills which will enhance their prospects of employment" .Employability skills include the following abilities: the retrieval and handling of information; communication and presentation; planning and problem solving; and social development and interaction, creative thinking, problem-solving critical thinking, active and reflective application of knowledge. These are the skills students need to succeed in their future workplace so, they should be embedded within the academic curriculum.
experience both for teachers in developing facilitating skills and for students
in training themselves to have confident presentations in public‟.
Use of oral presentations in EFL classroom is important because of positive effect for students' proficiency level. Some students seldom speak English in the classroom and they do not speak outside class with their friends. So if student do not practice English in the classroom, may they never do speak. Oral presentation activities provide an excellent opportunity for the learners to develop this skill, speaking several minutes in a structured way, delivering into various aspects of a single topic (Nadia, 2013, p. 2).
There is many research about the important of the oral presentation to
increase students‟ speaking skill, but in this research the researcher focus on
students‟ perception on the difficulties in oral presentation as a form of
speaking skill assessment at IAIN Palangka Raya. B. Research Problem
How is the English students' on the difficulties in oral presentation as a form of speaking skill assessment at IAIN Palangka Raya?
C. Objective of the Study
To known perspectives English students' on the difficulties in oral presentation as a form of speaking skill assessment at English Education Study Program of IAIN Palangka Raya.
D. Scope and Limitation
Therefore this study will focus on the students'perception on the difficulties in oral presentation as a form of speaking skill assessment at IAIN Palangka Raya in English education study program.
E. Significance of the Study
Numerous researchers have shown the benefits of using oral presentations in the classroom. One of another benefits oral presentations provides a more authentic way of practicing English than simple speaking drills. This is important because speaking tasks that have no relation to real-life language use" are poor preparation for autonomy" (Thornbury, 2005, p. 91). Presentations require students to use their L2 in a natural way because they are required to use English to understand the topics they are presenting and communicate this understanding to others. This is closer to real language use and gives students an opportunity to develop research and critical thinking skills, as well as linguistic and communicative skills (Wilson, 2014, p. 523 ). F. Definition of Key Term
There is some definition of key terms in this research that namely :
2. Oral Presentation: oral presentation is like a formal conversation, speaking to group as a natural. activity. Most of people spending hours of their daytime, speaking to others, however making an oral presentation that is a formal conversation , it is difficult task for them. Oral presentation is part of spoken language. The purpose of this practice is to communication (Baker, 2000, p. 115). In this study, oral presentation means practice speech of formal conversation.
6
In this chapter, the writer describes related studies, perception, oral presentation and speaking.
A. Related Studies
In this study, there are some related studies, which conduct in this study, the researcher related studies. First, Yahay and Kheirzadeh (2015, p. 114) the outcome of both analyses showed that oral presentation can improve accuracy and fluency in speaking ability of students and the effect size in both measures were large. In addition, the comparison between findings of accuracy and fluency measurement and outcome of observation checklists yielded the same result; both of which verified students' speaking improvement.
Second, Nowreyah A. Al-Nouh, Muneera M. Abdul-Kareem and Hanan A. Taqi(201, p. 136) results showed students‟ perceptions of the difficulties they experienced at a medium level (M=3.10). However, significant differences in the
results were found when students‟ nationalities and GPAs were taken into
account.
Third, Rajoo ( 2010, p. 43 ) in this paper, some of the problems faced by the students have been elected and some solutions are suggested in order to assist them to deliver better oral presentations.
frame markers to organize the academic speech, and how these markers may facilitate direct connection with listening EFL audience.
Fifth, Dekdouk (2013, p. 54) the results show that linguistic competence, discourse competence, strategic competence, pragmatic competence, and fluency could be enhanced to a large extent through giving classroom OPs in English.
Sixth, Alahem (2013, p. 95) the researcher had noticed that most teachers have a positive attitude towards oral presentations and they think it is a great technique and activity that helps students practice speaking, and they agree on the benefits of using this an more and more and in different TEFL courses at our department.
Seventh, Nadia (2013, p. 89) Research results show that doing an oral presentation is an effective activity and students have positive attitudes towards using it as a learning activity.
In this research, the researcher choose different research from previous studies, because the researcher title is English students perception on the difficulties in oral presentation as a form of speaking skill assessment at IAIN Palangka Raya
B. Perception
1. Definition of Perception
whom they are familiar in everyday life. Eggen and Kauchak gave the cognitive dimension of perception; they see perception as the process by which people attach meaning to experiences. They explained that after people attend to certain stimuli in their sensory memories, processing continues with perception is critical because it influences the information that enters working memory. Background knowledge in the form of schemas affects perception and sub sequents learning. Research findings have corroborated this claim that background knowledge resulting from experience strongly influence perception.
The relatedness of this view of perception to the present study is further explained, that every impression that comes inform without, be it a sentence, which we hear, an objector vision, no sooner enters our consciousness than it is drafted off in some determinate directions or others, making connection with other materials already there and finally producing what we call your reaction. From this, it is clear that perception is the reaction elicited when an impression is perceived from without after making the connection with other materials in the consciousness ( memory ). From this point of view, two implications could be deduced. Firstly, perception cannot be done in the vacuum, it depends on some background information that will trigger a reaction.
Noerjennah (2011, p. 33) perception describes one‟s ultimate
input information and experiences that exist and then interpret them to create a whole picture that matters. Perception, on the other hand, is a process of justice or organize the whole picture of the world. Every people have different perception on the same thing. It because of the factors of the people knowing of the world and his feeling of that.
Perception may be energized by both the present and past experience, the individual attitude at a particular moment, the physical state of the sense organ, the interest of the person, the level of attention, and the interpretation given to the perception.
2. Process of Students’ Perception
According to stimulus-response theory of perception is part of the overall process that generates a response after the stimulus is applied to humans and the other is the introduction of psychological there are sub-processes, feeling, and reasoning (Sobur, 2009, p. 447).
As the statement above that, the perception describes one's ultimate experience of the world and typically involves further processing of sensory input. In addition, the perception is a process of how people interpret input information and experience that exist and then interpret them to create a whole picture that matters.
C. Oral Presentation
1. Definition of Oral Presentation
to Baker (2000, p. 115), the oral presentation is like a formal conversation, speaking to the group as a natural activity. Most of the people spending hours of their daytime, speaking to others, however making an oral presentation that is a formal conversation, it is the difficult task for them. The oral presentation is part of spoken language. The oral presentation is part of spoken language. The purpose of this practice is to communicate. It is design to inform or persuade. Oral presentation occurs in the organizational setting and with limitation in time. The presentation should be structured carefully. In addition, the speakers can support their talk with visual aids.
Melion and Thompson (1980, p. 115) state that oral presentation is guided and organized, it will give the students a learning experience and teach them an important skill which will be beneficial to ESL/EFL in all their education subject and later in their work.
Joughin adds that we can look at oral presentation from three perspectives: presentation as a transmission of the ideas of others to a passive audience with anxiety at a low level, presentation as an imparting of the material studied from which students seek to make their own meanings from the ideas of others; and presentation as a position to be disputed and defended by persuading the audience
2. Types of Oral Presentation
Fatma Dekdouk (2013, p. 7 ), an oral presentation can be prepared in different ways: Individually, in pairs or in groups of students. This depends on the size of the classroom, the topic and the objective of the course. Three type of oral presentations :
1) Controlled Oral Presentation
A controlled oral presentation is used with students whose language proficiency level from beginners to elementary in which the teacher assigns topics related to the textbook or whatever she/he can see that can be presented with ease by his or her learners. Moreover, the choice of grammar and vocabulary and the time of the presentation should be related to students' level of proficiency. Additionally, with this type of Ops, simple tools accompany the oral presentation are used such as the presenters may prepare the paper to read.
maximize meaningful participation in the classroom, and to develop the target language in the classroom.
2) Guided Oral Presentation
This type arranges with lower-intermediate or intermediate students' language proficiency level. Moreover, those students should not analyze toward sophisticated, but to an appropriate use of grammar and lexical items and time allocation.
Powerpoint and overhead projector (OHP) slides are tools that are much more used with this type of OPS. In addition, students are expected to prepare handout to the listeners in the classroom to follow.
3) Free Oral Presentation
3. Principle for Delivering Effective Presentation
Chivers andShoolbred (2007, p. 20), Important Characteristic of effective presentations:
1. Careful planning and preparation
Good preparation and planning are essential for successful presentations. a ten-step plan that below.
1) Read and re-read the briefing details for the presentation. 2) Create a task list or mind map.
3) Create a time chart.
4) Review your existing knowledge of the topic. 5) Research and read to gain new knowledge. 6) Decide on the balance of the content. 7) Find relevant examples.
8) Identify your audience.
9) Create the content, visual aids and documentation. 10) Rehearse the presentation.
2. Good time management
Chivers and Shoolbred (2007, p. 21), Good time management is important in two quite different ways: in the planning and preparation stages and time allocated for delivering the presentation. 1) Planning and preparation stages
presentation. Second, placing these the in an order of priority. Third, allocating the time needed to complete each of these tasks. Fourth, check your progress regularly. In the end, reallocating the remaining time to make sure that you complete all of the characteristics.
Time will probably be needed for reading to increase your understanding of the topic.
2) Time allocated for delivering the presentation
In most presentations, it is usually better to deliver less content at a reasonable pace, than too much an at a faster pace that may leave the audience feeling overwhelmed and confused. How you use the time during the presentation will be influenced by how much content you intend to cover, the structure of this content and the amount of audience participation expected.
Allocating and managing the performance time can be even more of a problem for a group presentation. In some situations where several group presentations will be given in a fixed amount of time, the tutor may stop the presentation when the allotted time has been used, regardless of how much of the presentation has been delivered. 3. Relevant and interesting content
make sure that it is relevant, accurate and interesting to the audience. It uses introduction to outline the reasons for the choice of content and the emphasis on the presentation. If you have enough time, it could also be useful to explain very briefly how other content was considered and why it was rejected.
Second, Choose examples to provide interest and improve understanding. At the start of a presentation to use examples how to improve your own understanding of the topic. Examples helped your own understanding, this will probably be the same for the audience that the audience will already understand. This helps them to review their existing knowledge.
Third, Provide links to further sources of information. It is usually helpful to provide links to useful sources of information that audience members can follow up in their own time. These sources could relate to content that have not been able to include but can be used for further reading and knowledge development. 4. Clear structure
then draw the presentation to a conclusion, perhaps by reviewing the themes covered, summarizing results or emphasizing the most important points or future issues and concerns.
5. Good communication skills
Chivers and Shoolbred (2007, p. 28 ), for communication to be effective, the content needs to be clearly understood, meaningful and interesting to the audience. Effective communication in presentations needs a combination of speaker that fits the purpose, and good presentation and communication skills. There are many influences on how well we communicate and on how well we are understood by our audience.
6. Appropriate use of technologies
Chivers and Shoolbred (2007, p. 28 ), use the term
„technologies' in a generic way. It could mean a medical aid such
as a dummy in a first aid presentation, a specialist piece of equipment such as sewing machine or food blender or the widely used Microsoft PowerPoint.
2. The technology should improve what you have to communicate so that the audience gains a better understanding of your content. However, it may be that the topic will not be improved by the software that has to be used.
3. Rehearse using the technology, especially if it is an essential part of demonstrating your skills in the presentation. You will need to feel confident in how you use it.
4. Have a backup system in case it fails. We have seen situations where the technology failed but the presentation was still effective because the presenter had made copies of notes and screenshots that he then worked through with the audience. If you have rehearsed your presentation well, this type of experience will be less of a problem
7. Clear supporting documentation
out before the presentation so that the audience can use them to make their own notes, or will this approach distract their attention from the presenter or visuals on a screen? It is helpful at the start of the presentation to explain how you have decided to deal with the handouts and the level of note taking that will be needed audience members. In some situations it may be more helpful and enjoyable to concentrate on the audio and visual content rather than trying to make notes for future recall.
8. Suitable audience participation
Chivers and Shoolbred (2007, p. 29), some will be expected to involve the audience in activities or discussion at certain times within the presentation. Others will be more formal, having no interaction at all or requiring questions and answers only at the end of the presentation. Inevitably, the purpose of the presentation will influence the amount of audience participation but interesting participation can be a worthwhile experience for all concerned. Creative ideas can stimulate discussion and extend understanding.
aims and objectives, be enjoyable and offer developmental opportunities for the presenters and the audiences.
4.Advantages of Oral Presentation
The benefits of student presentations will be influenced by the situation but they can be summarized as providing opportunities for student-centred participation in their learning, developing new knowledge and different perspectives on a topic, Practice in a known environment/situation, Increasing confidence to speak and present in front of an audience, improving marks earned for a module assessment, developing a wide range of communication and presentation skills, preparation for skills needed in the workplace, and an exchange of roles and perspectives from audience to presenter.
According to Meloni and Thompson, if oral presentation been guided and structured, it will be beneficial to ESL/EFL in all there learning the subject and later in their work. Students need more practice in English before they graduate. Chivers and Shoolbred claim, "There are many reasons why students are asked to give the presentation and these will be influenced by their academic course and situational and organizational factors" So, one of the purposes of doing an oral presentation is to give an information with a formal way.
D. Speaking
1. The Nature of Speaking
According to Oxford Advanced Learner Dictionary, Speak is defined: as to say words; to talk or say something about something; to say or state something; to know and be able to use a language (Hornby, 2002, p. 1140). So, speaking skill of the speaker to communicate and share information.
Speaking has different types. According to Bygate, an oral interaction can be characterized in terms of routines, which are conventional ways of presenting information which can either focus on information structures, being either be expository (e.g. narration, description, instruction, comparison) or evaluative (e.g. explanation, justification, prediction, decision). Interaction routines can be either service (e.g. a job interview) or social (e.g. a dinner party). This distinction between the transactional and interactional (or interpersonal). The Bygate States that a further feature of oral interaction is that the participants need constantly to negotiate meaning, and generally manage the interaction in terms of who is to say what, to whom, when, and about what (David Nunan, 1995, p. 17).
everyone who involved of the speech, such as speaker, listener, and so on; E (End: purpose and goal), refers to purpose and goal of conveying an idea or thought orally; an (Act sequence), refers to the content of speech such as words used; K (Key), refers to intonation, manner, and pronunciations when conveying speech; I (Instrumentalities), refers to the kind of language use, such as written or oral; N (Norm of interaction and interpretation), refer to the norm and roles of social interaction, such as how to ask opinion, and so on; G (Genre), refers to the form of conveying speech, such as narration, proverb, and poem (Agustina, 2004, p. 48-49). 2. Types of Speaking Performance
a) Imitative
At one end of the continuum of a type of speaking performance is the ability to simply parrot back (imitate) a word or phrase or possibly a sentence. While this is a purely phonetic level of oral production, a number of prosodic, lexical, and grammatical properties of language may be included in the criterion performance (Panitia Sertifikasi Guru rayon XII, 2008, p. 6). b) Intensive
speaker must beware of semantic properties in order to be able to respond, but interaction with an interlocutor or test administrator is minimal at best. Examples of intensive assessment task include directed responses tasks including simple sequences; translation up to simple sentence level (Panitia Sertifikasi Guru rayon XII, 2008, p. 6).
c) Responsive
Responsive assessment tasks include interaction and test comprehension but at the somewhat limited level of very short conversations, standard greetings and small talk, simple requests and comments, and the like. The stimulus is almost always spoken prompt (in order to preserve authenticity), with perhaps is only one or two follow-up questions or retorts:
A.Mary: Excuse me, do you have the time? Dough: Yeah Nine-fifteen.
B. Tim: What is the most urgent environmental problem today Sheila: I would say massive deforestation.
d) Interactive
The difference between responsive and interactive speaking is the length and complexity of the interaction, which sometimes includes multiple exchanges and/or multiple participants. Interaction can take the two forms of transactional language which has the purpose of exchanging specific information, or interpersonal, exchanges, which have the purpose of maintaining social relationships. (In the three dialogues cited above, A and B were transactional, and C was interpersonal.) In interpersonal exchanges, oral production can become pragmatically complex with the need to speak in a casual register and use colloquial language, ellipsis, slang, humor, and other sociolinguistic conversations.
e) Extensive (monologue)
3. Speaking Skills
According to Bygate cited by Nevaril ( 2014, p. 14) divides speaking skills into motor-perceptive and interactive. The first one is a context-free kind of skill which involves perceiving, recalling and articulation, in other words choosing the correct word forms and meanings and putting them into the correct order and sounds. Exercises practising motor-perceptive skills would be e.g. model dialogues, pattern practice, drills. On the other hand, interaction skills are those which enable learners to transfer classroom motor-perceptive skills to real-life use of the skill, transfer knowledge to a real language using situation. Practice of such skills would include e.g. making decisions, what and how to say something. Interaction skills must cope with the pressure of time as well as reciprocity conditions, which means to adjust reacting to the listener, which of course requires to be flexible in communication
4. Sub Skills of Speaking
According to Ken Lackman ( 2010, p. 3 ) speaking Sub-skills : 1) Fluency
Students practice speaking with a logical flow without planning or rehearsing
2) Accuracy with Words & Pronunciation
3) Using Functions
Students use specific phrases for purposes like giving advice, apologizing, etc
4) Appropriately
Students practice using language appropriate for a situation and making decisions about formality and choice of grammar or vocabulary.
5) Turn-taking Skills
Students practice ways of interjecting, eliciting an interjection or preventing one.
6) Relevant Length
Students practice speaking at a length appropriate to a situation 7) Responding and Initiating
Students practice managing a conversation by making responses, asking for a response or introducing a new topic or idea.
8) Repair and Repetition
Students practice repeating or rephrasing parts of a conversation when they suspect that what was not
understood
9) Range of Words and Grammar
10)Discourse Markers
Students practice using words/phrases which organize a talk (e.g. firstly, secondly, on the other hand, to summarize).
5. Speaking Assessment
Abadi ( 2015, p. 133 ) English has become an obligatory subject in several levels of education, from junior school level up to university level in Indonesia. The goal of teaching English is to provide assessment for students to apply the language in the different context of communication.
E. Problems in Speaking
According to Rababah ( 2005 ), a major challenge of Foreign Language
(FL) instruction is to develop learners‟ oral communication skills, because the
primary goal of language teaching is the production of qualified teachers of the target language. Unfortunately, university and, students, in general, face communication problems, specifically oral issues.
Based on (2010, p. 45-46 ) problems and difficulties have been placed under four different constructs. Among the students' most common problems and agreed were:
1. Language / Grammar / Vocabulary ( Cannot speak well in English, Making grammatical errors, Wrong sentence structures, Wrong pronunciation and Lack of vocabulary ).
examples, Tendency to read, I feel blurred during presentation, Afraid my points are not true )
3. Personality traits ( Nervousness / Feeling uneasy when standing alone in front, Cannot remember the points / Can, not memories, Lack of confidence, Seldom speak in front of the class / Lack of experience, I‟m a shy person, My voice is soft, I talk too fast, Fear of getting low marks ) 4. External factors ( Lack of time to present all my points, Afraid of criticism
28
This chapter explains research design, population, and sample, research instrument, data collection procedure, data analysis procedure.
A. Research Design
This research design is the survey that belongs to quantitative research. It is categorized as descriptive research. According to Norjenah cited by Fuad (2014, p. 25), descriptive research involves collecting data in order to test hypotheses or answer question relates to the current status of the object of the study. A descriptive study determines and reports the thing. It means that descriptive study, the research happened naturally, and the research has no control over the condition and the situation, and could only measure what already exists.
The quantitative approach to the study of social and behavioral phenomena holds that the aim and methods of the social sciences are, at least in principle, the same as the aim and methods of the natural or physical sciences. Quantitative research more typically relies on measurement tools such as scales, tests, observation checklists, and questionnaires (Ary, 2010, p. 420)
B. Population and Sample
1. Population
of any well-defined class of people, events, or objects. Zoltan (2010, p. 60) claims that a population is a group of people whom the survey is about. For example, in a study in which students in American high schools constitute the population of interest, you could define this population as all boys and girls attending high school in the United States.
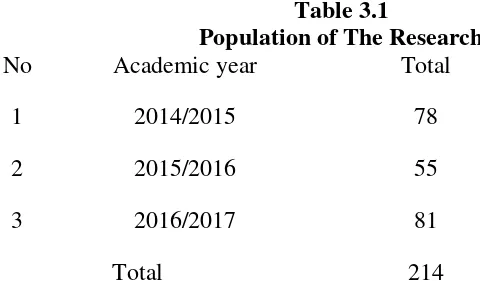
Table 3.1
Population of The Research
No Academic year Total
1 2014/2015 78
2 2015/2016 55
3 2016/2017 81
Total 214
Source: English Department Document
2. Sample
In this research, the write collected data from English students who classified in the academic year 2014/2015, 2015/2016 and 2016/2017. The researcher will only focus in the oral presentation. In this research, the researcher collects the data based on the result of questionnaire.
The researcher used random Sampling. The basic characteristic of simple random sampling is that all members of the population have an
equal and independent chance of being included in the random sample.
The steps in simple random sampling comprise the following:
1. Define the population.
3. Select the sample by employing procedure where sheer chance determines which members on the list are drawn from the sample (
Donald Ary, 2006: 150).
Zoltan states that the multivariate statistical procedures require more than 50 participants; for factor analysis, for example, we need a minimum of 100 subjects. Questionnaires typically attract an initial response rate of only around 30 %, and over 50 % can already be seen as a good response. The writer needed a 50 % participants of populations and for this research; I took the sampling 100 students.
Table 3.2
Sample of The Research Academic Year Number of
students
50% of Number of Students
2014/2015 78 39
2015/2016 55 27
2016/2017 81 41
Total 107
Source: English Department Document
C. Research Instrument
1. Research Instrument Development
The instrument and data needed is explained in table 3.3 Table 3.3
Data Source Instrument Data Needed
Students Questionnaire English students perceptions in using oral presentation
Students Documentation To record all of the data in a research and also as proof of research
a. Questionnaire
The questionnaire is a set of question for gathering information from the subject of study. In this research, the researcher will use a questionnaire to get data related to the first research problem. There are thirty-five statements in the questionnaire. It makes in the form of mark ceklis. The questionnaire will use Likert-type scale (1 = Strongly disagree, 2= Disagree, 3= Neutral, 4= Agree, and 5= Strongly agree).
The first section describes the demographic information of the sample, the second section consisted of 13 items and aimed to depict the participants' personal traits, the third section will set to find out about participants' presentation skill and consisted of 12 items, and the last section addressed the effect of audience and instructor on participants' oral presentations and consisted of 32 items.
Table 3.4
Interpretation of the difficulties in oral presentation (Riduwan : 88)
Score Interpretation
0% - 20% Very Low
21% - 40% Low
41% - 60% Moderately
61% - 80% Strong
81% - 100% Very Strong
To clarify the instrument, the writer presented the specification items of the difficulties in oral presentation questionnaire in the table below :
Table 3.5
Item specification of questionnaire No Consisted Section Number of Questionnaires
1. Personal traits 1,2,3,4,5,6,7,8,9,10,11,12,13
2. Presentation skill 14,15,16,17,18,19,20,21,22,23,24,25
3. Audience and instructor
26,27,28,29,30,31,32
2. Instrument Try Out
The researcher will try out the test instrument before it applies to the real sample in this study. The try out will give to students who ever do the oral presentation of English Department at IAIN Palangka Raya. The researcher gained the information about the instrument quality that consists of instrument validity and instrument reliability.
3. Instrument Validity
J.B Heaton (1988, p. 159) state that validity of a test is the extent to which it measures what it is supposed to measure and nothing else. Every test, whether it be a short, informal classroom test or a public examination, should be valid as the constructor can make it. The test must aim to provide a true measure external knowledge and other skills at the same time; it will be not a valid test. The validity of this study is distinguished into some kinds as follows:
a. Face Validity
Ary et a, (2010, p. 228) state that“face validity is a term
sometimes used in connection with a test's content. Face validity refers to the extent to which examinees believe the instrument is measuring what is supposed to measure. "
b. Construct Validity
Construct validity is the type of validity which assumes the existence of certain learning theories or constructs underlying the acquisition of abilities and skills.
c. Content Validity
The test item in this study will measure the speaking ability in using oral presentation of English Department in the fourth semester at IAIN Palangka Raya. According to Riduan (2004, p. 110) to measure the validity of the instrument, the researcher used the formulation of product moment by person as follows.
∑ (∑ )(∑
√* ∑ (∑ ) + , ∑ (∑ )
-Where:
rxy : Index Correlation Number “r” Product Moment.
N : Number of Cases
∑XY : Multiplication Result between score X and score Y.
∑X : Total Value of score X.
∑Y : Total Value of score Y.
Interpretation :
rxy>rt = Valid
rxy<rt = Invalid
0.800 – 1.000 = Very High Validity
0.600 – 0.799 = High Validity
0.400 – 0.599 = Fair Validity
0.200 – 0.399 = Poor Validity
0.0 –0.199 = Very Poor Validity
4. Instrument Reliability
The reliability of a measuring instrument is the degree of consistency with which it measures whatever it is measuring. On at theoretical level, reliability is concerned with the effect or error on the consistency of scores ( Ary et al, 2010, p. 237 ).
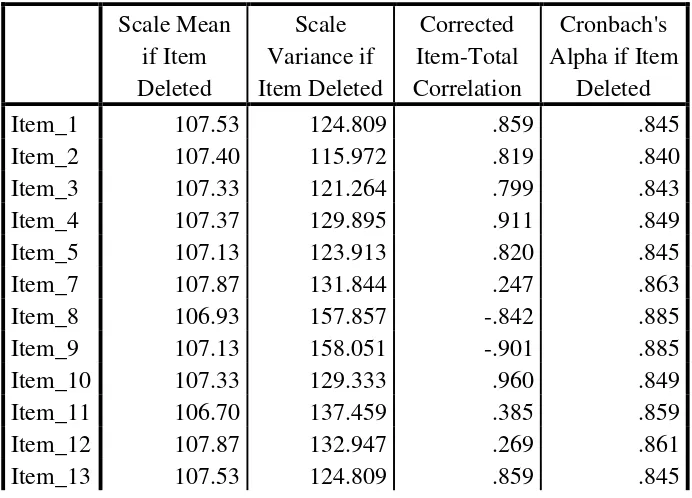
It was using program SPSS version 18 in finding the reability. The degree of alpha's Cronbach is higher than r table (0,44)
Table 3.6
Table 3.7 Item-Total Statistics
Item_14 107.10 155.472 -.831 .882
Item_15 107.53 129.292 .741 .850
Item_17 107.50 127.845 .768 .849
Item_18 107.40 124.938 .826 .846
Item_20 107.23 123.564 .821 .845
Item_21 108.03 126.171 .465 .855
Item_22 107.37 129.895 .911 .849
Item_23 107.33 127.747 .882 .848
Item_24 107.30 121.597 .813 .843
Item_25 107.33 127.747 .882 .848
Item_26 107.40 127.697 .891 .847
Item_27 107.37 129.895 .911 .849
Item_28 107.43 124.254 .749 .846
Item_29 107.33 159.816 -.815 .888
Item_30 107.17 157.799 -.840 .885
Item_31 107.30 160.838 -.828 .890
Item_32 107.53 124.809 .859 .845
Item_33 107.13 123.913 .820 .845
Item_35 107.27 120.340 .845 .842
Item_37 107.63 132.447 .438 .856
b. Documentation
The researcher needs documentation as proof of the study. The aim of documentation in this study to record all of the data in a research and also as proof of research.
D. Data Collection Procedure
writer in answering the problem of study. Sandra claims that language
survey are any studies “that gather data on the characteristics and views of
informants about the nature of language or language learning through the
use of written questionnaire”.
In this study, the writer uses content or document analysis design. Ary states that content or document analysis is a research method applied to written or visual materials for the purpose of identifying specified characteristic of the material. The materials analyzed can be textbooks, newspaper, web pages, speeches, television programs, advertisement, musical composition, or any of a host of other types of documents. Content analysis is widely used in education" (Ary, 2006, p. 35).The writer used this research design because the writer analyzed the students' responded product.
In collecting the data for this research, the writer used questionnaires to obtain the data in order to answer the problem of the study. To get collected the objective data, the writer applied the steps as follows:
1. The writer prepared the questionnaire.
2. The writer gave questionnaire to the respondents 3. The writer collected the responses.
4. The writer calculated the result of the study.
6. The writer concluded the students‟perception of the difficulties in oral presentation as a form of speaking skill assessment at IAIN Palangka Raya.
E. Data Analysis Procedure
1. Data Compiling
In this study, the writer used interval scale and collected the data by using the questionnaires both of the close-ended and Likert types questions. This research was about students' perception which was known as attitudinal information. Often attitude scales on a questionnaire were also treated as interval scales. For example, frequently when Likert-scales are used, each response was given a number (Never = 1, rarely = 2, sometimes = 3, strongly often = 4 and always= 5) and these numbers are treat as interval scales.
The writer analyzed the data in three steps. There were item scores, the distribution of frequency, and the central tendency. To analyzed the data, the writer applied the steps as follows :
a. The writer collected the main data (item score/responses); b. The writer arrange the collected score into the distribution of
frequency of score table.
c. The writer calculated Mean using formula, Median, and Modus. 1) Mean
Where:
X = Mean value
Σ = Sum of
X = raw score
N = Number of case.
2) Median
The median is defined as that point in a distribution of measure which 50 percent of the cases lie. Example:
18 20 22 25 25 30
Median: any point from 22.5 to 24.5 fits the definition of the median. In this case, 22.5 + 24.5 = 23.5
3) The Modus / Mode
The mode is the value in a distribution that occurs most frequently. Example:
14 16 16 17 18 19 19 21
22
The mode of this distribution is 19 because it is the most frequent score.
d. The writer calculated the deviation score and standard deviation using the formula:
= X −X
= Deviation Score X = raw score _
X = Mean
2) Standard Deviation
= ∑
s = √∑
s = √∑ (∑ )
Where =
∑ = sum of the squares of each score (i.e., each score
is first squared, and then these squares are summed)
(∑ ) = sum of the score squared (the scores are first
summes, and then this total is squared)
N = Number of cases
e. The writer interpreted the analyzed result. f. The writer given a conclusion.
In compiling survey results the first thing a researcher needs to do was to decide on coding categories. The writer assigned a numerical code to the data, the data needed to be recorded in some fashion. The best way to do this was in some type of a table in which the writer identified the respondents in the left-hand column and used
the rows in the table to list the participant‟s responded to each item.
The writer used questionnaire with the close ended questions and likert type scale (strongly agree, agree, neutral, disagree and strongly disagree) as the instrument for collecting the data. Sandra stated that once the information is compiled in a table, it needs to be displayed in some way. There were several possible alternatives. a. One is to simply report the frequency of each response. Hence,
in the example of having students rank the importance of each skill, one could simply describe how many students ranked writing as one, and how many ranked listening as one, and so on.
b. A second alternative is to describe the results in percentages. If researchers choose to describe the results in terms of frequency or percentages they could also display these results in a figure using a bar graph or pie chart. Visually displaying results in this way often makes it easier to highlight the results of the survey. c. Finally, with interval scales one could describe the data in terms
44
The data presentation of the item score of the students‟ perception
shown in the table frequency distribution, the chart of frequency distribution, the measurement of central tendency (mean, median, and mode) and the measurement of deviation standard. The sample was 107 students for questionnaire. Furthermore the result of the research is as the following :
1. The result of Questionnaires
For analyzing the results of the questionnaire the writer used the data displaying as follow:
Table. 4.1.
Results of the Questionnaire
The first step was to tabulate score into the table of calculation Mean. The table was shown below :
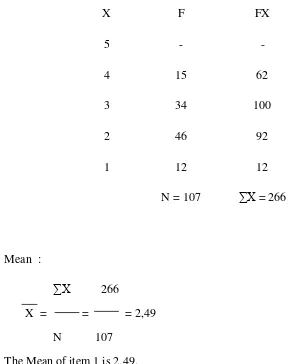
Table 4.2
The calculation of Mean of students’ perception (item 1)
X F FX
5 - -
4 15 62
3 34 100
2 46 92
1 12 12
N = 107 ∑X = 266
Mean :
∑X 266
X = = = 2,49 N 107
The Mean of item 1 is 2,49.
Table 4.3
The Calculation of Deviation Score and Standard Deviation of Students’
Perception (Item 1)
X F FX X X2 Fx2
5 0 0 2,51 6,30 0,00
4 15 62 1,51 2,28 34,20
3 34 100 0,51 0,26 8,84
2 46 92 -0,49 0,24 11,04
1 12 12 -1,49 2,22 26,64
N = 107 ∑Fx= ∑Fx2= 80,73
Stdev = √∑
= √
= √
= √ = 0.73
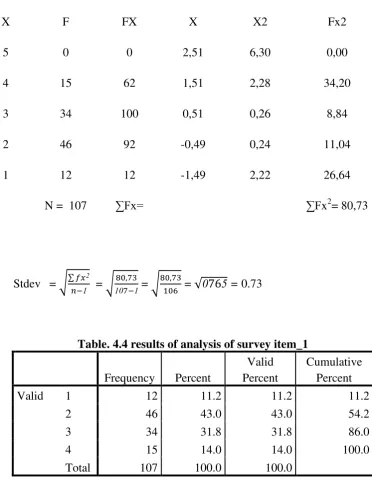
Table. 4.4 results of analysis of survey item_1
Frequency Percent
Valid Percent
Cumulative Percent
Valid 1 12 11.2 11.2 11.2
2 46 43.0 43.0 54.2
3 34 31.8 31.8 86.0
4 15 14.0 14.0 100.0
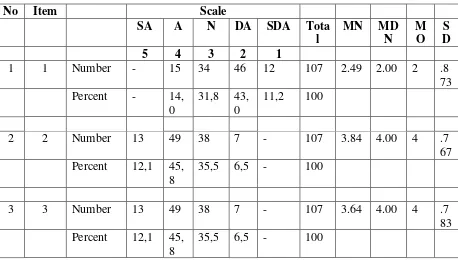
Item 1, students don‟t like the idea of oral presentation. There were
12 students (11,2 %) strongly disagreed, 46 students (43,0 %) disagreed, 34 students (31,8 %) neutral, and 15 students (14,0%) agreed.
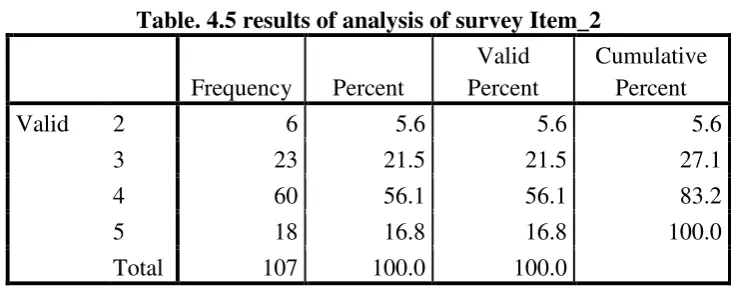
Table. 4.5 results of analysis of survey Item_2
Frequency Percent
Valid Percent
Cumulative Percent
Valid 2 6 5.6 5.6 5.6
3 23 21.5 21.5 27.1
4 60 56.1 56.1 83.2
5 18 16.8 16.8 100.0
Total 107 100.0 100.0
Item 2, Students like to do an oral presentation with a group. There were 6 students (5,6 %) disagreed, 23 students (21,5 %) neutral, 60 students (56,1%) agreed and 18 students (16,8 %) strongly agreed.
Table. 4.6 results of analysis of survey Item_3
Frequency Percent
Valid Percent
Cumulative Percent
Valid 2 7 6.5 6.5 6.5
3 38 35.5 35.5 42.1
4 49 45.8 45.8 87.9
5 13 12.1 12.1 100.0
Total 107 100.0 100.0
Table. 4.7 results of analysis of survey Item_4
Frequency Percent
Valid Percent
Cumulative Percent
Valid 1 5 4.7 4.7 4.7
2 20 18.7 18.7 23.4
3 22 20.6 20.6 43.9
4 52 48.6 48.6 92.5
5 8 7.5 7.5 100.0
Total 107 100.0 100.0
Item 4, an oral presentation exam difficult because I have low self-confidence. There were 5 students (4,7 %) strongly disagreed, 20 students (18,7 %) disagreed, 22 students (20,6 %) neutral, 52 students agreed (48,6 %) and 8 students (7,5%) strongly agreed.
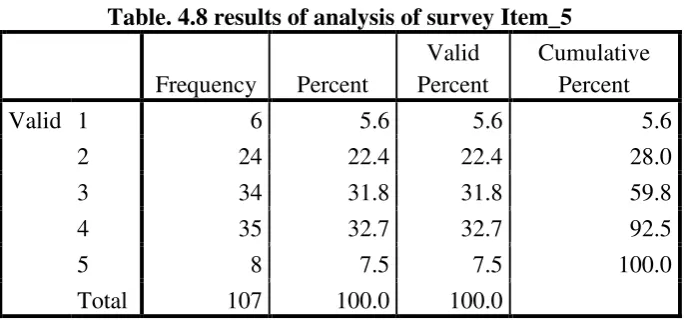
Table. 4.8 results of analysis of survey Item_5
Frequency Percent
Valid Percent
Cumulative Percent
Valid 1 6 5.6 5.6 5.6
2 24 22.4 22.4 28.0
3 34 31.8 31.8 59.8
4 35 32.7 32.7 92.5
5 8 7.5 7.5 100.0
Total 107 100.0 100.0
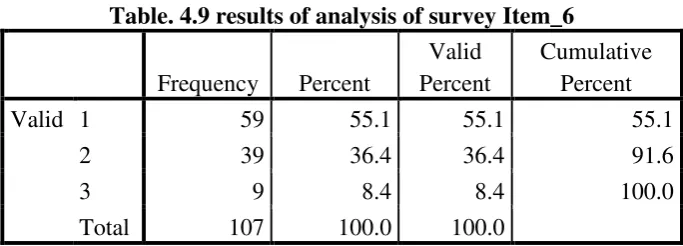
Table. 4.9 results of analysis of survey Item_6
Frequency Percent
Valid Percent
Cumulative Percent
Valid 1 59 55.1 55.1 55.1
2 39 36.4 36.4 91.6
3 9 8.4 8.4 100.0
Total 107 100.0 100.0
Item 6, on oral presentation day skip class. There were 59 students (55,1 %) strongly disagreed, 39 students (36,4 %) disagreed, 9 students (6,5 %) neutral.
Table. 4.10 results of analysis of survey Item_7
Frequency Percent
Valid Percent
Cumulative Percent Vali
d
1 4 3.7 3.7 3.7
2 10 9.3 9.3 13.1
3 25 23.4 23.4 36.4
4 51 47.7 47.7 84.1
5 17 15.9 15.9 100.0
Total 107 100.0 100.0
Table. 4.11 results of analysis of survey Item_8
Frequency Percent
Valid Percent
Cumulative Percent
Valid 1 3 2.8 2.8 2.8
2 10 9.3 9.3 12.1
3 30 28.0 28.0 40.2
4 55 51.4 51.4 91.6
5 9 8.4 8.4 100.0
Total 107 100.0 100.0
Item 8, feel worried even if have prepared well beforehand. There were 3 students (2,8 %) strongly disagreed, 10 students (9,3%) disagreed, 30 students (28,0 %) neutral, 55 student (51,4 %) agreed, and 9 students (8,4 %).
Table. 4.12 results of analysis of survey Item_9
Frequency Percent
Valid Percent
Cumulative Percent
Valid 1 8 7.5 7.5 7.5
2 29 27.1 27.1 34.6
3 40 37.4 37.4 72.0
4 22 20.6 20.6 92.5
5 8 7.5 7.5 100.0
Item 9, when starting oral presentation, forget everything wanted to say. There were 8 students (7,5 %) strongly disagreed, 29 students (27,1 %) disagreed, 40 students (37,4 %) neutral, 22 students (20,6%) agreed and 8 students strongly agreed (7,5 %).
Table. 4.13 results of analysis of survey Item_10
Frequency Percent
Item 10, peers speak English better than. There were 1 students (9%) strongly disagreed, 5 students (4,7 %) disagreed, 30 students (28,0 %) neutral, 50 students (38,3%) agreed and 21 (19,6%) students strongly agreed.
Table. 4.14 results of analysis of survey Item_11
students (36,4 %) disagreed, 17 students (15,9 %) neutral and 39 students (36,4%) agreed.
Table. 4.15 results of analysis of survey Item_12
Frequency Percent
Valid Percent
Cumulative Percent
Valid 1 11 10.3 10.3 10.3
2 29 27.1 27.1 37.4
3 39 36.4 36.4 73.8
4 25 23.4 23.4 97.2
5 3 2.8 2.8 100.0
Total 107 100.0 100.0
Item 12, feel shy during oral presentation. There were 11
students (10,3 %) strongly disagreed, 29 students (27,1 %) disagreed, 39 students (36,4%) neutral, 25 students (23,4%) agreed and 3 students (2,8%) strongly agreed .
Table. 4.16 results of analysis of survey Item_13
Frequency Percent
Valid Percent
Cumulative Percent
Valid 1 8 7.5 7.5 7.5
2 19 17.8 17.8 25.2
3 37 34.6 34.6 59.8
4 37 34.6 34.6 94.4
5 6 5.6 5.6 100.0
Total 107 100.0 100.0
students (34,6%) neutral, 37 students (34,6%) agreed and 6 students (5,6%) agreed.
Table. 4.17 results of analysis of survey Item_14
Frequency Percent
Valid Percent
Cumulative Percent
Valid 1 6 5.6 5.6 5.6
2 18 16.8 16.8 22.4
3 41 38.3 38.3 60.7
4 33 30.8 30.8 91.6
5 9 8.4 8.4 100.0
Total 107 100.0 100.0
Item 14, need to read from notes during oral presentations. There were 6 students (5,6 %) strongly disagreed, 18 students (16,8 %) disagreed, 41 students (48,3 %) neutral, 33 students (30,8 %) agreed and 9 students (8,4%) strongly agreed.
Table. 4.18 results of analysis of survey Item_15
Frequency Percent
Valid Percent
Cumulative Percent
Valid 1 3 2.8 2.8 2.8
2 10 9.3 9.3 12.1
3 35 32.7 32.7 44.9
4 49 45.8 45.8 90.7
5 10 9.3 9.3 100.0
Total 107 100.0 100.0
Item 15, prefer to see someone‟s presentation before starting my
(9,3 %) disagreed, 35 students (32,7 %) neutral, 49 students (45,8 %) strongly agreed and 10 students (9,3%) strongly agreed.
Table. 4.19 results of analysis of survey Item_16
Frequency Percent
Valid Percent
Cumulative Percent
Valid 1 39 36.4 36.4 36.4
2 45 42.1 42.1 78.5
3 13 12.1 12.1 90.7
4 6 5.6 5.6 96.3
5 4 3.7 3.7 100.0
Total 107 100.0 100.0
Item 16, don‟t know how to use technology in oral presentation. There were 39 students (36,4 %) strongly disagreed, 45 students (42,1%) disagreed, 13 students (12,1 %) neutral, 6 students (5,6 %) agreed and 4 students (3,7%) strongly agreed.
Table. 4.20 results of analysis of survey Item_17
Frequency Percent
Valid Percent
Cumulative Percent
Valid 1 5 4.7 4.7 4.7
2 26 24.3 24.3 29.0
3 49 45.8 45.8 74.8
4 18 16.8 16.8 91.6
5 9 8.4 8.4 100.0
Item 17, care about grammar more than fluency in oral presentation. There were 5 students (4,7 %) strongly disagreed, 26 students (24,3 %) disagreed, 49 students (45,8 %) neutral, 18 students (16,8%) agreed and 9 students (8,4%) strongly agreed.
Table. 4.21 results of analysis of survey Item_18
Frequency Percent
Valid Percent
Cumulative Percent
Valid 2 9 8.4 8.4 8.4
3 32 29.9 29.9 38.3
4 52 48.6 48.6 86.9
5 14 13.1 13.1 100.0
Total 107 100.0 100.0
Item 18, during oral presentation, I think in Indonesia then translate it into English. There were 9 students (8,4%) disagreed, 32 students (29,9 %) neutral, 52 students (48,6 %) agreed and 14 students (13,1%) strongly agreed.
Table. 4.22 results of analysis of survey Item_19
Frequency Percent
Valid Percent
Cumulative Percent
Valid 1 3 2.8 2.8 2.8
2 6 5.6 5.6 8.4
3 21 19.6 19.6 28.0
4 39 36.4 36.4 64.5
5 38 35.5 35.5 100.0
Item 19, the speaking course is not enough to improve my speaking skill. There were 3 students (2,8 %) strongly disagreed, 6 students (5,6 %) disagreed, 21 students (19,6 %) neutral, and 39 students (36,4 %) agreed and 38 students (35,5%) strongly agreed.
Table. 4.23 results of analysis of survey Item_20
Frequency Percent
Valid Percent
Cumulative Percent
Valid 1 1 .9 .9 .9
2 8 7.5 7.5 8.4
3 50 46.7 46.7 55.1
4 40 37.4 37.4 92.5
5 8 7.5 7.5 100.0
Total 107 100.0 100.0
Item 20, I find it hard to find the suitable word to express my meaning. There were 1 students (9 %) strongly disagreed, 8 students (7,5 %) disagreed, 50 students (46,7 %) neutral, 40 students (37,4%) agreed and 8 students (7,5%) strongly agreed.
Table. 4.24 results of analysis of survey Item_21
Frequency Percent
Valid Percent
Cumulative Percent
Valid 1 1 .9 .9 .9
2 10 9.3 9.3 10.3
3 25 23.4 23.4 33.6
4 60 56.1 56.1 89.7