1
RESULT OF THE STUDY
In this chapter, the writer presented the research findings, result data analysis and
discussion.
A.The Data Description
In this section, it described the obtained data of improvement the students’writing
narrative text before and after taught bymindmaple software. The presented data consisted of
distribution of pre-test score of control and experimental group and also the distribution of
post test score of control group and experimental group.
1. The Result of Pre-test Score Control Group and Experimental Group a. The Result of Pre-test Score of Control Group
The pre-test was conducted on Friday, 29thApril 2016 in the VIII B room. The
students asked to write narrative text that interested them about the fairy tale that
should cover the generic structure consisted of identification and allocated time was 90
minutes. Thestudents’ pre-test score of control group were distributed in the following table (see appendix 5) in order analizing the student’s background knowledge of narrative text. The writer calculated the scores of mean, standard deviation, and
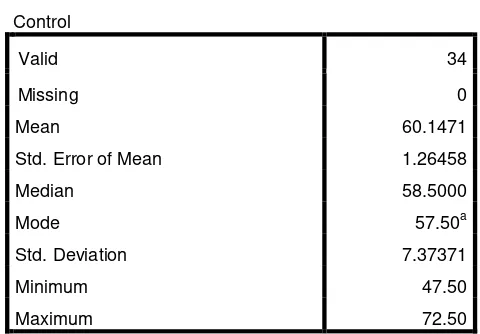
Table 4.1 The Calculation of Mean, Standard Error of Mean, Median, Mode,
a. Multiple modes exist. The smallest value is shown
Based on the calculation above, the higher score pre test of control group was 72.50
and the lowest score was 47.50. And the result of mean was 60.1471.Median was
58.5000. Mode was 57.50.The standard error of mean was 1.26458.And the standard
deviation was 7.37371.
b. The Result of Pre-test Score of ExperimentalGroup
The pre-test was conducted on Monday,25thApril 2016 in the VIII Croom. The
students asked to write narrative text that interested them about the fairy tale that
should cover the generic structure consisted of identification and allocated time was 90
minutes. The students’ pre-test score of experimental group were distributed in the following table (see in appendix 5) in order analizing the students’ background knowledge before treatment.
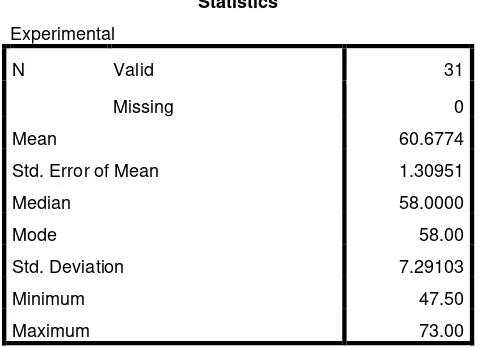
The writer calculated the scores of mean, standard deviation, and standard error
using SPSS 18 program as follows.
Statistics
Based on the calculation above, the higher score pre-test of control group was 73.00
and the lowest score was 47.50. And the result of mean was 60.6774.Median was
58.0000. Mode was 58.00.The standard error of mean was 1.30951.And the standard
deviation was 7.29103.
Then, it was presented in the following table:
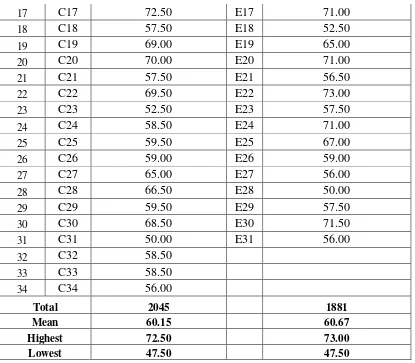
Table 4.3 Pre-Test Score of Control and Experimental Group
Control Group Experimental Group
17 C17 72.50 E17 71.00
2. The Result of Post Test Score Control Group and Experimental Group
a. The Result of Post test Score of Control Group
The post test was conducted on Saturday, 21thMay 2016 in the VIII B room. The
students asked to write narrative text that interested them about the fairy tale that
should cover the generic structure consisted of identification, allocated time was 90
minutes The students’ post test score of control group were distributed in the following table (see in appendix 5) in order analizing theknowledge of narrative text.
The writer calculated the scores of mean, standard deviation, and standard error
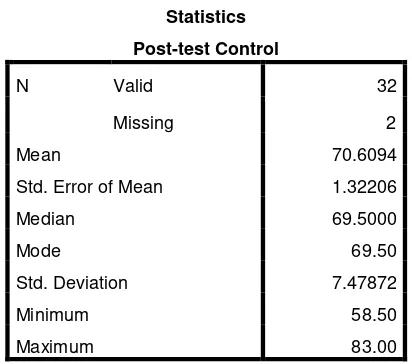
Table 4.4 The Manual Calculation of Mean, Standard Error of Mean, Standard Deviation
Statistics
Post-test Control
N Valid 32
Missing 2
Mean 70.6094
Std. Error of Mean 1.32206
Median 69.5000
Mode 69.50
Std. Deviation 7.47872
Minimum 58.50
Maximum 83.00
Based on the calculation above, the higher score pre test of control group was 83.00
and the lowest score was 58.00. And the result of mean was 70.6094, median was
69.5000, mode was 69.50, the standard error of mean was 1.32206 and the standard
deviation was 7.47872.
b. The Result of Post test Score ofExperimentalGroup
The post test was conducted on Wednesday,11th May 2016 in the VIII C room. The
students asked to write narrative text that interested them about the fairy tale that
should cover the generic structure consisted of identification, allocated time was 90
minutes and should post their text on by using mindmaple software.The students’ post test score of experiment class were distributed in the following table (see in appendix 5)
in order analizing the students’ wriitng narrative text after the treatment.
The next step, the writer calculated the scores of mean, standard deviation, and
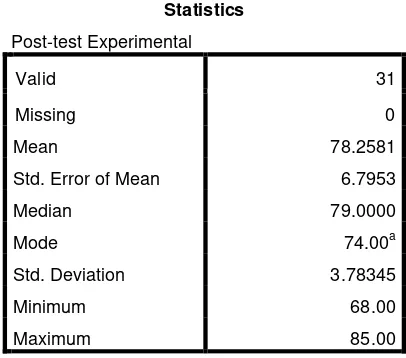
Table 4.5 The Calculation of Mean, Standard Error of Mean, Standard
a. Multiple modes exist. The smallest value is shown
Based on the calculation above, the higher score post test of experimental group was
85.00 and the lowest score was 68.00. And the result of mean was 78.2581,median was
79.0000,mode was 74.00,The standard error of mean was 6.7953 and the standard
deviation was 3.78345.
Then, it was presented in the following table:
Table 4.6 Post Test Score of Control and Experimental Group
Control Group Experimental Group
11 C11 77.00 E11 74.00
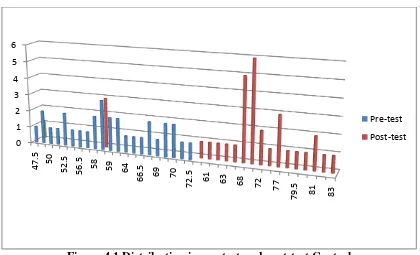
Figure 4.1 Distribution in pre-test and post-test Control Group
Based on the figure above, it can be seen that the studentspre-test score of control
group. There was onestudents who got score 47.5. There wasone student who got score
72.5. Then, the post-test of student score on control group there was one student who got
score 58.5 and there was one student who got score 83. 0
1 2 3 4 5 6
47.5 50 52.5
56.5 58 59 64
66.5 69 70
72.5 61 63 68 72
77
79.5 81 83
Pre-test
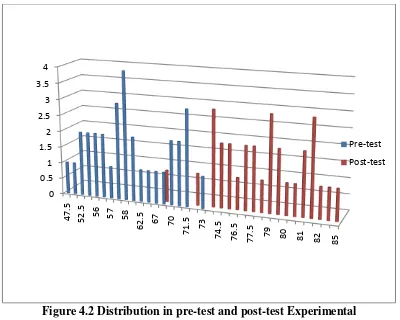
Figure 4.2 Distribution in pre-test and post-test Experimental Group
Based on the figure above, it can be seen that the studentspre-test score of
Experimental group. There was onestudentwho got score 47.5. There wasone student who
got score 73. Then, the post-test of students’ score on experimental group there was one student who got score 68 and there wasone student who got score 85.
3. The Comparison Result Between Control and Experimental Group on The Post-Test
Based on the data analysis, it can see by comparison post-test of Control group and
Experimental group in the following table:
Table 4.7 The Comparison ResultBetween Post-test of Control and Experimental Group
No Control Experimental Improvement
6 72.00 72.50 0.50
score. It can be seen from the post-test control groupMean is 70.61.Then, the Mean of
post-test experimental group is 78.29. Then, for post-test of control group the highest score
score 85.00 and the lowest score 68.00. It means that the control group and experimental
group have different level in writing ability of narrative text after getting the treatment.
4. Testing the Normality and Homogeinity a. Normality Test
The writer used SPSS 18 to measure the normality of the data.
1) Testing Normality of Post Test Experimental and Control Group
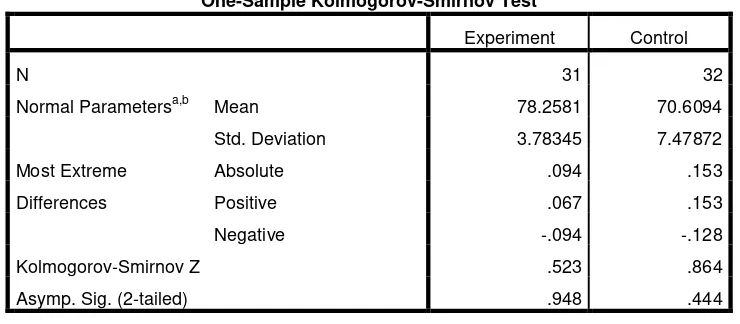
Table 4.8 Testing Normality of Post Test Experimental and Control Group
The criteria of the normality test of post test if the value of (probability value/critical value) was higher
experiment group 0.948. Then the normality both of class was consulted with table of
Kolmogorov- Smirnov with the level of significance 5% (α=0.05). because asymptotic significance of control0.444>0.05, and asymptotic significance of experiment 0.948>0.05.
It could be concluded that the data was in normal distribution. It meant that the students’ pre test score of experimental and control group had normal distribution.
b. Homogeinity Test
1) Testing Homogeinity of Post Test Experimental and Control Group
Table 4.9 Testing Homogeinity of Post-Test Experimental and Control Group
One-Sample Kolmogorov-Smirnov Test
Experiment Control
N 31 32
Normal Parametersa,b Mean 78.2581 70.6094
Std. Deviation 3.78345 7.47872
Most Extreme Differences
Absolute .094 .153
Positive .067 .153
Negative -.094 -.128
Kolmogorov-Smirnov Z .523 .864
Asymp. Sig. (2-tailed) .948 .444
The criteria of the homogeneity test post test was if the value of (probability
value/critical value) was higher than or equal to the level of significance alpha
defined (r=a), it means that, the distribution was homogeneity. Based on the
calculation using SPSS 18.0 above, the value of (probably value/critical value)
from post test of the experimental and control group on Homogeneity of
Variances in sig column is known that p-value was 0.084. The data in this study
fulfilled homogeneity since the p value is higher 0.084 > 0.05.
B.Result Data Analysis
1. Testing Hyphothesis Using Manual Calculation
The result of t-test using SPSS 18.0 program, it was found the t-test was greater than
the t table at 1% and 5% significance level or 2.00<5.17>2.65. It means that Ha was
accepted and Ho was rejected.It could be interpreted based on the result of calculation that Ha
stating that Mindmaple software was effective for Teaching Writing Narrative Text of
the eight graders of MTs Muslimat NU Palangka Raya was accepted and Ho stating
thatMindmaple software was not effective for teaching writing narrativetext of the
eight graders of MTs MuslimatNUPalangka Raya was rejected. It meant that teaching
writing with using mindmaple software toward students’ writing ability was effective for teaching writing narrative text of the eight graders of MTs Muslimat NU Palangka
Raya.
To test the hypothesis of the study, the writer used t-test statistical calculation. Firstly,
the writer calculated the standard deviation and the error of X1 and X2 at the previous data
persentation. In could be seen on this following table: Test of Homogeneity of Variances
Levene Statistic df1 df2 Sig.
Table 4.10
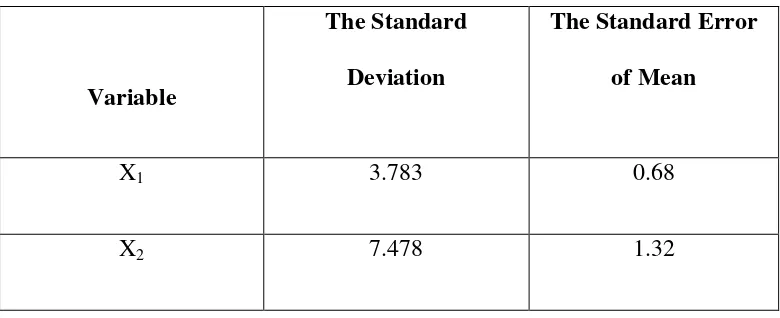
The Standard Deviation and Standard Error of X1 and X2
Variable
The Standard Deviation
The Standard Error of Mean
X1 3.783 0.68
X2 7.478 1.32
X1 = Experimental Group
X2 = Control Group
The table showed the result of the standard deviation calculation of X1 was 3.783 and
the result of the standard error mean calculation was 0.68. The result of the standard
deviation calculation of X2 was 7.478and the result of the standard error mean calculation
was 1.32.
The next step, the writer calculated the standard error of the difference mean between
X1 and X2 as follows:
Standard error of mean of score between Variable I and Variable II
SEM1– SEM2 = 𝑆𝐸𝑚1 2+ 𝑆𝐸𝑚2 2
SEM1– SEM2 = 0.68 ² + 1.32 ²
SEM1– SEM2 = 0.4624 + 1.7424
SEM1– SEM2 = 2.2048
SEM1– SEM2 = 1.484857
The calculation above showed the standard error of the difference mean between X1
and X2 was 1.48. Then, it inserted to the formula to get the value of tobserved as follows:
T
o=
𝑀1−𝑀2
𝑆𝐸𝑚1−𝑆𝐸𝑚2
T
o=
78.26−70.61
1.48
T
o=
7.65
1.48
T
o=
5.16892T
o=
5.17Which the criteria:
If t-test (t-observed) ≥ t-table, Ha was accepted and H0 was rejected
If t-test (t-observed) ≤ t-table, Ha was rejected and H0 was accepted
Then, the degree of freedom (df) accounted with the formula:
Df = 𝑵𝟏+𝑵𝟐 − 𝟐 = (31+32) – 2 = 61
The writer chose the significant levels at 5%, it means the significant level of refusal
of null hypothesis at 5%. The writer decided the significance level at 5% due to the
hypothesis typed stated on non-directional (two-tailed test). It meant that the hypothesis
can’t direct the prediction of alternative hypothesis. Alternative hypothesis symbolized by “1”. This symbol could direct the answer of hypothesis, “1” can be (>) or (<). The answer
of hypothesis could not be predicted whether on more than or less than.
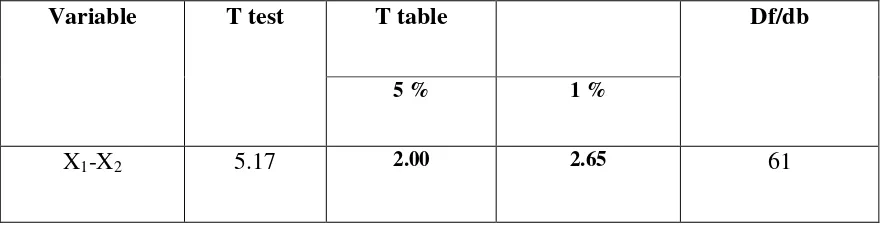
Table 4.11
The Result of T-Test Using Manual Calculation
Variable T test T table Df/db
5 % 1 %
X1-X2 5.17 2.00 2.65 61
Where:
X1 = Experimental Group
X2 = Control Group
T test = The Calculated Value
T table = The Distribution of t Value
Df/db = Degree of Freedom
Based on the result of hypothesis test calculation, it was found that the value of tobserved
was greater than the value of table at 1% and 5% significance level or 2.00<5.17>2.65. It
means Ha was accepted and Ho was rejected. It could be interpreted based on the result of
calculation that Ha stating thatmindmaple software was effective for Teaching Writing
Narrative Textof the eight grade students at MTs Muslimat NU Palangka Raya was
accepted and Ho stating thatmindmaplesoftware was not effective for Teaching Writing
NarrativeText of the eight grade students at MTs Muslimat NU Palangka Raya was
Teaching Writing Narrative Text of the eight graders of MTs Muslimat NU Palangka
Raya gave significant effect at 5% and 1% significance level.
2. Testing Hypothesis Using SPSS 18.0 Program
The writer also applied SPSS 18.0 program to calculate t test in testing hypothesis of
the study. The result of the t-test using SPSS 18.0 was used to support the manual
calculation of the t test. The result of the test using SPSS 18.0 program could be seen as
follows:
Table 4.12
Mean, Standard Deviation and Standard Error of Experiment Group and Control Groupusing SPSS 18.0 Program
The table showed the result of mean calculation of experimental groupwas 78.26,
standard deviation calculation was 3.783, and standard error of mean calculation was 680.
The result of mean calculation of control groupwas 70.61, standard deviation calculation
was 7.497, and standard error of mean was 1.322. Group Statistics
Group N Mean Std. Deviation Std. Error Mean
Score Experiment 31 78.26 3.783 .680
Table 4.13 The Calculation of T – Test Using SPSS 18.0
Independent Samples Test
Levene's Test for Equality of
Variances t-test for Equality of Means
F Sig. T Df
The table showed the result of t – test calculation using SPSS 18.0 program. To know
the variances score of data, the formula could be seen as follows:
If α =0.05 < Sig, Ho accepted and Ha rejected
If α = 0.05> Sig, Ha accepeted and Ho rejected
Based on data above, significant data is 0.000. It meant the t-test calculation uses at
the equal variances assumed. Since the result of post test between experiemental and
control group had difference score of variance, it found that α = 0.05 was higher than Sig (2-tailed) or (0.05>0.00), so that Ha was accepeted and Ho was rejected . The result of ttest
was 5.097, mean difference between experimental and control group was 7.649and the
C.Interpretation
To examine the truth or the false of null hypothesis stating that the there is effect of
mindmaple software in writing narrative text at eight graders of MTs Muslimat NUPalangka
Raya. The result of t – test was interpreted on the result of degree of freedom to get the ttable. The
result of degree of freedom (df) was 61. The following table was the result of tobservedand ttablefrom
61 df at 5% and 1% significance level.
Table 4.14
The Result of T-Test Using SPSS 18.0 Program
t-test
t-table
Df 5 % (0,05) 1 % (0,01)
5.09 2.00 2.65 61
The interpretation of the result of t-test using SPSS 18.0 program, it was found the t
observe was greater than the t table at 1% and 5% significance level or 2.00<5.09>2.65. It
means that Ha was accepted and Howas rejected. It could be interpreted based on the result of
calculation that Ha stating that mindmaple software was effective for Teaching Writing
Narrative Text of the eight grade students at MTs Muslimat NU Palangka Raya was
accepted and Ho stating thatmindmaple software was not effective for Teaching Writing
Narrative Text of the eight grade students at MTs Muslimat NU Palangka Raya was
rejected. It meant that teaching writing with mindmaplesoftware was effective for Teaching
Writing Narrative Text of the eight graders at MTs Muslimat NU Palangka Raya gave
D.Discussion
The result of analysis showed that there was significant effect of mindmaple software
in writing narrative text at the eight graders of MTs Muslimat NU Palangka Raya. It can be
seen from the means score between pre-test and post-test. The Mean score of post-test
reached higher score than the mean score of Pre-test (X= 78.25< Y=70.60). It indicated that
the students’ score increased after conducting treatment. In other words, the students writing
narrative text taught by software have better than those taught by non-mindmaple software at
the eight graders of MTs Muslimat NU Palangka Raya.
In addition, after the data was calculated using the ttest formula using SPSS 18.00
program showed that the tobserved was 5.09. In addition, After the students have been taught by
using mindmaple software, the writing score were higher than before implementing it. This
finding indicated that mindmaple softwarewas effective and supported the previous research
done by DiniAnggraini and Yakub Ismailthat also stated teaching writing by using
mindmapping was effective.
In teaching learning process, taught writing narrative text by using mindmaple
softwarewas a tool used by the writer to teach the students. It could be seen from the score of
students how the used of mindmaplegave positive effects for students writing narrative text.
Mindmaple software as means for language learning, effectively enhanced the writing
narrative text at eight graders of MTs Muslimat NU Palangka Raya. The students writing
narrative text was enhanced after the treatment when they were given opportunities to use
mindmaple software in the learning process. They wrote better narrative text using more
meaningful contents within a well-organized text in the post test.
The results supported theory by Erick Nyoni in Chaper I page 3, He begins by nothing
that one of the hardest tasks in writing is getting started. He notes that this could be solved by
mapping.1The students gave their attention to the material because the writer used different
media than usual. Using mindmaple software as a media in writing text actively encourages
collaborrative environment, increases motivation and the students participation. They could
be add the skillwriting on Mindmapping technique.
Next results supported theory by Kholoud Hussein Amoush in Chapter I page 4, Zaid
said that the students who use mapping manifest considerable improvement reading
comprehension, written expression and vocabulary development.2In line with it, the writer
gave the students the assignment, asked the students’ to search idea and asked them to makes map on mindmapping techniqueusing mindmaple software not on paper so that the students
had antusiasm on produce the text, and the students’ trains to writing especially narrative text.
Based on the result of study above, it proved that mindmaple software gave effect to
students when writing narrative text. These statistical findings were suitable with the theories
as mentioned before.
According to this theory, schemata represent knowledge about concepts, objects and the
relationship they have with other objects, situations, events, sequences of events, action, and
sequences of action.
1
Erick Nyoni, Sementically Enhanced Composition Writing with Learning of English as a Second Language (ESL), p. 266
2
Kholoud Hussein Amoush, The Effectiveness of Using “Semantic Mapping Strategy” on Reading