1
EXPERIMENTAL OF THE STUDY
This chapter presents the Research Type, Research Design, Variable of Study, Population
and Sample, Research Instrument, Data Collecting Procedure, and Technique of Data
Analysis.
A.Research Type
In this study, the writer used quantitative approach because this approach is qualified to
collect statistical data to answer the problems of this study. Then, the writer wasmeasures the
students’ score by the tests; pre-test and post-test. According to Creswell:
“a quantitative study, consistent with the quantitative paradigm, is an inquiry into a social or human problems based on testing a theory composed of variable, measured with numbers, and analyzed with statistical procedures, in order to determine whether predictive generalizations of the theory hold true”.1
B.Research Design
In this study, the writer used quasi experiment design. Quasi experimental design are
similar to randomized experimental research in that involved manipulation of an independent
variable but differ in that subjects are nonrandomized assigned to treatment group.2 There are
many situations in educational research in which is not possible to conduct a true experiment.
Neither full control over the scheduling of experimental conditions nor the ability to
randomize can be always realized.3
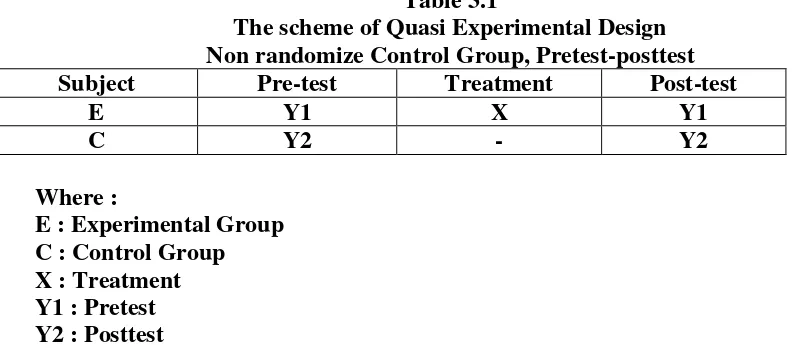
The writer used nonrandomized control group pre-test post-test deign with a kind of
treatment. There were two group in this model, control group and experimental group. Both
1
John W. Creswell, Qualitative and Quantitative approach, 1994, California: SAGE Publications, Inc, 1994, p. 2.
2
Donald Ary, Lucy Cheser Jacobs, Chris Sorensen, Introduction to Research in Education. Eight Edition, (USA: Wadsworth, Cengage Learning. 1985). P. 316
3
of groups are given pre-test (Y1 and Y2) before having treatment. The treatment wasgiven to
the experimental group only (X). Post-test was given for both of groups to measure the
student’ score after the treatment given (Y1 and Y2). The schema of model was:
Table 3.1
The scheme of Quasi Experimental Design Non randomize Control Group, Pretest-posttest
Subject Pre-test Treatment Post-test
E Y1 X Y1
Therefore, the useofmindmaple software in teaching writing is applied on experimental group
only. For the control group, the writer was teaching the material by using conventional
approach. The conventional approach is when the teacher teaches the students by using
textbook without using mindmaple software. Meanwhile, the control group was not given the
treatment.
C.Variable of Study
Variable is a property or characteristic which may differ from individual to individual
or from group to group. A great deal of research is carry out in order to identify or test the
strength of relationships between variables. When one variable influences or affects a second
variable, the first variable is called an independent variable, and the second is called a
dependent variable.4 The present study will be included the following variables:
1. Independent Variable :Mindmaple software in teaching of writing narrative text (X).
4
2. Dependent Variable :The students' ability using mindmaple softwarein writing
narrative text (Y).
D.Population and Sample
1. Population
According Vicente, a population is nothing but a group of a particular concept that
has something common to each other. Population depends on the experimental conducted.
It can be a group of people, a group of books, a group of journal, etc. Mostly it happens,
when an experimental is conduct, the research want to gets data from the whole population
but it becomes very tedious to do so.
In such cases we make use of a small group of members of the same population, call
the sample of the population. As we use statistics to learn about the characteristics of the
population, the sample chosen must benonrandomized select.
3.2The number
Population of the 8th Graders of MTs Muslimat NU Palangka Raya
No Grade The number of Students
1. VIII-A 35
2. VIII-B 34
3. VIII-C 31
Total 100
2. Sample
Sample is a group select from a population for observation in study.5In this study,
because of the large number of population, the writer takes sample as the representative
of the population. The writer wasused cluster sampling to take the sample. Cluster
5
sampling is a probability technique that nonrandomized select and use whole naturally
occurring groups such as intact classrooms.6 By cluster sampling, the writer waschoosing
two classes that became the experiment group and became the control group.
The population can be seen in the following table.
3.3 The number
Sample of the 8th Graders of MTs Muslimat NU Palangka Raya
No Grade Groups Number of Students
1. VIII-C E 31
2. VIII-B C 34
The Total Number of Students 65
In this study, VIII-C class as a experiment group which taught by using Mindmaple
software and class VIII-B as a control group which taught by non-Mindmaple software.
E.Research Instruments
Instruments of the study are very needed in research. It is because the instruments are
tools to get the data of the study, in which the data are the important things to help the writer
in answering the problem of the study and also to prove the hypothesis. The data also needed
to find the aim of the study.
1. Test
The writer useda test as an instrument to collect data of this study. Test is an
instrument or systematic procedure for measuring a sample of behavior.7To know how
well the students do the writing narrative text and how well they writing is applied
6
Ibid, p. 637 7
intomindmaple software as technique in narrative text. The test consists of the
instructions and statement. Theyasked to develop the topic into a text containing about
100-150 words. The writer wascollectingthe data of this study by using the test; the test
results of the testused to measure the students’ writing ability. There are two tests in this
research pre-test and post-test;
a) Pre-test
Pre-test is a preliminary test that purpose to measure the students’ scores in writing
skill before having treatment.8Student was given the writing test withthe instruction to
arrange the following jumble paragraph into a good a meaningful tall tale. Then, identify
about generic structure of narrative text story.
b) Post-test
Post test is a test given after a lesson period of instruction to determine what the
students’ have learned. 9
The purpose of post-test is to measure the students’ scores in
writing skill after the treatment has be done by writer. Post-test was given to the students
after their learning about narrative text using mindmaplesoftware and Non mindmaple
software. The writerasked the students to produce the narrative test in traditionally for
the control group, and ask the students in the experiment group to formulate their
narrative text using mindmaple software.
2. Research Instruments Validity
Validity is the most important consideration in developing and evaluating measuring
instruments. Historically, validity defined as the extent to which in instrument measure
what it claim to measure.10 Simply, it can be said that the test will be valid, if it measures
accurately what intended to measure. In this study, the validation of instrument is mainly
8
Anas Sudijono, Pengantar Evaluasi Pendidikan, Jakarta: PT Raja Grafindo Persada, 2007 P 69
9
Ibid P 70 10
direct to the content validity. Relate to the writing test, the content validity was checked
by examining and the test use to measure the objectives. The writer will use inter-rater
method (test of validity). Inter rater are two raters who score the students writing to get
the score composition as possible. The writer used product moment correlation as the
formula to calculate the validity from the test result. 11
r
xy =𝐍 𝐗𝐘−( 𝐗) ( 𝐘)
√{𝐍𝚺𝐗²−(𝚺𝐗)²}{𝐍𝚺𝐘²−(𝚺𝐘)²}
Where:
rxy : Index Correlation Number “r” Product Moment
N : Number of Cases
∑X : Total value of score X
∑Y : Total value of score Y
∑XY : Multiplication result between score X and Y
Interpretation:
rxy> t-table = Valid
rxy< t-table = Not Valid
Ridwan stated the criteria of interpretation of validity:12
0.800-1.000 = Very High Validity
0.600-0.799 = High Validity
0.400-0.599 = Fair Validity
0.200-0.399 = Poor Validity
3. Research Instruments Reliability
Reliability is a necessary characteristic of any good test: for it to be valid at all, a test
must first be reliable as a measuring instrument. 13A test is reliable to extent that the
11
AnasSudijono, PengantarStatistikPendidikan, Jakarta: PT Raja GrafindoPersada, 1997 p 193
12
scores made by an individual remain nearly the same in repeated measurements.14
Inter-rater reliability is a procedure when making observations of behavior. It involves
observations made by two or more individuals of an individual’s or several individuals’
behavior.15The writer uses Alpha as a formula to measure the reliability of essay test
0.800-1.000 = Very High Reliability
0.600-0.799 = High Reliability
0.400-0.599 = Fair Reliability
0.200-0.399 = Poor Reliability
0.000-0.199 = Very Poor Reliability
4. Normality
Normality is a test normal to whether or not the distribution of research data. Testing
the normality of the data it’s done by comparing a normal curve formed by the data that
will be collected with the standard normal curve/standard.17 This study used SPSS 18.0
program to test the normality of the data.
13Ibid P 155 14
Abdul Qodir, EvaluasiPembelajaranBahasaInggris, Solo: KatalogDalamTerbitan (KDT) , 2009, P 19
15
John W Creswell, Educational Research Planning, Conducting And Evaluating Quantitative And Qualitative Research, 4th Edition, Lincoln: University Of Nebraska, 2012, P 161
16
Riduwan, MetodedanTeknikMenyusun Thesisp. 113 17
2. Homogeneity
Homogeneity test aims to test the equality some samples.18 Homogeneity is also
known if all nonrandomized variables in the sequence or vector have the same finite
variance. It is used to know whether experimental group and control group, that are
decided, come from population that has relatively same variant or not. The formula is:19
F = 𝐵𝑖𝑔𝑔𝑒𝑟 𝑉𝑎𝑟𝑖𝑎𝑛𝑡
If calculation result of F is lower than F table by 5% degree of significance so Ho are
Accepted, it is mean both groups have same variant.
F. Data Collecting Procedure
The writer collected the data by using research instrument. The source of data,
instrument and data needed are explained in table 3.5 and then there are some steps in the
procedures as follows:
Source Data Instrument Data Needed
Students of experiment and control group
Pre-test The each ability of both groups
Students of experiment and control group
Post-test To Find the different score of students after doing the
treatment
Table 3.4 1. Collecting
a. The writer was determining the class into the experiment group and control group.
18
Ibid.p.136
19
b. The writer given the pre-test to the experiment group and control group
c. The writer given scores to the students’ worksheet.
d. The writer given the material by using mindmaple software in teaching narrative text to
the experiment group.
e. The writer given material by using traditional technique in teaching narrative text to the
control group.
f. The writer given the post-test for both of group
g. The writer given the result of score to the data from experiment and control group.
2. Editing
After collecting all the needed data, the writer check the data, whether or not the data
are complete, understandable, and consistent and had appropriate respond.
3. Coding
It is an activity to classify the data by giving identify so that having a certain meaning
in analyzing. C and E are the codes for control and experimental class.
G.Data Analysis Procedure
This study usedthe students’ writing score as the data. The data arequantitative data.
The data was analyzed by inferential statistic. The writer analyzed the data by some
procedures below:
a. The writer was giving and collecting the data of the students’ score both of pre-test
and post-test at eight grade students of MTs Muslimat NU Palangka Raya.
b. The writer was tabulate the students’ score into distribution of frequency in the table,
then find out the mean of students’ score, standard deviation and standard error of
c. The writer wasanalyzing the normality and homogeneity of pretest and posttest at
experiment and control group.
d. The writer was analyze the data by using t-test and makes the conclusion of data
analysis obtain. The formula:20
to=
𝑴𝟏−𝑴𝟐 𝑺𝑬𝒎𝟏−𝒎𝟐
Note:
M1- M2 :The difference of two means
SEm1 –SE m2 :The standard error of the difference between two means
To know the hypothesis accepts or rejects using the criteria; 21
If α =0.05 < Sig, Ho accepted and Ha rejected
If α = 0.05 > Sig, Ha accepetd and Ho rejected
Interpreted the result of ttest., the writer accounted the degrees of freedom (df)
with the formula:22
df = 𝑵𝟏+𝑵𝟐 − 𝟐
Where:
Df : Degrees of freedom
N1 : Number of subject group 1
N2 : Number of subject group 2
2: Number of variable
e. The writer used SPSS 18.0 program after used t-test to answer the problem of
thestudy, whether there was significant difference between
usedmindmappingtechniques withmindmaple software.
20
AnasSudijono, PengantarStatistikPendidikan, , P.284
21
Riduwan & Sunarto, Pengantar Statistika, Bandung: Alfabeta, 2012, P 245
22
The procedure of collecting and analysis data was explained in figure 3.6
Figure: 3.1 Data Collection Procedure
Teaching Writing Narrative Text at MTs Muslimat Nu Palangka Raya Kalimantan Tengah
Control Group Experiment
Group
Teaching using traditional
technique
Score Pre-Test
Teaching using mindmaple
software
Pre-Test
Treatment No Treatment
Post-Test Score Post-Test
Calculating Normality and Homogeneity
Analysis the data using T-test
Interpretation