Prinsip Dasar Perpindahan Massa
Prinsip Dasar Perpindahan Massa
dalam OTK (UO)
dalam OTK (UO)
¨
¨
¨
¨
,
,
¨
¨
¨
¨
/120
/120
§
§
§
§
+
+
§
§
§
§
---
Beberapa DEFINISI dan PENGERTIAN
Beberapa DEFINISI dan PENGERTIAN
----
----Setijo Bismo
Setijo Bismo
PerMas
Definisi dan Pengetahuan tentang Definisi dan Pengetahuan tentang
Perpindahan Massa dalam Operasi Teknik Kimia
Perpindahan Massa dalam Operasi Teknik Kimia
# Apa itu “Operasi Teknik Kimia” (Unit Operation)?
Suatu proses tertentu yang khas dengannya seorang insinyur teknik kimia dapat bekerja untuk memproduksi dan atau mengkonversi suatu bahan (baku) dengan nilai tertentu menjadi bahan (jadi) atau produk yang diinginkan dengan nilai tambah yang lebih tinggi dan atau lebih bernilai dari bahan (baku) sebelumnya.
Contoh: produksi bensin dari minyak mentah, produksi LNG dari gas bumi, produksi ammonia dari
gas alam dan udara, produksi urea dari ammonia, dll.
# Apa beda “Perpindahan Massa” dan “Operasi Teknik Kimia”?
Keduanya sama, karena keduanya selalu melibatkan “sekuens” perubahan-perubahan fisika (phisycal change) dan atau diikuti dengan reaksi kimia (chemical reaction) bersamanya.
Contoh: dalam suatu OTK selalu melibatkan “perpindahan massa” (dan “reaksi kimia”), yaitu
perubahan dan atau perpindahan secara fisika (dan kimiawi) dimulai dari masukan sampai keluarannya.
Model Pendekatan berdasarkan Sifat Fisika:
Model Pendekatan berdasarkan Sifat Fisika:
Pendekatan Perpindahan Massa secara Difusi
Persamaan Perpindahan Massa Difusional:
Persamaan Perpindahan Massa Difusional:
[Fluks gas CO2 ] = ( ) ( ) (lua 2 ) juml s pe a rmukaan perpindah w an h gas dipindahkan aktu CO ⎡ ⎤ ⎢ ⋅ ⎥ ⎣ ⎦ 2 2
Massa Luas permukaan
perpindahan yang dipindahkan CO CO
α
⎛ ⎞ ⎛ ⎞ ⎜ ⎟ ⎜ ⎟ ⎝ ⎠ ⎝ ⎠(Definisi umum yang mengabaikan pengaruh spesifik alat)
Jika, Fluks sebanding dengan konsentrasi:
[Fluks gas
CO
2] =
k
2 2, ,Beda konsentrasi
dan
awalCO
aakhirCO
⎛
⎞
⎜
⎟
⎝
⎠
adalah Koefisien Perpindahan Massa
k
Fluks yang sebanding dengan konsentrasi:
[Fluks gas
CO
2] =
k
2 2, ,Beda konsentrasi
dan
awalCO
aakhirCO
⎛
⎞
⎜
⎟
⎝
⎠
Dapat dinyatakan sebagai fungsi dari panjang pipa kapiler (Hukum Fick):
2
2,
2, dan
Fluks gas Beda konsentrasi
panjang pipa kapiler
awal CO aakhir
CO
CO ⎛⎜ ⎞⎟
⎝ ⎠
=
D
adalah Koefisien Difusi
D
Persamaan terakhir analogi dengan Hukum Ohm:
Fluks
atau Densitas Arus
1 Beda jarak resist POTENSIAL LISTR Elekt ivitas on IK r ⎛ ⎞ ⎜ ⎟ ⎛⎜ ⎞ ⋅⎟ ⎛⎜ ⎞⎟ ⎝ ⎠ ⎝ ⎠
=
⎝ ⎠Baik persamaan yang menggunakan Koefisien PERPINDAHAN MASSA ataupun Kooefisien Difusi (D) tidak selalu dapat “berhasil” digunakan. Hal ini karena adanya “berbagai asusmsi yang digunakan” dalam pengembangan kedua persamaan tersebut. Sebagai contoh, FLUKS mungkin juga TIDAK SEBANDING dengan PERBEDAAN KONSENTRASI bila pipa kapilernya sangat tipis (halus) atau kedua gas mengalami reaksi. Demikian juga Hukum OHM, tidak selamanya dapat diterapkan untuk TEGANGAN SANGAT TINGGI.
Namun, kasus-kasus terakhir adalah PENGECUALIAN. Karena, dalam banyak hal, kedua persamaan difusi tersebut dapat diaplikasikan secara memadai.
2
2,
2, dan
Fluks gas Beda konsentrasi
panjang pipa kapiler
awal CO aakhir
CO
CO ⎛⎜ ⎞⎟
⎝ ⎠
= D Fluks
atau Densitas Arus
1 Beda jarak resist POTENSIAL LISTR Elekt ivitas on IK r ⎛ ⎞ ⎜ ⎟ ⎛⎜ ⎞ ⋅⎟ ⎛⎜ ⎞⎟ ⎝ ⎠ ⎝ ⎠ = ⎝ ⎠
Peristiwa Perpindahan: Difusi H
Analisis Peristiwa Perpindahan: Model DIFUSI
Analisis Peristiwa Perpindahan: Model DIFUSI
(
) (
)
0 0 0 z z z z ⎛ ⎞ − ⎛ ⎞ ⎜ = ⎟ ⎜ = ⎟ ⎛ ⎞ = ⋅ ⎝ ⎠ ⎝ ⎠ ⎜ ⎟ = − = ⎝ ⎠ A D konsentrasi konsentrasi hidrogen hidrogen flukshidrogen ketebalan ketebalan
pada pada
pada pada
Model difusi gas H
Model difusi gas H22 yang dijelaskan selama ini, memiliki asumsi sebagai yang dijelaskan selama ini, memiliki asumsi sebagai berikut:
berikut:
atau, secara simbolik dapat juga dituliskan:
atau, secara simbolik dapat juga dituliskan:
( )
( )
1( ) ( )
0( )
1 10
z zc
c
j
=
⋅
=−
=−
AA
D
indeks angka "1" menyatakan spesi yangberdifusi, tebal adalah jarak lintasan difusiAA
Jika tebal merupakan jarak / lintasan difusi yang sangat tipis, maka :
( )
1 1 1 1 0d
lim
d
z z z z z zc
c
c
j
z
z
z
= = + → +−
=
⋅
= − ⋅
−
A A AD
D
Analisis Peristiwa Perpindahan: Pelarutan Obat
Analisis Peristiwa Perpindahan: Pelarutan Obat
Padatan OBAT dilarutkan dalam air
Padatan OBAT dilarutkan dalam air
menggunakan pengaduk sampai
menggunakan pengaduk sampai
waktu tertentu
Analisis Peristiwa Perpindahan: Model Pelarutan Obat
Some Examples (#1)
Some Examples (#1)
#1. Ammonia, the major material for fertilizer, is made by reacting nitrogen and hydrogen under pressure. The product gas can be washed with water to dissolve the ammonia and separate it from other unreacted gases. How can you correlate the dissolution rate of ammonia during washing?
Solution
Solution
:
:
The easiest way is to
The easiest way is to
use mass transfer coefficients
use mass transfer coefficients
. If
. If
you use diffusion
you use diffusion
coefficients, you must somehow
coefficients, you must somehow
specify the distance across which diffusion
specify the distance across which diffusion
occurs.
occurs.
This distance is unknown unless the detailed flows
This distance is unknown unless the detailed flows
of gases and the
of gases and the
water are
water are
known; they rarely
known; they rarely
are
Some Examples (#2)
Some Examples (#2)
#2. Reactions in porous catalysts. Many industrial reactions use catalysts containing small amounts of noble metals dispersed in a porous inert material like silica. The reactions on such a catalyst are sometimes slower in large pellets than in small ones. This is because the reagents take longer to diffuse into the pellet than they do to react. How should you model this effect?
Solution
Solution
:
:
You should
You should
use diffusion coefficients
use diffusion coefficients
to describe the
to describe the
simultaneous diffusion and reaction in the pores in
simultaneous diffusion and reaction in the pores in
the catalyst. You should not use mass transfer
the catalyst. You should not use mass transfer
coefficients because you cannot easily include the
coefficients because you cannot easily include the
effect of reaction.
Some Examples (#3)
Some Examples (#3)
#3. Corrosion of marble. Industrial pollutants in urban areas Corrosion of marble
like Venice cause significant corrosion of marble statues. You want to study how these pollutants penetrate marble. Which diffusion model should you use?
Solution
Solution
:
:
The model
The model
using diffusion coefficients is the only one
using diffusion coefficients is the only one
that will allow you to
that will allow you to
predict pollutant concentration
predict pollutant concentration
versus position in the marble
versus position in the marble
. The model using
. The model using
mass transfer coefficients will only correlate how
mass transfer coefficients will only correlate how
much pollutant enters the statue, not what happens
much pollutant enters the statue, not what happens
to the pollutant
Some Examples (#4)
Some Examples (#4)
#4. Protein size in solution. We are studying a variety of proteins that you hope to purify and use as food supplements. We have to characterize the size of the proteins in solution. How can we use diffusion to do this?
Solution
Solution
:
:
Our aim is
Our aim is determining the molecular sizedetermining the molecular size of the protein of the protein molecules. We are not interested in the protein mass
molecules. We are not interested in the protein mass
transfer except as a route to these molecular
transfer except as a route to these molecular
properties. As a result,
properties. As a result, wewe should measure the should measure the protein
protein’’s diffusion coefficient, not its mass transfer s diffusion coefficient, not its mass transfer coefficient. The protein
coefficient. The protein’’s diffusion coefficient will turn s diffusion coefficient will turn out to be proportional to its radius in solution
Some Examples (#5)
Some Examples (#5)
#5. Facilitated transport across membranes Some membranes contain a mobile carrier, a reactive species that reacts with diffusing solutes, facilitating their transport across the membrane. Such membranes can be used to concentrate copper ions from industrial waste and to remove carbon dioxide from coal gas. Diffusion across these membranes does not vary linearly with the concentration difference across them. The diffusion can be highly selective, but it is often easily poisoned. Should this diffusion be described with mass transfer coefficients or with diffusion coefficients?
Solution
Solution
:
:
This system includes not only diffusion but also chemical
This system includes not only diffusion but also chemical
reaction. Diffusion and reaction couple in a nonlinear way
reaction. Diffusion and reaction couple in a nonlinear way
to give the unusual
to give the unusual behaviorbehavior observed. Understanding observed. Understanding such
such behaviorbehavior will certainly require the more fundamental will certainly require the more fundamental model of diffusion coefficients
Some Examples (#6)
Some Examples (#6)
#6. Flavor retention. When food products are spray-dried, they lose a lot of flavor. However, they lose less than would be expected on the basis of the relative vapor pressures of water and the flavor compounds. The reason apparently is that the drying food often forms a tight gellike skin across which diffusion of the flavor compounds is inhibited. What diffusion model should you use to study this effect?
Solution
Solution
:
:
Because spray
Because spray--drying is a complex, industrialdrying is a complex, industrial--scale process, scale process, it is usually
it is usually modeledmodeled using mass transfer coefficients. using mass transfer coefficients. However, in this case you are interested in the inhibition
However, in this case you are interested in the inhibition
of diffusion. Such inhibition will involve the sizes of pores
of diffusion. Such inhibition will involve the sizes of pores
in the food and of molecules of the
in the food and of molecules of the flavorflavor compounds. compounds. Thus you should use the more basic diffusion model,
Thus you should use the more basic diffusion model,
which includes these molecular factors
Some Examples (#7)
Some Examples (#7)
#7.
#7. ScaleScale--up of wet scrubbers You want to use a wet scrubber to remove up of wet scrubbers You want to use a wet scrubber to remove sulfursulfur oxides from the flue gas of a large power
oxides from the flue gas of a large power plant.Aplant.A wet scrubber is essentially wet scrubber is essentially a large piece of pipe set on its end and filled with inert ceram
a large piece of pipe set on its end and filled with inert ceramic material. You ic material. You pump the flue gas up from the bottom of the pipe and pour a lime
pump the flue gas up from the bottom of the pipe and pour a lime slurry slurry down from the top. In the scrubber, there are various reactions,
down from the top. In the scrubber, there are various reactions, such assuch as::
Solution
Solution
:
:
This situation is complex because of the chemical reactions and
This situation is complex because of the chemical reactions and the irregular the irregular flows within the scrubber. Your first try at correlating your da
flows within the scrubber. Your first try at correlating your data should be ta should be a model based on mass transfer coefficients. Should these correl
a model based on mass transfer coefficients. Should these correlations ations prove unreliable, you may be forced to use the more difficult di
prove unreliable, you may be forced to use the more difficult diffusion ffusion model
model..
The lime reacts with the
The lime reacts with the sulfursulfur oxides to make an insoluble precipitate, oxides to make an insoluble precipitate, which is discarded. You have been studying a small unit and want
which is discarded. You have been studying a small unit and want to use to use these results to predict the
these results to predict the behaviorbehavior of a larger unit. Such an increase in of a larger unit. Such an increase in size is called a scale
size is called a scale--up. Should you make these predictions using a model up. Should you make these predictions using a model based on diffusion or mass transfer coefficients?
Syarat:
1. Tidak mudah menguap 2. Tidak korosif
3. Tidak beracun 4. Tidak eksplosif
5. Tidak pekat Æ afinitas rendah
6. Tidak reaktif permanen Æ kesetimbangan
Perlu diingat:
1. Jika komponen gas yang diabsorpsi (absorptif/absorbat) bersifat
ASAM (CO2, H2S, SOx, NOx, dlsb), maka dipilih pelarut (ABSORBEN) yang bersifat BASA (K2CO3/Na2CO3, MEA, DEA, MDEA, dll).
2. Jika sebaliknya, absorbat bersifat BASA (NH3), maka dipilih pelarut ASAM (HCl, Asam Sitrat, dll).
TUJUAN/ARGET: Luaran Operasi Absorpsi dari kuliah ini?
1. Bagaimana dengan pemilihan atau penentuan “spesifikasi” pelarut (absorben)?
2. Bagaimana menghitung konsentrasi/fraksi gas dan cairan dalam operasi absorpsi?
3. Bagaimana memilih operasi absorpsi: kondisi kesetimbangan atau hukum laju? ¨ Apakah Hukum Henry berlaku?
4. Bagaimana menghitung “Jumlah Tahap” dan atau “Jumlah Talam” dalam Kolom Absorpsi?
5. Bagaimana caranya untuk “Kolom Packing” (Kolom Isian)? 6. Bagaimana caranya untuk “Kolom Talam” (Tray Column)? 7. Bagaimana menentukan GEOMETRI menara ABSORPSI? 8. Apakah ada “analogi” antara ABSORPSI dan STRIPPING
Beberapa Model Kolom Absorpsi
Beberapa Model Kolom Absorpsi
A. Kolom Talam
A. Kolom Talam (Tray-type Plate
Columns)
– Pengontakan Gas (Absorbat) dan Cairan (Absorben) secara COUNTERCURRENT
– Pengontakan terjadi dalam
cairan (absorben) di atas
talam
• Cairan mengalir “sejajar” atau PARALEL dengan talam
• Gas mengalir tegak-lurus terhadap talam
PERFORATED TRAY
OVERFLOW WEIR LIQUID FLOW
Rancangan Talam (
Tray
)
Perancangan Talam
Perancangan Talam
Perancangan Talam
B. Kolom Isian
B. Kolom Isian
(Packed Columns)
• Aliran COUNTERCURRENT antara
GAS dan CAIRAN (Absorben)
• Pengontakan pada “antarmuka”
(interface) CAIRAN/GAS pada
PACKING
• CAIRAN mengalir pada permukaan
PACKING dengan pola umum
menuruni kolom
• GAS mengalir mengalir di “celah-celah”
(ruang kosong) dalam UNGGUN ISIAN
(packing) dengan pola aliran menaiki
kolom
• Jenis PACKING:
– Acak (random)
UNGGUN
Packing
• Dipasang dalam formasi
“penampang unggun”
• Zona (Pelat) Distribusi
berada di antara 2
penampang unggun
• Aliran “relatif” menentukan
HIDRODINAMIKA Kolom
• Kasus Pembatas:
– Genangan (FLOODING)
– Desisan (WEEPING)
LIQUID IN GAS OUT PACKED SECTION DISTRIBUTION PLATEBeberapa Rancangan
Beberapa Rancangan
RANDOM PACKING
RANDOM PACKING
• BENTUK:
– RINGS
– SADDLES
– Lainnya
• MATERIAL:
– LOGAM
– KERAMIK
– PLASTIK
SPESIFIKASI UNGGUN
SPESIFIKASI UNGGUN
Random
Random
PACKING
PACKING
• DIAMETER
NOMINAL
• FRAKSI KOSONG
(void fraction)
• BERAT RUAH
(bulk weight )
Raschig RingProf. Dr. Ir.
Prof. Dr. Ir. SetijoSetijo BismoBismo, DEA., DEA. DTK
DTK –– FTUIFTUI
Selasa, 27 Oktober 2015
1 N+ V, y 1 V, y 0 L, x N L, x
Skematisasi Operasi Absorpsi
CONTOH: Soal #1
CONTOH: Soal #1
Pada tabel di bawah ini diberikan data kelarutan gas SO dalam air murni pada suhu 303 K (30 °C) dan 2
tekanan udara 101,3 kPa (760 mmHg atau setara dengan 760 Torr).
Tabel 1. Data kesetimbangan SO2 dalam H O2
2 SO C (g 2 SO per 100 g H O2 ) 2 SO p (tekanan parsial 2 SO ) y (fraksi mol 2 SO dalam gas) x
(fraksi mol SO2 dalam cairan)
0,5 6 kPa (42 Torr) 1,0 11,6 kPa (85 Torr) 1,5 18,3 kPa (129 Torr) 2,0 24,3 kPa (176 Torr) 2,5 30,0 kPa (224 Torr) 3,0 36,4 kPa (273 Torr)
Dari sistem larutan SO2 − H O2 seperti di atas, maka: (a). Hitunglah y dan x !
(b). Plot diagram kesetimbangan yang terbentuk !
CONTOH: Soal #1
CONTOH: Soal #1
Jawaban:
Sistematika jawaban soal ini diberikan dalam beberapa tahap (langkah) yang diharapkan dapat mempermudah para mahasiswa untuk mempelajari dan memahaminya.
Dalam tahapan 1 dan 2 di bawah ini, dilakukan konversi data untuk konsentrasi dari SO dalam 2
air (H O ) dan tekanan parsial dari 2 SO dalam 2 H O ke dalam fraksi molar. 2
Tahap X: menghitung fraksi mole dari SO dalam fasa gas, y , dengan cara membagi tekanan 2
parsial gas SO dengan tekanan total dari sistem. 2
2 SO T p y p = 6 101, 3 0, 06 kPa y kPa = =
Harga-harga fraksi mole dari SO dalam fasa gas ( y ) tersebut di atas kemudian 2
CONTOH: Soal #1
CONTOH: Soal #1
Tahap Y: menghitung fraksi mole dari absorbat SO dalam fasa cair, 2 x , dengan cara membagi
jumlah mole SO yang terlarut dalam larutan air (2 H O ) dengan jumlah mole total dari2
cairan sistem.
2
2 2
jumlah mole dalam larutan
jumlah mole dalam larutan jumlah mole SO
x
SO H O
=
+
dalam hal ini:
jumlah mole SO dalam larutan = 2 2
2
64 g
SO
C
SO per 100 g H O 2
jumlah mole H O sebagai pelarut = 2 2
2 100 g sebagai pelarut 18 g per mole H O H O maka 2 2 64 64 5, 55 0, 5 64 0, 5 64 5, 55 0, 0014 SO SO C x C = + = + =
CONTOH: Soal #1
CONTOH: Soal #1
Harga-harga fraksi mole dari SO (sebagai absorbat) dalam fasa cair (2 x )
tersebut disusun juga dalam tabel jawaban seperti di bawah ini.
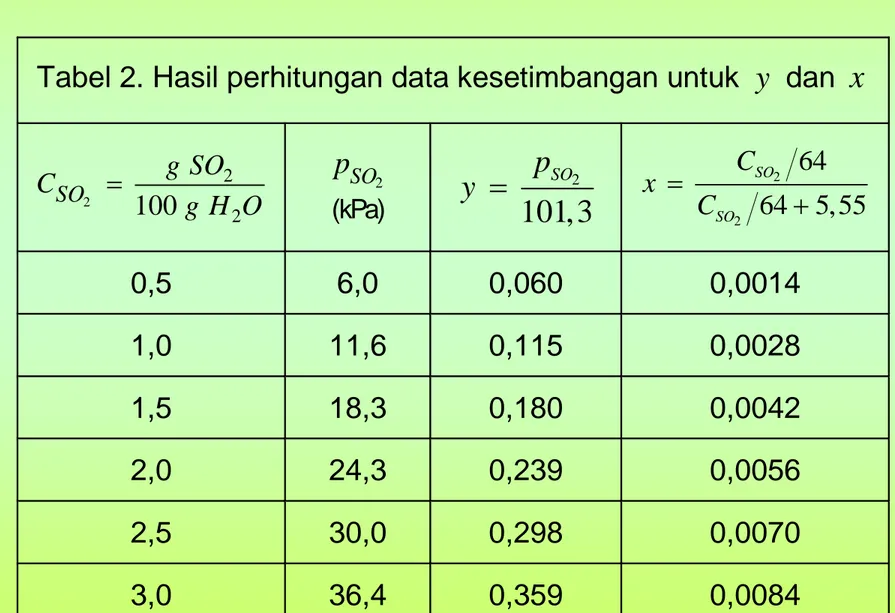
Tabel 2. Hasil perhitungan data kesetimbangan untuk y dan x
2 2 2 100 SO g SO C g H O = pSO2 (kPa) 2 101, 3 SO p y = 2 2 64 64 5, 55 SO SO C x C = + 0,5 6,0 0,060 0,0014 1,0 11,6 0,115 0,0028 1,5 18,3 0,180 0,0042 2,0 24,3 0,239 0,0056 2,5 30,0 0,298 0,0070 3,0 36,4 0,359 0,0084
CONTOH: Soal #1
CONTOH: Soal #1
Tahap Z: Mengalurkan (plotting) harga-harga fraksi mole SO2 dalam fasa gas (= y ) terhadap
fraksi mole SO yang terlarut dalam fasa cair (=2 x), yang hasilnya dapat dilihat
pada grafik di bawah ini.
x y 0,06 0,0014 0,115 0,0028 0,18 0,0042 0,239 0,0056 0,298 0,007 0,359 0,0084 0 0,001 0,002 0,003 0,004 0,005 0,006 0,007 0,008 0,009 0 0,1 0,2 0,3 0,4
CONTOH: Soal #1 (bagian akhir)
CONTOH: Soal #1 (bagian akhir)
Hasil pengaluran (plotting) y vs x seperti di atas, ternyata memberikan suatu garis (yang mendekati atau hampir) lurus, yang berarti bahwa Hukum HENRY dapat diterapkan dalam sistem ini. Kelandaian kurva (slope) di atas dapat dihitung sbb:
0, 239 0,180 42, 7 0, 0056 0, 0042 y slope m x Δ − = = = = Δ −
Periksalah, apakah harga ‘slope’ di atas adalah ‘konstan’ untuk setiap titik ?