FINAL PROJECT
DESIGNING A CHLOROFORM PLANT
USING ACETONE AND CHLORINE
WITH CAPACITY 19,000 TONNES PER ANNUM
By :
QOMAROH
D 500 112 004
Supervisor :
1. Muhammad Mujiburrohman, S.,T,M.,Eng,Phd
2. Emi Erawati, S.,T, M.,Eng
CHEMICAL ENGINEERING DEPARMENT ENGINEERING FACULTY
ABSTRACT
Development in construction which keeps on increasing each year is also followed by increases in the need of society. Indonesia still has not built any chloroform manufacturers. This makes development of chloroform manufacturers in Indonesia will have a good prospect as it is very profitable and able to reduce dependence on imports of chloroform as well as to diversify products with high economic values which in turn add to state revenues and provide employment. Chloroform is popular for its use as an anesthetic, despite its wider use as a nonpolar solvent in laboratories or by industries.
To meet the need of society for chloroform, Indonesia is still importing from other countries. the manufacturer capacity is then determined to reach 19,000 in the Cilegon,Banten. Chloroform produce by aceton and chlorine. Reaction between acetone 1294.227 kg/annum and chlorine 12942.272 kg/annum using reactor that have agitator and there is a heating coil at temperature 50oC and pressure 1 atm also 2 hours for reaction. Besides being the main product, chloroform within reactor also produces calcium acetate Ca(CH3COO)2, calcium
hydroxide (Ca(OH)2), calcium chloride (CaCl2).with area of plant is 48.732 m2 ,
this plant will be manufacture at 2015.
From economic analysis can get the ROI (Return on Investment) before and after tax are 136.429% and 95.374%, POT (Pay OutTime) before and after tax are 0.68 years and 0.95 years, BEP (Break-evenPoint) 41.31%, and SDP (Shutdown Point) 35.72%.While DCF (Discounted Cash Flow) as 45.36%. From the economic analysis, this plant recomended for manufacture.
CHAPTER I. OVERVIEW
1.1 Background
Development in construction which keeps on increasing each year is also followed by increases in the need of society. One of the promising industries in the field of chemical engineering is chloroform. So far, Indonesia still has not built any chloroform plants. This makes development of chloroform manufacturers in Indonesia will have a good prospect.
Molecular formula of chloroform is CHCl3. At normal pressure and
temperature, it is a clear liquid with a typical smell. Even though the need for chloroform in Indonesia continues to increase over time, Indonesia remains highly relying on imports from abroad to satisfy the need.
Chloroform is popular for its use as an anesthetic, despite its wider use as a nonpolar solvent in laboratories or by industries.
1.2 Purpose
Manufacturing of chloroform plant, have a purpose : 1. reduce dependence on imports of chloroform
2. diversify products with high economic values which in turn add to state revenues and provide employment
CHAPTER II LITERATURE REVIEW
2.1 The Designed Production Capacity
Some factors taken into account to determine the designed capacity of a chloroform manufacturer are :
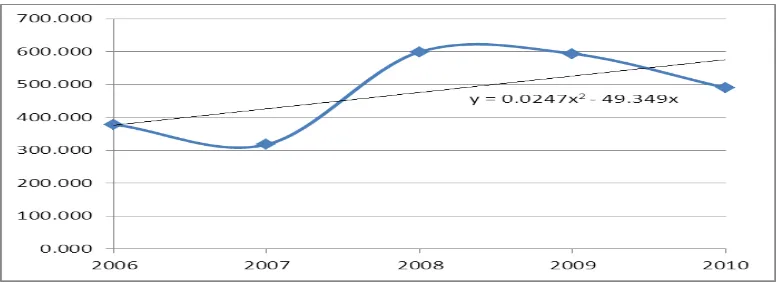
a. The Need for Chloroform in Indonesia, can shown from this table 2.1 and figure 2.1 :
Tabel 1.1 Data Imports chloroform in Indonesia from 2006 to 2010. Years Chloroform imports (ton)
2006 378,733 2007 317,820 2008 599,266 2009 593,659 2010 490,019
Figure 1.1 Graph need of chloroform in Indonesia
And get the equation is : y = 0,0247x2– 49,349 x
b.The Need for Chloroform Overseas
Years Ton
2006 331.791 2007 338.847 2008 345.909 2009 352.979 2010 360.055
Using the factors above and the projection based on the calculation of the of The Processincrease in chloroform imports per annum, the designed production capacity in 2017 which amounts to 19,000.
2.2Types of the Processes
Types of process to produce chloroform, dived by : 1 Photochemical Chlorination
2 Reduction of Carbon Tetrachloride 3 Reaction between acetone and chlorine.
From types of produce chloroform, with any advantages and disadvantages, so plant design of chloroform choose fourth process, reaction between acetone and chlorine with ratio 0.045 of acetone : 0.453 of chlorine. Ranges of yield that produce is 86 to 91%.
CHAPTER III
RESEARCH METHODOLOGY
3.1 Thermodynamics Review
The determination of exothermic or endothermic reaction is considered from the calculation of standard reaction heat (Hr). For calculation Hr can be
calculated based from Hof data each component and using this formula :
Hr= H reaction equilibrium (K), using :
Go = - R.T.lnK
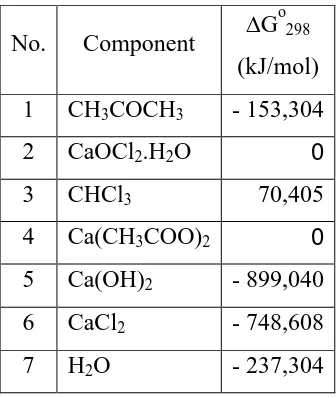
Tabel 2.2 Data of Gibb’s free energy every component at 298K
No. Component G calculate equilibrium constant of the reaction as :
lnKo = -
reaction occurs in the process of chloroform forming is running irreversible.
3.2 Review Kinetics
3.3 Main Equipment Spesification
1 Reactor Batch Code : R-110
Function : Reaction between chlorine and acetone,will produce chloroform for 2 hours.
Volume : 70.979 m3
Amount : 4 buah (parallel)
Dimension:
Height = 6.30 m Diameter = 4.572 m
Agitator : Turbin
Diameter = 1.524 m Height = 0.305 m Width agitator= 0.381 m Width baffle = 0.457 m
Material : Stainless stell SA 167 type 304
2 Mixer 01
Code : M-110
Function : Dissolving chlorine with water
Type : Vertical cylinder with head and bottom shaped torispherical
Amount : one
Agitator :
Type : marine propeller with 3 blades and 4 baffle Diameter : 1.560 m
Rpm : 47.316 rpm Tenaga motor : 2 HP
3 Coloumn Destillation
Code :D-110
Function :Make a pure chloroform. Type : plate coloumn with sieve tray Condition operation
Pressure : Feed = 1 atm Top = 1 atm Bottom = 1 atm Temperature : Feed = 73oC
Top = 60,5oC Bottom = 99,2oC Shell :
Diameter : Top = 0.928 m Bottom = 0.928 m Thick : Top = 0,0048 m
Bottom = 0,0048 m
Material :Stainless stell SA 167 type 304 Height Shell : 20.05 m
Column Height:16.957 m Thick head : Top = 0,0048 m
Bottom= 0,0048 m Height head : Top = 0,2068 m
Bottom = 0,8683 m
Material :Stainless stell SA 167 type 304 Plate : Type : Sieve tray
Amount plate : 25 Feed plate : 11
4 Decanter
Code : H-110
Function :Separating the main product of byproducts use density. Amount : 12
Diameter : 3.727 m Length : 11.180 m
Material : Stainless stell SA 167 type 30
3.4Operational value
There is fourth process to produce chloroform, as :
1. raw materials preparation stage
Mixing chlorine and water with the ratio 1.36 kg : 3.785 liter water to makes liquid chlorine.
organize the ratio of acetone and chlorine by 0.045 : 0.453 (kg)
2 Reaction Stage
The liquid from the stage of raw material preparation with the ratio 0.045 kg : 0.453 kg (acetone: chlorine) flown to batch reactor.
3 Product Purification Stage
Product from batch reactor is chloroform and side products as calcium acetate, calcium hydroxide, calcium chloride, in decanter (H-110) will be separated by size particle and density.
CHAPTER IV RESULT OF RESEARCH
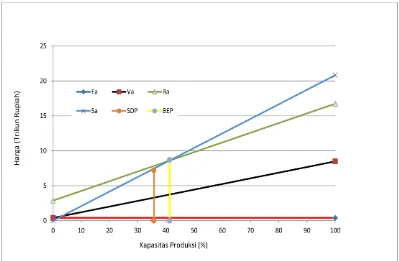
From the economic analysis, can get value of BEP is 41.31%, this value still in the range are 40% - 60%. High of BEP value depend on price of product and raw materials. if price of product more high than raw material so the value of BEP will be decrease, but this is shown the plant profitably.
Value of ROI will be increase if value of BEP decrease. For POT value must bottom for 2 years (Plant with high risk) and in the chloroform plant, POT after tax is 0.95 years and high DCF is 44.50 % with loan in the bank is 25%. So plant of chloroform very profitably to building in Indonesia because can give high advantages and minimmize importing chloroform from overseas.
CHAPTER V CONCLUSION A. Conclusion
From the research of designning chloroform plant from acetone and
chlorine with capacity 19,000 tonnes/annum, so can get the conclusion like
this :
1. Precent Return On Invesment (ROI) before tax is 136.24 %
2. Precent Return On Invesment (ROI) after tax is 95.37%
3. Pay Out Time (POT) before tax is 0.68 years
4. Pay Out Time (POT) after tax is 0.95 years
5. Break-even Point (BEP) is 41.31 %
6. Shoutdown Point (SDP) is 35.72 %
7. Discounted Cash Flow (DCF) is 44.50%.
BIBLIOGRAPHY
Amonette JE, PM Jeffers, O Qafoku, CK, Wietsma, and Truex. 2009. Carbon Tetrachloride and Chloroform Attenuation Parameter Studies:
Heterogeneous Hydrolytic Reactions. PNNL-18735, Pacific Northwest National Laboratory, Richland, Washington.
Aries, R.S., and Newton, R.D. 1955. Chemical Engineering Cost Estimation , Mc Graw-Hill Book Co. Inc, New York.
Badan Pusat Statistik. 2014. Statistik Perdagangan Luar Negeri Indonesia.Jakarta.
Donald, E.G. 1989. Chemical Engineering Economics. Van Nostrond. New York.
Hani Handoko, T. 1990. Manajemen Personalia dan Sumber Daya Manusia. Penerbit Liberty, Jogjakarta.
Ketta, Mc. J.J. and Cunningham, W.A. 1992. Encyclopedia of Chemical Processing and Design. Vol. 40, Marcel Decker, Inc., New York
Keyes, F., and Clark, R.S., 1959, Industrial Chemistry : 4 th edition. John Wiley and Sons, Inc, New York.
Kirk, R.E., and Othmer, V.R. 1998. Encyclopedia of Chemical Technology : 4th ed. John Wiley & Sons Inc., New York
Levenspiel, O.. 1972. Chemical Reaction Engineering : 2nd ed. John Wiley & Sons, Inc., New York.
Perry, R.H. and Green, D.W. 1999. Perry’s Chemical Engineer’s Handbook, 7th ed. McGraw-Hill Book Company, New York
Pudjaatmaka, A.H., Setiono, L. 1984. Buku Teks Analisis Anorganik Makro dan Semimikro. PT Kalman Media Pustaka, Jakarta.
Severn, W.H., Degler, H.E., and Miles, J.C. 1954. Steam, Air and Gas Power : 5th ed. John Wiley and Sons inc., New York.
Smith, J.M. and Van Ness, H.C. 1996. Introduction to Chemical Engineering Thermodynamics, Prentice Hall, Englewood Cliffs., New Jersey.