Preparation and characterization of nanosize spinel Ni
0.9Fe
2Cu
0.1O
4using pectin as binding agent
Rodhiansyah Djayasingaaand Rudy SitumeangbaGraduate Student in Department of Chemistry, University of Lampung bDepartment of Chemistry, University of Lampung
Jln. Prof. Soemantri Brodjonegoro No. 1 Bandar Lampung 35145, Indonesia
Abstract
Ni0.9Fe2Cu0.1O4nanomaterial have been prepared using a sol-gel method. Preparation
of material was carried out by dissolving nitrate salts of iron, cobalt and nickel, in pectin solution and then the sample was stirred throughly using magnetic stirrer while adjusting pH to 11. After freeze-drying process, the sample was subjected to calcination treatment and subsequently characterized using the techniques of X-ray diffraction (XRD), Debye Scherrer Methods, PSA, and DT-TG analysis. The results of XRD characterizationand Rietveld calculation indicated that materials consist of four crystalline phases, such as, CuFe2O4, Cu0,86Fe2,14O4, NiFe2O4, and NiO. The first three
crystalline phases is superimposed. DT-TGA result showed that spinel Ni0.9Fe2Cu0.1O4
formed at 400oC. Then, PSA determination proved that the grain size of spinel ferrites is
a range of 30 95.2 nm as much as 21%. Crystallite size calculation using Scherrer equation, proved that the size is 35.42 nm and its size increased as temperature calcination inclined.
Keywords :Nanomaterial, BrØnsted Lowry and Lewis acid sites, spinel ferrites
1. Introduction
Spinel compounds have attracted great attention due to their many enormous properties for diverse industrial field applications, such as electronic devices [Waqas et al., 2012; Roy et al., 2012], magnetic materials [Niyaifar et al., 2014; Qian et al., 2010 ], pigments [Candeiaa et al., 2004; Imanaka et al., 2015], and catalysis [Daadmehr et al., 2013; Abelo et al., 2011, Situmeang et al., 2011]. In general, the applications of this spinel compound is governed by peculiar properties, which in turn depends on the chemical composition and microstructure [refs]. In general, the structural formula of spinel compound is symbolized as AB2O4for II III cation systems or A2BO4for II-IV, II-III, I-III/IV cation systems (Le et al., 2014;
Hill et al., 1979). Furthermore, the structural formula of spinel compound such as ferrites can be written as (M2+
1 Fe3+ )[M2+ Fe3+2 ]O4, where parentheses and square brackets denote
cation sites of tetrahedral (A) and octahedral (B) coordination, respectively. , which is determined by the preparation process, represents the so called degree of inversion defined as the fraction of the (A) sites occupied by Fe3+cations (Corrias et al., 2008; Lazarevi et al.,
2012; Sutka et al., 2012).
materials are really important and leads to the change of its properties that are needed to the various current and future specialized applications (Vanaja et al., 2013).
Spinel ferrites of Ni1-xFe2CuxO4 (x = 0.1 1) prepared by various method have been
studied by several scientists (Kumar et al., 2012; Murthy et al., 2009; Daadmehr et al., 2013) and proved that the addition of Cu cation into spinel nickel ferrite will have a significant effect on the electromagnetic properties and catalytic functions. In this study we would like to report the preparation of nano spinel nickel copper ferrite, Ni0.9Fe2Cu0.1O4prepared using
sol-gel method and pectin as a binding agent. The materials obtained are characterized using XRD to identified the phases formed, PSA to know the particles sizes, Scherrer method to calculate crystallite sizes, and FTIR to identified both functional groups and bond formations.
2. Materials and Methods
2.1 Materials
Materials used in this work are pectin powder, Ni(NO3)2.6H2O (Merck, 99%),
Fe(NO3)3.9H2O (Merck, 99%), Cu(NO3)2.3H2O (Merck, 99%), pyridine (C5H5N, J.T Baker), NH3
(Merck, 99%), and aquadest.
2.2 Instrumentations
The instruments used for characterization were Fourier Transform Infrared (FTIR) spectrometer (Shimadzu Prestige-21) for identifying the presence of functional groups, and Differential Temperature and Gravimetry analysis (DT-GA) for elucidating the formation process . Then, a Philips X-ray diffractometer (XRD) model PW 1710 with Cu-K radiation was used for structural and crystalline phases identification and Particle Size Analyzer (PSA) for measuring particle size distribution.
2.3 Preparation of Ni
0.9Fe
2Cu
0.1O
4nanomaterial
Stoichiometric amount of Ni (II) nitrate hydrates, Cu (II) nitrate hydrates and Fe (III) nitrate hydrates were dissolve in distilled water, having compositions Ni0.9Fe2Cu0.1O4 under
magnetic stirring for 1 hour, respectively, followed by mixing each solution to make final solution weight ratio between nitrates to pectin is 3:2. Adjust the pH=11 in the above solution by addition of ammonia, and heat it at 80oC with continue stirring to form viscous gel. Dried
the gel using freeze dryer for 7 hours to form the precursors networks and calcined at 600 and 800oC for 3 hours. Finally Cu doped Ni - ferrite nanoparticles has prepared.
2.4 Characterization of Ni
0.9Fe
2Cu
0.1O
4nanomaterial
Differential Temperature and Gravimetry Analysis
Sample of approximately 5 6 mg precursor was placed in Pt-sample compartment and the instrument was carried out under a flowing nitrogen atmosphere (50 ml/min, SII TG/DTA 7300). Then, scan analysis was worked in the range of 25 to 600oC with ramp of 5oC min-1.
Particle Size Analysis
Particle size distribution of the solid sample is obtained by using the infra-red scattered through sample particles in ethanol media which was responding to the brownian movement on Beckman Coulter Delsa nano. The principle of this analysis is accordance with
The range of particle size could be measured is 0.1 nm to 10 m. The result of particle size distribution is both calculated and analysed by using statistical method with mean,median
andmodulusparameters (Malvern Instruments, 2012).
X-ray diffractogram analysis
X-ray powder diffraction pattern of the sample was recorded from 2= 10 to 90oon
a Philips diffractometer Model PW 1710 using Cu Kradiation at a step 0.02oper second. The
phase identification was performed using search and match method by comparing the x-ray pattern of the sample to those of the standards in the COD using Phase Identification from Powder Diffraction program Version-2. The particle size was also determined using Debye Scherrer method (Cullity, 1978).
Acid sites analysis ofNi0.9Fe2Cu0.1O4
After heating at 120oC, sample was transferred into a crucible and placed in
vaccumized dessicator. Pyridine was transferred into another crucible and placed in the dessicator to allow the vapour of the pyridine to contact with the sample. After 24 hours, the sample was taken from dessicator and left on open air for 2 hours to expell the physically adsorbed pyridine from the sample. Finally, the sample was analyzed using the FTIR spectroscopy. The analysis was conducted by grinding the sample with KBr of spectroscopy grade, and scanned over the wave number in the range of 4000 400 cm 1 (Parry, 1963;
Ryczkowski, 2001).
3. Results and Discussion
3.1 Differential Temperature and Gravimetry Analysis
The precursor of Ni0.9Fe2 Cu0.1O4 nanomaterial prepared were characterized using
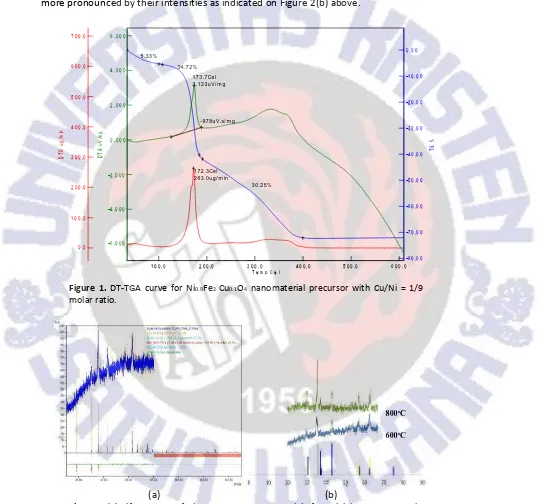
thermal analysis techniques such as differential temperature and thermal gravimetric analysis (DT-TGA). Thermal gravimetric analysis was used to measure the losses of weight as a function of temperature. The TGA results for the 4.8 h aged precursor containing [Cu]/[Ni]=1/9 molar ratio is shown in Figure 1.
There is a gradual weight loss upon heating to about 200°C; above this temperature there is a crucial weight loss until 400oC. During the first period of the weight loss, the
exothermic process is occured at 173.7oC and the energy of 3.123Vs/mg. The first weight
loss with temperatures range of 100 200°C and is due to the removal of absorbed water in pectin networks. The second period of weight losses with temperatures at around 200 400°C, are considered to be due to the decomposition of pectin, and nitrate precursors, so that the decomposition at these high temperature regions produce water, carbon dioxides and nitrogen oxides simultaneously. Above 400oC, there was no weight loss and the
formation of Ni0.9Fe2Cu0.1O4nanomaterial was started.
3.2 X-ray diffractogram analysis
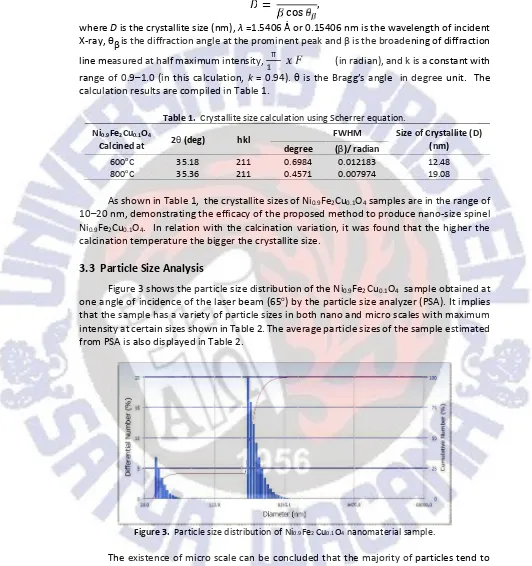
The prepared sample was characterized by Philips PW-1710 X-ray diffractometer using Cu-Kradiation ( =1.5406 ) source. The X-ray diffraction pattern of the prepared sample is
shown in Figure 2.
The diffraction pattern of Ni0.9Fe2Cu0.1O4 together with some standards related to the
found that the major phase is spinel NiFe2O4 (COD-96-230-0290), CuFe2O4
(COD-96-901-2439) and Ni1.43Fe1.7O4 (COD-96-100-6117). Additional phase identified is spinel NiFe2O4
(COD-96-230-0296) as a minor phase. In general, it can be implied that both NiFe2O4 and
CuFe2O4 crystalline phases are superimpossed. By increasing the calcination temperature,
the formation of both CoFe2O4(JCPDF no. 34-0425) and NiFe2O4(JCPDF no. 10-0325) were
more pronounced by their intensities as indicated on Figure 2(b) above.
Figure 1.DT-TGA curve for Ni0.9Fe2Cu0.1O4 nanomaterial precursor with Cu/Ni = 1/9
molar ratio.
(a) (b)
Figure 2.(a) Difractogram of Ni0.9Fe2Cu0.1O4nanomaterial after calcining at 600oC and
(b) Ni0.9Fe2Cu0.1O4nanomaterial after calcining 600 and 800oC.
Moreover, the crystallite size of Ni0.9Fe2Cu0.1O4nanomaterial was calculated from the
most prominent peak (211) of XRD using the Scherrer formula (Cullity, 1978):
=
λcos
,
whereDis the crystallite size (nm), =1.5406 or 0.15406 nm is the wavelength of incident X-ray, is the diffraction angle at the prominent peak and is the broadening of diffraction line measured at half maximum intensity, π (in radian), and k is a constant with range of 0.9 1.0 (in this calculation, k= 0.94). is the Bragg s angle in degree unit. The calculation results are compiled in Table 1.
Table 1. Crystallite size calculation using Scherrer equation.
Ni0.9Fe2Cu0.1O4
Calcined at 2θ(deg) hkl degree FWHM(β)/ radian Size of Crystallite (D)(nm)
600oC 35.18 211 0.6984 0.012183 12.48
800oC 35.36 211 0.4571 0.007974 19.08
As shown in Table 1, the crystallite sizes of Ni0.9Fe2Cu0.1O4samples are in the range of
10 20 nm, demonstrating the efficacy of the proposed method to produce nano-size spinel Ni0.9Fe2Cu0.1O4. In relation with the calcination variation, it was found that the higher the
calcination temperature the bigger the crystallite size.
3.3 Particle Size Analysis
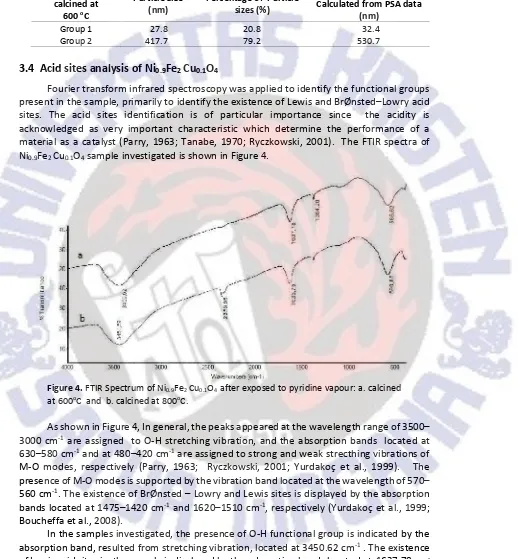
Figure 3 shows the particle size distribution of the Ni0.9Fe2Cu0.1O4 sample obtained at
one angle of incidence of the laser beam (65o) by the particle size analyzer (PSA). It implies
that the sample has a variety of particle sizes in both nano and micro scales with maximum intensity at certain sizes shown in Table 2. The average particle sizes of the sample estimated from PSA is also displayed in Table 2.
Figure 3. Particle size distribution of Ni0.9Fe2Cu0.1O4nanomaterial sample.
Table 2.Particle size distribution and the average particle sizes of Ni0.9Fe2Cu0.1O4sample
estimated by PSA.
Ni0.9Fe2Cu0.1O4
calcined at
600oC
Particle Size
(nm) Percentage of Particlesizes (%)
Average particle size Calculated from PSA data
(nm)
Group 1 27.8 20.8 32.4
Group 2 417.7 79.2 530.7
3.4 Acid sites analysis of Ni
0.9Fe
2Cu
0.1O
4Fourier transform infrared spectroscopy was applied to identify the functional groups present in the sample, primarily to identify the existence of Lewis and BrØnsted Lowry acid sites. The acid sites identification is of particular importance since the acidity is acknowledged as very important characteristic which determine the performance of a material as a catalyst (Parry, 1963; Tanabe, 1970; Ryczkowski, 2001). The FTIR spectra of Ni0.9Fe2Cu0.1O4sample investigated is shown in Figure 4.
Figure 4.FTIR Spectrum of Ni0.9Fe2Cu0.1O4after exposed to pyridine vapour: a. calcined
at 600oC and b. calcined at 800oC.
As shown in Figure 4, In general, the peaks appeared at the wavelength range of 3500 3000 cm-1are assigned to O-H stretching vibration, and the absorption bands located at
630 580 cm-1and at 480 420 cm-1are assigned to strong and weak strecthing vibrations of
M-O modes, respectively (Parry, 1963; Ryczkowski, 2001; Yurdakoç et al., 1999). The presence of M-O modes is supported by the vibration band located at the wavelength of 570 560 cm-1. The existence of BrØnsted Lowry and Lewis sites is displayed by the absorption
bands located at 1475 1420 cm-1and 1620 1510 cm-1, respectively (Yurdakoç et al., 1999;
Boucheffa et al., 2008).
In the samples investigated, the presence of O-H functional group is indicated by the absorption band, resulted from stretching vibration, located at 3450.62 cm-1. The existence
of Lewis acid sites in the sample is displayed by the adsorption bands located at 1637.78 cm -1which indicate that the pyridine was bound to the surface of the sample by coordination
absorption bands located at 1384.28 cm-1. By comparing the intensities of the absorption
bands associated with Lewis and BrØnsted Lowry acid sites, it can be concluded that the acid characteristic of the sample is dominated by Lewis acid. In the fingerprint region of the spectra, the absorption band representing strecthing vibration of Fe-O and bending vibration of Ni-O and Cu-O was detected at 586.62, 450 and 430 cm-1(Ryczkowski, 2001 ; Situmeang
et al., 2015b), suggesting the existences of Fe-O-Ni and Fe-O-Cu bond which confirms the
formation of Ni0.9Fe2Cu0.1O4structure as expected.
4. Conclusion and remarks
This current study demonstrated the potential of pectin solution as a binding agent for preparation of nano-size materials using sol gel method. The XRD results revealed that the crystallite size of the Ni0.9Fe2Cu0.1O4sample prepared is in the range of 12 to 20 nm. The
samples were found to exhibit Lewis and BrØnsted Lowry acid characteristics, with Lewis acid as the dominant site, as revealed by the FTIR analyses. The agglomeration of Ni0.9Fe2
Cu0.1O4particles reflected by a microsize distribution in PSA is characterized by the existence
of particles with varied sizes and shapes.
Acknowledgment
The authors wish to thank and appreciate the Health Ministry, Republic of Indonesia for research funding provided through Center for Standard and Certification, Health Polytechnics Program, Bandar Lampung.
References
Boucheffa, Y., Benaliouche, F., Ayrault, P., Mignard, S., & Magnoux, P. (2008). NH3-TPD and FTIR
Spectroscopy of pyridine adsorption studies for characterization of Ag- and Cu- exchanged X-zeolites.Microporous and Macroporous Material,113(1 3), 80 88.
Candeiaa, R.A., Bernardi, M.I.B., Longoc, E., Santos, I.M.G., & Souzaa, A.G. (2004). Synthesis and characterization of spinel pigment CaFe2O4obtained by the polymeric precursor method.Mater.
Lett.,58, 569 572.
Cullity, B.D. (1978). Elements of X-ray diffraction (2nd Ed.). Addison Wesley, London.
Corrias, A., Carta, D., Loche, D., Mountjoy, G., & Navarra, G. (2008). NiFe2O4nanoparticles dispersed
in an aerogel silica matrix: An X-ray absorption study.J. Phys. Chem. C,112, 15623 15630. Daadmehr, V., Akbarnejad, R. H., Rezakhani, A. T., Tehrani, F. S., Aghakhani, F., & Gholipour, S. (2013).
Catalytic activity of the spinel ferrite nanocrystals on the growth of carbon nanotubes. J.
Supercond. Nov. Magn.,26(2), 429 435.
Hill, R.J., Craig, J.R., & Gibbs, G.V. (1979). Systematics of the spinel structure type. Phys. Chem.
Minerals,4(4), 317 339.
Imanaka, N., Wendusu, Yoshida, T., & Masui, T. (2015). Novel environmentally friendly inorganic red pigments based on calcium bismuth oxides.J. Adv. Ceram.,4(1), 39 45.
Kumar, G.R., Kumar, K.V., & Venudhar, Y.C. (2012). Synthesis, structural and magnetic properties of copper substituted nickel ferrites by Sol Gel method.Mater. Scie. Appl.,3(2), 87 91.
Le, M.-V., Dao, H.-A., Ken-Hirota, Masaki-Kato, Phuo, Huynh-Ky, H. (2014). Preparation and characterization of spinel co-doped MnAl2O4obtained by Sol Gel method.Proceedings of the 3rd
World Conference on Applied Sciences, Engineering & Technology, Nepal, 709 715.
Murthy, Y.L.N., Viswanath, I.V.K., Rao, T.K., & Singh, R. (2009). Synthesis and characterization of nickel copper ferrite.Int.J. ChemTech Res.,1(4), 1308 1311.
Niyaifar, M., Nazari, S., & Mohammadpour, H. (2014). Magnetic and structural studies of Mg 1-xZnxFe2O4.Proceedings of AES-ATEMA 18thInt. Conf.,Canada, 203 212.
Parry, E.P. (1963). An Infrared study of pyridine adsorbed on acidic solids characterization of surface acidity.J. Catal.,2(5), 371 379.
Perego, C., & Villa, P. (1997). Catalyst preparation methods.Catal. Today,34, 281 305.
Qian, F.Z., Jiang, J.S., Jiang, D.M., Wang, C.M., & Zhang, W.G. (2010). Improved multiferroic properties and a novel magnetic behavior of Bi0.8La0.2Fe1-xCoxO3nanoparticles, J. Magn. Magn. Mater,
322(20), 3127 3130.
Malvern Instruments (2012). A basic guide to particle characterization. Malvern Instrument Limited, UK. Retreived from http://www.atascientific.com.au/publications/wp-content/uploads/2012/ 07/MRK1806-01-basic-guide-to-particle-characterisation.pdf.
Roy, A., Gupta, R., & Garg, A. (2012). Multiferroic memories.Adv. Condens. Matter Phys.,2012, 1 12. Ryczkowski, J. (2001). IR spectroscopy in catalysis.Catalysis Today,68, 263 381.
Situmeang, R., Wibowo, S., Simanjuntak, W., Supryanto, R., Amalia, R., Septanto, M., Manurung, P., & Sembiring, S. (2015a). Characteristics of nanosize spinel NixFe3-xO4prepared by Sol Gel method
using egg white as emulsifying agent.J. Indones. Chem.,15(2), 116 122.
Situmeang, R., Manurung, P., Sulistiyo, S. T., Hadi, S., Simanjuntak, W., & Sembiring, S. (2015b). Sol Gel method for preparation of nanosize NiFe2-xCoxO4using egg white.Asian J. Chem.,27(3), 1138
1142.
Sutka, A., Borisova, A., Kleperis, J., Mezinskis, G., Jakovlevs, D., & Juhnevica, I. (2012). Effect of nickel addition on colour of nanometer spinel zinc ferrite pigments.J. Austral. Ceram. Soc.,48(2), 150 155.
Tanabe, K. (1970).Solid acids and bases: their catalytic properties. Kodansha, Tokyo.
Vanaja, M., Gnanajobitha, G., Paulkumar, K., Rajeshkumar, S., Malarkodi, C., & Annadurai, G. (2013). Phytosynthesis of silver nanoparticles by Cissus quadrangularis: influence of physicochemical factors.J. Nanostruct. Chem.,3(17), 1 8.
Waqas , H., Qureshi, A.H., Subhan, K., & Shahzad, M. (2012). Nanograin Mn Zn ferrite smart cores to miniaturize electronic devices.Ceram. Internat.,38(2), 1235 1240.
Yehia, M., Labib, Sh., & Ismail, S.M. (2014). Structural and magnetic properties of nano-NiFe2O4
prepared using green nanotechnology.Physica B,446, 49 54.