SWUP
Inflow and outflow of currency forecasting
using calendar variation model based on time series regression
Lailatul Urusyiyah, Agus Suharsono, Suhartono
Institut Teknologi Sepuluh Nopember, Sukolilo, Surabaya 60111, Indonesia
Abstract
Inflow and outflow of currency in Indonesia sometimes it’s happened because of any other event such us calendar variation that cause by national holiday in Indonesia. Because inflow and outflow are time series data, so in this observation used calendar variation model based on time series regression. The purpose of this study was to examine the effectiveness of calendar variation model based on time series regression in improving the accuracy of the realization of the provision of the inflow and outflow of currency in Indonesia. Result in this observation is calendar variation model based on regression time series for inflow series have accuracy values in sample is 68.76%, while the final model for the series outflow have accuracy 65.28%.
Keywords inflow, outflow, time series regression
1. Introduction
Inflow of currency indicate a currency that enters to Bank Indonesia by deposit banking and society. The other way, outflow of currency indicate a currency that leaves from Bank Indonesia by cash banking and society. Inflow and outflow of currency in Indonesia sometimes it’s happened because of any other event such us calendar variation that cause by national holiday in Indonesia. In general, Islamic calendar is also is also a lunar calendar based on twelve lunar months in year of 354 (or 355 days in leap year), used to date events in many Muslim countries, and used by Moslem majority, also uses Islamic calendar, especially in determining religious holidays, such as Eid-holidays.
The most thing that influence inflow and outflow is Idul Fitri which is changeable every year. Because inflow and outflow are time series data, so in this observation used calendar variation model based on time series regression. The purpose of this study was to examine the effectiveness of calendar variation model based on time series regression in improving the accuracy of the realization of the provision of the inflow and outflow of currency in Indonesia.
2.
Materials and methods
2.1 Modeling of time series regression method
Regression in time series context has the same form as general linear regression. By assuming output or dependent series, , ¹ = 1,2, … , , as being influenced by a collection of possible inputs or independent series, where the inputs are fixed and known, this relation can be expressed as linear regression model (Shumway & Stoffer, 2006). If there exist a trend in the data, then we can model as follows:
= ¼+ ¹ + ¸ ,
normal with mean 0 and variance .
Data with seasonal pattern,æ, , æ , , … , æ, , can be written as
= ¼+ æ , + æ, + ⋯ + æ , + ¸ ,
where æ , , æ , , … , æ, are dummy variables for seasonal pattern. For example, in monthly data, there are twelve seasonal dummy variables, one for each month while for quarterly data, three dummy variables are used, one for each quarter.
Data with calendar variation can also be modeled by using regression. Linear regression model for data with calendar variation can be expressed as (Suhartono et al., 2010)
= ¼+ , + , + ⋯ + , + ¸ ,
where , is dummy variable for p-th calendar variation effect. The number of calendar variation effects can be identified based on time series plot of the data. Ljung-Box statistics may be employed to test whether the sequence is white noise, the lags of is used as the input. Selection of the appropriate lags for the model is based on ACF and PACF plot of this error, ¸ .
2.2 Best model criteria
The root mean squared error (RMSE) is employed as an evaluation index for evaluating the performance of the proposed calendar variation models. The RMSE for out-sample data is defined as
ü%æç L = Þ∑°\±›…\o…C\”
7 ,
where is the number of forecast. The RMSE of in-sample data is defined as
ü%æç7= Þ∑°\±›…\o…C\”
7o ,
where in the number of parameters.
2.3 Method
This study uses the inflow and outflow data of currency that recorded each month by Bank Indonesia. The used of time period from January 2003 until December 2014. Stages of the analysis begins by identifying the characteristic pattern of inflow and outflow of currency, followed by determination of dummy variable for trend, seasonal, and calendar variation period, followed by simultaneous estimation of calendar variation model and other pattern, after that diagnostic checks on residual white noise (if the residuals is not a white noise, add significant lags based on ACF and PACF plots of residual), residual normal distribution, and then re-estimate calendar variation effect, other pattern, and appropriate lags simultaneously.
3.
Results and discussion
SWUP
Trend 1 Trend 2 Trend 3
Year
Trend 1 Trend 2 Trend 3
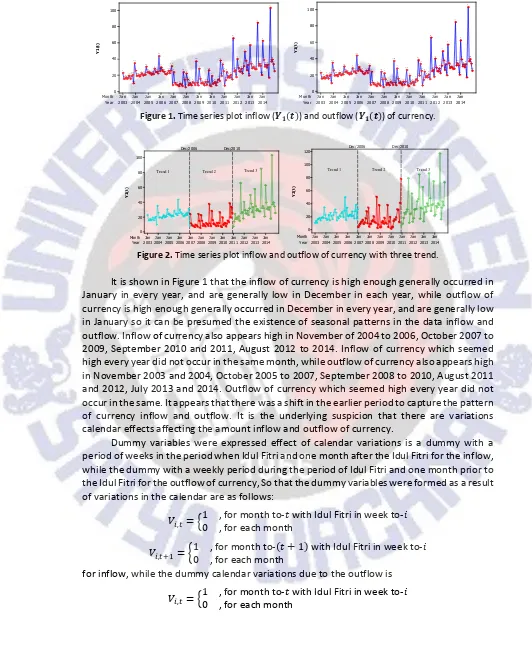
Figure 2. Time series plot inflow and outflow of currency with three trend.
It is shown in Figure 1 that the inflow of currency is high enough generally occurred in January in every year, and are generally low in December in each year, while outflow of currency is high enough generally occurred in December in every year, and are generally low in January so it can be presumed the existence of seasonal patterns in the data inflow and outflow. Inflow of currency also appears high in November of 2004 to 2006, October 2007 to 2009, September 2010 and 2011, August 2012 to 2014. Inflow of currency which seemed high every year did not occur in the same month, while outflow of currency also appears high in November 2003 and 2004, October 2005 to 2007, September 2008 to 2010, August 2011 and 2012, July 2013 and 2014. Outflow of currency which seemed high every year did not occur in the same. It appears that there was a shift in the earlier period to capture the pattern of currency inflow and outflow. It is the underlying suspicion that there are variations calendar effects affecting the amount inflow and outflow of currency.
Dummy variables were expressed effect of calendar variations is a dummy with a period of weeks in the period when Idul Fitri and one month after the Idul Fitri for the inflow, while the dummy with a weekly period during the period of Idul Fitri and one month prior to the Idul Fitri for the outflow of currency, So that the dummy variables were formed as a result of variations in the calendar are as follows:
, = p1
, for month to-¹ with Idul Fitri in week
to-0 , for eachmonth
, " = S10 , for month to-, for eachmonth¹ + 1 with Idul Fitri in week to-for inflow, while the dummy calendar variations due to the outflow is
to-, o = S1
, for month to- ¹ − 1 with Idul Fitri in week
to-0 , for eachmonth
where = 1,2,3,4. While variable stating the positive trend in the data patterns of the inflow and outflow of currency is expressed by t. It can be describe in the Figure 2.
So that the dummy variable stating the trend in the data pattern there tree, while variable stating their seasonal pattern expressed by monthly dummy, ie æ , , æ , , … , æ, . Time series regression models inflow of currency can be presumed as follows.
7, = 0.16¹ − 17.55œ , − 54.58œ‰, + 0.02œ , ¹ + 0.42œ‰, ¹ + 26.04æ ,
+17.71æ , + 16.08æ‰, + 15.66æï, + 14.55æò, + 13.55æÓ, + 17.09æy,
+15.21æ2, + 15.21æ ¼, + 15.11æ , + 9.26æ , + 25.16 ,
+24.44 , + 6.77 ‰, − 8.61 ï, + 5.52 , " + 4.75 , "
+10.71 ‰, " + 34.16 ï, " +
having obtained the alleged models, then the next step is to test the assumption of independent residuals and normal distribution. When they fulfill these assumptions we then carried out the significance of the parameters. The results obtained are
7, = 0.24¹ − 45.46œ‰, − 0.29œ , ¹ + 0.27œ‰, ¹ + 32.97æ , + 20.42æ ,
+18.37æ‰, + 17.74æï, + 16.55æò, + 15.10æÓ, + 19.97æ¡, + 18.92æy,
+19.16æ2, + 20.25æ ¼, + 17.22æ , + 10.46æ , + 24.07 ,
+19.04 , − 9.17 ï, − 10.39 , " + 11.64 , " + 13.94 ‰, "
+41.91 ï, " − 0.26 o ï+ 23.84v¢2,ò − 22.26v¢2¡, + 21.36v¢2,Ó
+31.45v¢, y + 20.56v¢, Ó + m ,
where residual variable that white noise and normal distribution andv / = p1, ¹ =
0, ¹ ≠
For time series regression models outflow of currency can be presumed as follows.
7, = 0.12¹ − 17.71œ , − 59.45œ‰, + 0.09œ , ¹ + 0.54œ‰,¹ + 7.28æ ,
+10.18æ , + 13.49æ‰, + 16.39æï, + 16.18æò, + 20.71æÓ,
+16.16æy, + 10.72æ2, + 9.27æ¼, + 13.89æ , + 37.57æ ,
−3.22 , + 16.29 , + 34.69 ‰, − 36.51 ï, + 40.14 , o
+20.96 , o + 5.95 ‰, o + 5.31 ï, o +
having obtained the alleged models, then the next step is to test the assumption of independent residuals and normal distribution. When they fulfill these assumptions we then carried out the significance of the parameters. The results obtained are
7, = −60.30œ , − 0.11œ , ¹ + 0.62œ‰, + 14.02æ , + 13.34æ , ¹
+17.31æ‰, + 19.91æï, + 20.57æò, + 24.67æÓ, + 23.59æ¡,
+19.66æy, + 17.58æ2, + 16.42æ ¼, + 17.97æ , + 36.81æ ,
+12.26 , + 29.33 ‰, + 52.96 ï, + 36.19 , o + 12.05 , o
+6.47 ‰, o + 50.73v¢,2Ó + 32.02v¢2,ò + +31.42v¢, ¡
+0.517, o − 0.157, o ‰+ m
4.
Conclusion and remarks
SWUP
References
Shumway, R.H., & Stoffer, D.S. (2006). Time series analysis and its application with R examples (2nd ed.). Springer, Berlin.
Suhartono, Muhammad H.L., & Nor A.H. (2010). Calendar variation based on time series regression for sales forecasts: The Ramadhan effects.