CENTER FOR ENVIRONMENTAL RESEARCH
Working Paper No. 13
September 2009
The Analysis of the Landcover Change Effect to Soil Erosion Using Spatial Modeling and Analysis (As a Key for Land Use Planning in Telaga Warna Catchment Area)
Budi Prasetyo
Yudi Setiawan
Wim Nursal
CENTER FOR ENVIRONMENTAL RESEARCH
Office address: Gedung PPLH 2-4 Fl., Jl. Lingkar Akademik, Kampus Darmaga, 16680 Mailing address: PO Box 243 16001
PREFACE
Lingkungan
-
Pertanian (PPLH-IPB)[Center for Environmental Research - Pertanian was
established in 1976. One of the Center's goal is to develop policies and concepts for natural resources and environmental management based on ecosystem characteristics, community participation, local community tradition, economic justice, and global environmental change.
Paper published in this Working Paper edition is the output of selected research activities funded by the Osaka Gas Foundation of International Cultural Exchange (OGFICE), Japan for the fiscal year
We are pleased to publish Dr. Lilik Budi Prasetyo, Yudi Setiawan, and Wim Nursal's paper The Analysis of the Landcover Change Effect to Soil Erosion Using Spatial Modeling and Analysis (As a Key for Land Use Planning in Telaga Warna Catchment Area). We also express our gratitude and appreciation to Mr. Hendi Satrio Dr. Lilik Budi Prasetyo, and K.
Damayanti, for their cooperation in proof-reading and lay-outing the manuscript.
Finally, we hope this publication will be valuable and beneficial for those who have interest in Indonesia's natural resource and environmental management.
September 2009,
Kukuh Murtilaksono
The Analysis of the Landcover Change Effect to Soil Erosion Using Spatial Modeling and Analysis (As a Key for Land Use Planning In Telaga Warna Catchment Area)
Budi Prasetyo, Yudi Setiawan, and Wim
CONTENTS
Abstract Introduction
1.1 Background
1.2 Objectives of the Research
Materials and Method
2.1 Time and Location of Study
2.2 Data
2.3 Methodology
Result and discussion
3.1 Topographic Normalization of Image
3.2 Land Cover Changes
3.3 Trend of Soil Erosion . . Conclusion
References
of Tables
Table 1. Slope Range and NN Exponent Constants (Arsyad, 1989)
5
Table 2. Land cover changes from 1991 until 2006 6
Table 3. Calculation of soil erosion from 1991 until 2006 8
Table 4. Relation landcover change and very heavy class of soil erosion 1 1
List of Figures
Figure 1. Trend of forest and built up cover change in three catchments
area 7
Figure 2. Distributions of Land cover from 1991 until 2006 9
The of the Change Effect to Soil Erosion Using Spatial Modeling and Analysis (As a Key for Land Use Planning in Telaga Warna Catchment Area)
Lilik Budi Prasetyo, Yudi Setiawan, and Wim lkbal Nursal
The Analysis of the Landcover Change Effect to Soil Erosion
Using Spatial Modeling and Analysis (As a Key for Land Use
Planning in Telaga Warna Catchment Area)
Lilik Budi Prasetyo, Yudi Setiawan, and Wim lkbal Nursal Center for Environmental Research-IPB
ABSTRACT
Lake Telaga Warna is situated at upper stream of Ciliwung River. The lake contains
freshwater supporting a rich ecosystem, promoting the lives of three primate species of Java and play important role hydrological function. Considering to its function, the national government established its status as Nature Reserve in 1981 through
Ministry of Forestry Regulation No. 481 Unfortunately, the lake is
subject to land cover changes due to agricultural, settlement encroachment other infrastructure development. The objectives of the research are (a) To provide accurate information of critical land land degradation map for land use planning,
(b) To analyze potential soil erosion due to land cover change in Telaga Warna
Reserve. Remote Sensing and Technology couple with hydrological
modeling (USLE) were applied.
Forest areas have been decreasing since 199 1 of about 13.66% (1.31 5 Ha) or almost
1% per year. In the other hand settlement areas have been increasing. Meanwhile
agricultural land was fluctuated depend on the season. Due to the land cover changes, distribution pattern of potential soil loss /erosion also changed. The area were classified into very heavy soil erosion were increase, which are situated mostly at bare land agricultural areas.
Key words : Telaga Warna, Remote Sensing, USLE, soil erosion, soil loss
1. INTRODUCTION
1.1, Background
Telaga Warna is a shallow basin lake, situated at 25 km southeast of
This lake contains freshwater supporting a rich ecosystem, promoting the lives of three primate species of Java. Considering to its function, the national government established its status as Nature Reserve in 1981 through Ministry of Forestry Regulation No. 481 1 981.
The Analysis of the Landcover Change Effect to Soil Erosion Using Spatial Modeling and Analysis (As a Key for Land Use Planning in Teiaga Warna Catchment Area)
Lilik Budi Prasetyo, Yudi Setiawan, and Wim
2.3.
Methodology2.3.1. Data Preprocessing
The aims of data preprocessing are to improve the quality of the images and to produce the intermediate data which will b e used in further processing.
1 ) Geometric Correction
Topographic map (especially road map) and Ground Control Point Data
were used as reference data to rectify and data.
Polynomial order was used for developing transformation model and the used re-sampling method was cubic convolution.
2) Atmospheric Correction
The atmospheric condition may unique on each features but the reflectance value of features is always constant. Therefore, to compare and process multi-date images data, the images should radiometrically corrected in such that each feature has a similar reflectance value (digital number) throughout the this research, relative radiometric normalization was used to improve the radiometric quality of images efficiently. Another atmospheric correction method used is haze removal.
3) Radiometric Normalization
Relative radiometric normalization (RRN) comprises of many methods, such as pseudo-invariant features, radiometric control set, image regression, no-change set determined from scattergrams, and histogram matching (Yang and Lo, 2000). Image regression (IR) based on pseudo-invariant features is preferred consider that it is used to reduce variability throughout image other than land cover changes (Phua and Tsuyuki, 2006) and possible to know the uncertainty level of developed model. It works by using one image as reference and adjust the brightness of the rest image to match the reference.
The dark object method was carried out upon images which is assigned as referenced data of normalization. Even the image was suffered from striping caused by Scan Line Corrector (SLC) failure,
4) DEM (Digital Elevation Model) Generation
DEM was generated through surfacing process by using non-linear rubber sheeting method. In order to have same in resolution of data, DEM produced have a resolution as same as data, that is 30 m x 30 m. In further step of analysis in this study, the DEM was converted to a slope map and then used as a one factor for estimate soil erosion.
2.3.2. Data Processing
The Analysis of the Landcover Change Effect to Erosion Using Spatial Modeling and Analysis (As a Key for Land Use Planning Warna Catchment Area)
Lilik Prasetyo, Yudi Setiawan, and Wim
1) Watershed Delineation
The watershed delineation tool uses AVSWAT-2000 (version the extension for and Spatial Analysis. It is used to perform watershed delineation based on SWAT (Soil and Water Assessment Tool) model. SWAT is a model developed to predict the impact of land management practices on water, sediment, and agricultural chemical yields in large, complex watershed with varying soils, land use, and management conditions over long period of time (Arnold al., 1998). The delineation process requires a Digital Elevation Model (DEM) in Arclnfo grid format.
2) Slope Classes and Length Generation
The length and the gradient of the slope have a major influence on the amount of soil erosion that can be occurred. The DEM was generated using surfacing method used to produce length and gradient of the slope.
3) Classification Accuracy Analysis
The accuracy parameters involve in building error matrix, estimating accuracy parameters such as total accuracy, user's accuracy, and producer's accuracy (Congalton and Green, KHAT statistic (Kappa estimator) and its variance.
4) Land Cover Change Analysis
The method used for analyzing land cover change per year was Boolean method. Subsequently, the descriptive statistics in the tabular and graphic format was used to expose the change of each class in sequential years. The analysis was carried out by using MS Excel.
Soil erosion analysis
The erosion is estimated by using USLE (Universal Soil Loss Equation) model (Wischmeier dan Smith, 1978). The model is ordered several factors which presumed affected land erosion, which mathematically describe by the equation below:
A
=
Where:
A : Maximum soil erosion rate R : Rain erosivity factor
K Soil erodibility factor,
LS : Slope and length factor index, C : Plant management factor index,
P Soil conservation techniques factor index
1
.
Erosivity FactorThe Analysis of the Change Effect to Erosion Using Spatial Modeling and Analysis (As a Key for Land Use Planning In Warna Catchment Area)
Budi Prasetyo, Yudi Setiawan, and Wim Nursal
6,1 M
2. Erodibility Factor
Soil erodibility is estimated based on soil sensitivity on erosion, which influenced by the nature of soil texture, structure, permeability and contained bio-organic matters.
100
=
1.292 ( (12-a)] + 3.25 (b-2) + 2.5 (c-3)where:
M
:
: soil organic matterconcentration
b soil structure codes, c soil permeability classes
3. Slope and length factor
The length slope (LS) is estimated by the following equation below (Ardis and Booth, 2004):
Table 1. Slope Range and NN Exponent Constants (Arsyad, 1989)
4. C and Factor
C and factor is determined by referring to the investigation of Arsyad ( 1 989) and Wischmeier and Smith (1979 in Arsyad, 1989) and the information obtained from ground check data and image interpretation.
The Analysis of the Landcover Change Effect to Soil Erosion Using Spatial Modeling and Analysis (As a Key for Land Use Planning in Telaga Warna Catchment Area)
Budi Prasetyo, Yudi Setiawan, and Wim
3. RESULTS AND DISCUSSION
3.1. Topographic Normalization of Image
The area study is a mountainous area which certain parts have a significant variation of topography. In turn, it affects the result of classification. Therefore, topographic correction has to be done, before conducting classification. Topographic slope, aspect, calculated incidence, and angle
existence were merged with the response for
bands. In order to fit a generalized photometric function, Minnaert method, a member of non-Lambertian model in which utilizing regression analysis, was applied. Generally, the effect of topography was reduced. Previously, at the area which has a high slope and aspect in line with solar radiation is darker than others, even they has a same land cover type (Figure 4.1). Minnaert method was able to correct such error, although it was overestimated for a small area which slopes more than (Figure 2).
3.2.
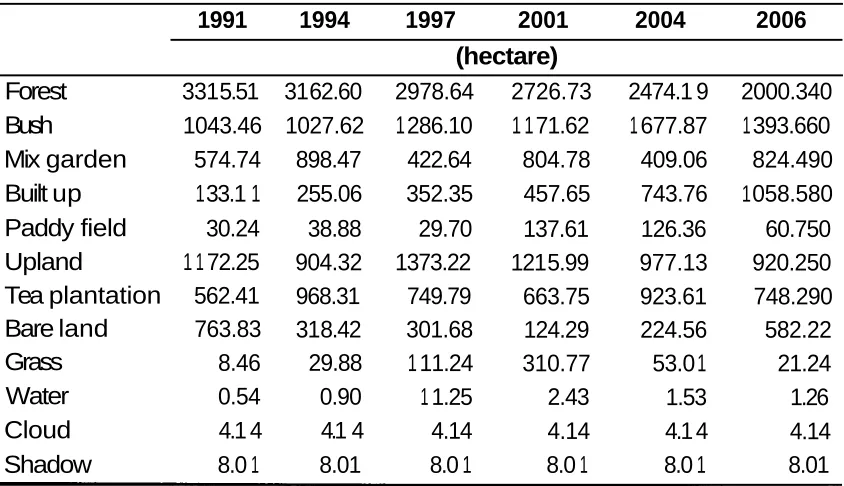
Land Cover ChangesBased on data there are 10 classes of land cover can be identified, which are forest, mix garden, built up, paddy field, upland, tea plantation, bare land, grass and water. The Overall Classification Accuracy is 87.83% and Kappa Coefficient equal to 0.8525 which is represents strong agreement. In total 9629.23 ha of study area were evaluated for land cover changes. Table 2 presents about land cover changes from 1 99 1 until 2006.
Table 2. Land cover changes from 1991 until 2006
The of the Landcover Change Effect to Soil Erosion Using Spatial Modeling and Analysis (As a Key for Land Use Planning in Teiaga Warna Catchment Area)
Lilik Budi Prasetyo, Yudi Setiawan, and Wim Nursal
Based on result of classification, forest, bush, upland and bare land has decreased between 1991 and 1994. However, upland and bare land fluctuate in next year. Its fluctuating happened depends on a season and planting time. Decreasing forest cover happened consistently until 2006, opposite with increasing in built up (settlement) cover. Degradation of ecologically valuable land caused by forest cover decreasing between 1991 until 2006 affects more than 13.66 of the total land area (over 1.31 5 ha). Moreover, 9.61 of the built (over 925 ha) and 9.48 of cultivated land always in fluctuated depends on a seasons and planting time (over 9 1 2 ha).
Between 1991 until 2006, bush, mix garden, built up, paddy field, tea plantation, and grass increased per year by 0.24 %, 0.1 7 %, 0.64 %, 0.02 %, 0.13 and 0.01 respectively. Forest cover decreased by 1,315 ha representing decrease of 0.9 1 per year. Areas of upland and bare land also decreased between 1991 until 2006 by 0.1 7 and 0.13 per year, respectively.
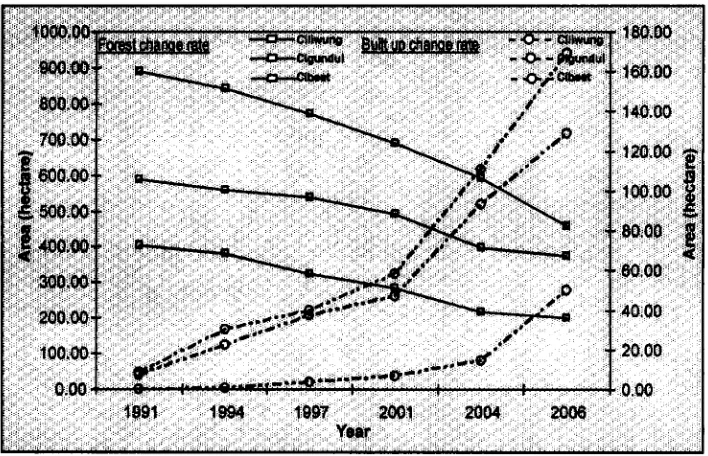
Figure 1. shows that catchments area in upper Ciliwung, Cigundul and Cibeet has different trend of forest and built cover changes. Forest cover of upper Ciliwung watershed has curve decrease stepper than Cigundul and Cibeet watershed. During 5 years, built up cover in upper Cigundul watershed increased significantly.
Figure 1. Trend of forest and built up cover change in three catchments area
3.3. Trend of Soil Erosion
The
Lilik
Analysis of the Landcover Change Effect to Soil Erosion Using Spatial Modeling and Analysis a Key for Land Use Planning in Telaga Warna Catchment Area)
Budi Prasetyo, Yudi Setiawan, and Nursal
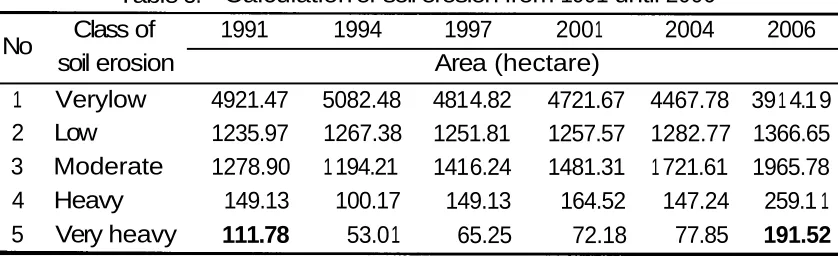
So, soil erosion rate in this study represented by soil loss risk. The result of calculation of soil erosion (soil loss risk) between 199 1, 1994, 1997, 2001, 2004 and 2006 are given in Table 3
.
Table 3. Calculation of soil erosion from 1991 until 2006 Class of
No 1991 1994 1997 200 1 2004 2006
soil erosion Area (hectare)
1 Verylow 4921.47 5082.48 481 4.82 4721.67 4467.78 39 1 4.1 9 2 Low 1235.97 1267.38 1251.81 1257.57 1282.77 1366.65 3 Moderate 1278.90 1 194.21 141 6.24 1481.31 1 721.61 1965.78 4 Heavy 149.13 100.17 149.13 164.52 147.24 259.1 1
The Analysis of the Landcover Change Effect to Soi (As a Key for Land Use Planning in Telaga Warna C Lilik Budi Prasetyo, Yudi Setiawan, and Wim
I Erosion Using Spatial Modeling and Analysis atchment Area)
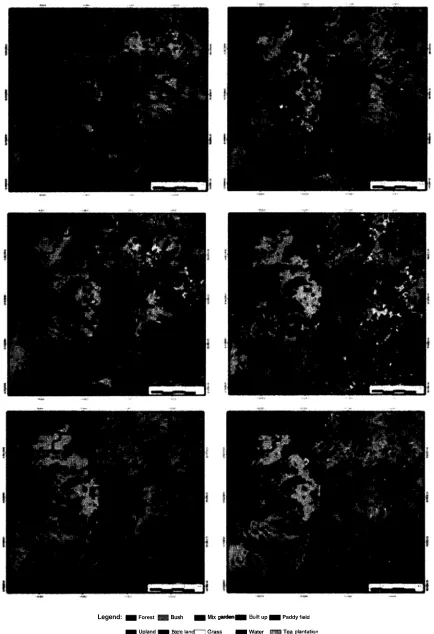
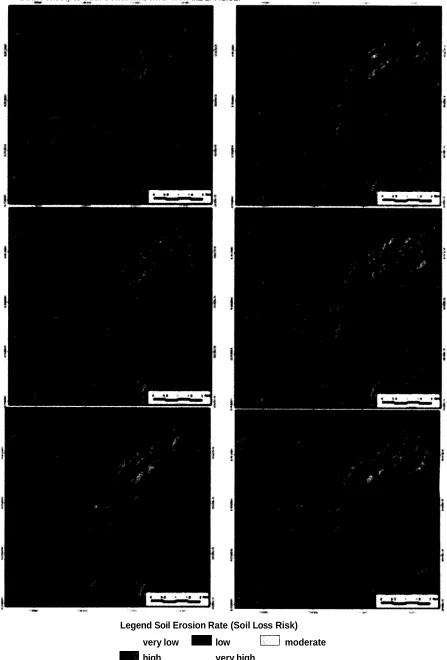
Legend: Forest Bush Mix
Upland Bare
No data
Figure 2. Distributions of Land
up Paddy
Water Tea
The Analysis of the Landcover Change Effect to Soil Erosion Using Spatial Modeling and Analysis (As a Key for Land Use Planning in Telaga Warna Catchment Area)
Budi Prasetvo. Yudi Setiawan. and Wim
Legend Soil Erosion Rate (Soil Loss Risk)
very low low moderate
high very high
The Analysis of the Landcover Change Effect to Soil Erosion Using Spatial Modeling and Analysis (As a Key for Land Use Planning in Telaga Warna Catchment Area)
Budi Yudi and Wim
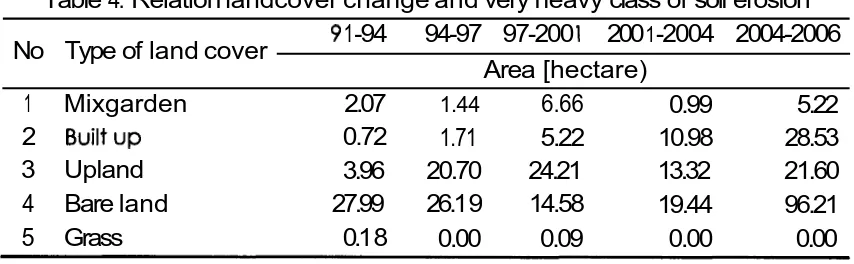
Table 4. Relation landcover change and very heavy class of soil erosion
1 -94 94-97 97-200 200 1 -2004 2004-2006
Based on result of classification, decreasing forest cover happened consistently until 2006, opposite with increasing in built up (settlement) cover. Cultivated area always in fluctuated depends on a seasons and planting time. However, land preservation of area Telaga Warna Nature Reserve is
currently good.
The result of analysis about effect of land cover changes to soil erosion in pattern has showed that most areas with soil erosion rate in very heavy class happened if land cover change to bare land, up land, mix garden and built up, although that location not in steep of slope (more than 40 Very heavy class of soil erosion happened in bare land, mix garden, up land, built up and grass.
REFERENCES
M.B. and J.L. Booth. 2004. Quantifying Soil Erosion for Single Storm Event and the Effects of Agricultural Conservation Practice using a GIS-based USLE Model. Department of Geography, University of Guelph.
Canada. URL:
Arsyad, S. 1989. Air. IPB Press.
Congalton, R.G. and K. Green. 1999. Assessing the Accuracy of Remotely Sensed Data: Principles and practices. Lewis Publishers. Boca.
R.G. 1996. Accuracy Assessment: A Critical Component of Land Cover Mapping. Gap Analysis. ISBN- 1-57083-03603 American Society for Photogrammetry and Remote Sensing. 1996. p 1 19-1 31. Hernowo, J.B. 2006. Pengelolaan Satwa Primata Wisata Telaga
The Analysis of the Landcover Change Effect to Soil Erosion Spatial Modeling and Analysis (As a Key for Land Use Planning Teiaga Warna Catchment Area)
Lilik Budi Prasetyo, Yudi Setiawan, and Wim Nursal
Phua, M. and S. Tsuyuki. 2004. Deforestation detection in Kinabalu area,
Sabah, Malaysia by using multi-sensor remote sensing approach. Journal of Forest Planning 1 0:3 1 -40.
Tuan, Vu Anh. 2004. Analysis Effect of Landcover Change to Soil Erosion
as a Key for Land Use Planning, International Symposium on Geoinformatics for Spatial Infrastructure Development in Earth and
Allied Science 2004.