U
SE OF
R
EMOTE
S
ENSING AND
GIS
TO
A
SSESS THE
A
NTHROPOGENIC
I
MPACT ON
F
OREST
F
IRES IN
N
AHR
I
BRAHIM
W
ATERSHED
,
L
EBANON
A. Assaker, T. Darwish, G. Faour and M. Noun
National Council for Scientific Research, Center for Remote Sensing, P.O. Box: 11-8281, Beirut, Lebanon
(Received 26 July 2011 - Accepted 19 September 2011)
ABSTRACT
The Mediterranean forests are exposed yearly to several forest fire events threatening the social, economical, ecological and living conditions of human being. The majority of these fires are of anthropogenic origin. The Nahr Ibrahim watershed (NIW) represents a typical example of the Lebanese areas having abundant forest surface (38.23% of its surface) but suffering recently from forest fires. The preservation of these natural resources is a priority for the continuity, stability and prosperity of the country. Several methods were applied to evaluate the potential forest fire risk in order to identify hot spots and reduce the potential damage. In this context mapping forest fire risk is a priority and a preliminary tool for the prevention of catastrophic fire events and development of sustainable forest management plans. The use of remote sensing and GIS provided the solid base for similar studies such as the forest fire risk map done for Lebanon at 1:200.000 scale. Therefore, the need for more detailed analysis at the watershed level arises. In this study a comparative analysis was conducted at a large scale (1: 50.000) on the NIW to assess the effect of several natural factors (climate, topography, vegetation and soil conditions) on forest fire risk. A combination of natural and anthropogenic factors (urban settlements, roads and zones with agricultural activity) provided better understanding of the impact of anthropogenic activities on forest hazards and forest resources conservation. The results show that forest fire in high risk zones is aggravated by anthropogenic activities: an increase from 5% to 38% was detected. In areas of moderate risk the increase goes from 7 to 25%. On the other hand, areas with low risk zones noticed a significant decrease when the anthropogenic activities were incorporated. Areas with very low risk have almost vanished.
Keywords: remote sensing, forest, fire, risk, natural factors, human pressure, Mediterranean forest
INTRODUCTION
maintaining biological diversity, reducing biomass and controlling insect and disease population. Although fire may destroy individual trees and understory plants, native species historically adapted to fire and had a high regeneration capability. But since Homo sapiens first learned how to use fire, this equilibrium was broken and the majority of forest fires have been of anthropogenic origin resulting in several catastrophic problems threatening the life of its main cause (Tishkov, 2004). The negative impacts include air and water pollution, loss of biodiversity, land degradation, desertification, soil erosion, impairment of human health and safety as well as loss of human life.
The Mediterranean region is one of the world’s biodiversity hotspots (Alacantara, 2010), where many civilizations over the history relied on its forest resources for their cultural, economical, social and esthetic service. However, every year, fires destroy millions of hectares of these surfaces (Maheras, 2002).
In Lebanon, one of the smallest Mediterranean countries (10,452 km2), with a forest
cover representing 13.4% of its total surface (FAO, 2010), this problem is well pronounced with the dry and hot climate in the east (ACS, 2006). Furthermore, many studies agreed that forest fires in Lebanon occur so frequently: an amount of 70600 forest fire events took place between 1994 and 2004, with an average of 1200ha of forested area burned annually (Mitri, 2010).
In this context, understanding forest fire risk (FFR) and the behavior of such risk when exacerbated by the anthropogenic activities is extremely important for reducing fire frequency and damage. It is a prerequisite for any sustainable forest management planning. This can be simply done by analyzing different factors that influence forest fires using FFR maps (FFRM) (Jaiswal et al., 2002). For this purpose, geographic information system (GIS) and remote sensing (RS) techniques were used successfully. In this regard, only one previous study was done by Faour et al. in 2006, to assess FFR on the national Lebanese scale at 1:200000. But a FFRM at the watershed level using high resolution source data is still lacking in the country and can improve forest management and necessary prevention measures.
The present study shows a typical example of assessing natural and hazardous FFR, and the effect of anthropogenic activity on a selected watershed from Lebanon. It is considered as a pilot study that can be applied on other Lebanese watersheds.
GENERAL CHARACTERISTICS OF THE STUDY AREA
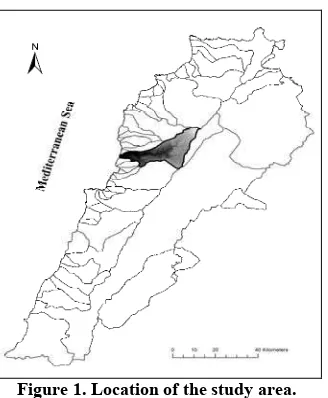
The study area is the Nahr Ibrahim watershed (NIW), located in the occidental part
of Jbeil casa and covering an area of approximately 326 km2 (Figure 1). It comprises forest
Figure 1. Location of the study area.
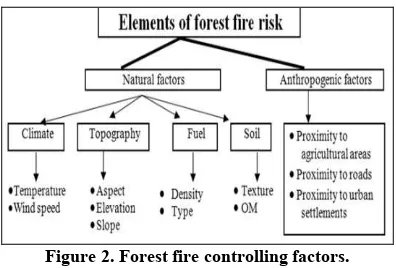
FOREST FIRE CONTROLLING FACTORS
Many researchers mapped FFR zones using several natural (vegetation, topography, climate) and anthropogenic factors (proximity to roads, agriculture and urban settlements) (Chuvieco & Congalton, 1989; Jaiswal et al., 2002; Limin et al., 2006; Faour et al., 2006; Erten et al., 2006; Garcia Strino, 2007). In this research, a new approach is integrated, where a combination of elements previously mentioned and other new factor (soil) are used. Then, by assigning relative weights to various factors according to their abilities to ignite a fire, the FFR zones were delineated. Furthermore, since this research focuses on the role that humans can play in such risk, two FFRM will be generated:
- Natural FFRM (NFFRM) where natural factors are combined.
- Forest fire hazard map (FFHM) where natural and anthropogenic factors are combined. Modeling will be done without taking into account the large amount of potential forest fire caused by human intended action (arson) which is difficult to predict in any form.
MATERIALS AND METHODS
Materials used
In this research, laboratory and field materials were both used. Laboratory Materials provided from the CNRS.
Land cover map scale 1/20000 (CNRS, 2006).
Soil Map of Lebanon scale 1/50000 (Darwish et al., 2006).
Topographic map of Lebanon scale 1/20.000 (DGGA, 1963) (Directorate General of Geographic Affairs).
Climatic Records from the CAL and LARI (CAL, 1977; 1982; LARI, 2010) GIS software.
Field devices
Global Positioning System tool (GPS). Data manipulation for FFR assessment.
Each of the forest fire controlling factors has several elements that contribute to the fire risk in the NIW (Figure 2). Thus for each factor, corresponding elements were extracted using GIS techniques: slope, elevation, aspect, fuel type and density, texture, organic matter content, and wind speed. Average maximal temperature for the fire season was calculated according to the Isohyethal method (Fetter, 1994).
Figure 2. Forest fire controlling factors.
Figure 3 represents the different tools used in the FFR assessment and the generated materials.
Method of analysis of the FFR
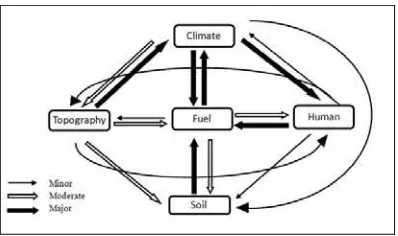
The factors described previously have not all the same effect on FFR in the NIW. Some factors bring higher risk, while others have less influence. Thus a chart based methodology inspired by the model proposed by Shaban et al. (2000) and implemented in Darwish et al. (2010) was adopted to evaluate the weight of each factor affecting N & HFFR in NIW. This method is based on the calculation of the total effect that each factor can produce on other factors to calculate its weight. The classification was operated as follow: a factor having a major effect on another one was attributed a weight of 1.5, of 1 for a moderate effect and of 0.5 for a minor effect. Hence, to produce the N & HFFRM two scenarios were followed:
- In the first FFRM scenario, only the natural factors were considered.
- In the second HFFRM scenario, the anthropogenic factor was mapped separately then added to the FFRM. Figure 4 shows a schematic presentation of different effects between the different factors influencing FFHM.
Figure 4. Methodology to evaluate the weight of different factors affecting HFFR.
For example, the fuel type has a major effect on climate, two moderate effects (one effect on the soil and one effect on the anthropogenic factor) and one minor effect on the topographic factor. Thus the fuel weight is: 1(1.5) + 2 (1) + 1(0.5) = 4. According to Figure 4, the climate is the most influencing factor due to the high number of effect that can produce on the remaining factors. Finally, the final weight for the two maps was expressed in percentage. Table 1 shows the total weight for each factor.
TABLE 1
Calculation of the Weight of Different Factors Affecting HFF
Effect Factors
Major Moderate Minor Total Weight (%)
Climate 2(1.5) 2(1) - 5 27.78
Topography 1(1.5) 2(1) 1(0.5) 4.5 25
Fuel 1(1.5) 2(1) 1(0.5) 4 22.22
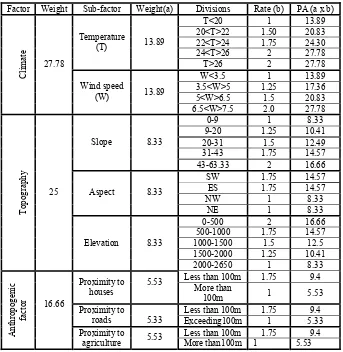
Sub-factors weighting
The weight of the agricultural cover was distinguished from the forest factor according to the rate of the calculated divisions. For the other factors the weight was equally divided between the different elements. For example, the three topographic factors were given an equal weight (25/3=8.33). Having established these weights, the divisions were rated from 1 to 2 (very low to very high) to evaluate their influence. The rate of agricultural and forest factors were assessed following the Lebanese NAP (2003). And the other factors were given a rate according to their capacity to ignite a fire. Table 2 represents the weight of each factor and the rate of the corresponding divisions.
TABLE 2
Weight and Rate for Different Factors Affecting HFFR
Cont. TABLE 2
Calculation of the Weight of Different Factors Affecting HFF
The product assessment (PA) is equal to weight times rate. The product assessment given by the GIS software varies between 47.9 (corresponding to the lowest risk) and 152
Factor Weight Sub
Abandonment agriculture land 1 6.80
Olives 1.5 10.2
Vineyards 1 6.80
Fruit trees 1 6.80
Citrus fruit trees 1 6.80
Agriculture 6.80
Protected agriculture 1 6.80
Dense pine forest 2 30.84
Dense broad leaved wooded
land 1.75 26.985
Dense mixed wooded land 2 30.84
Clear coniferous forest 2 30.84
Clear broad leaved wooded
land 1.75 26.985
Clear mixed wooded land 1.75 26.985
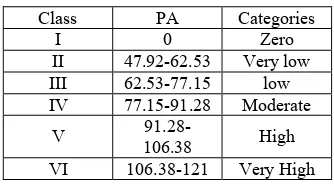
(corresponding to the highest rate of risk). This interval is divided into 5 classes to which the class of zero risk was added as shown in Table 3.
TABLE 3
Classes of Risk in the NIW
Method of analyzing the trend of urban expansion
Social statistics during field survey with local community confirmed the following fact: a high number of urban settlements as well as roads have highly increased during the last forty years. For this purpose digitizing of the road network on aerial photos of the year 1965
and satellite images of the year 2005 was operated on a representative small area (15.63 km2)
from this watershed.
RESULTS AND DISCUSSIONS
Urban expansion
Figures 5 and 6 show the road network for the two selected years. Road network length in 1963 was 22.77 km, while the 2005 network was about 90.68 km. This reflects the increase in number of houses and at the same time pressure and trend of urban expansion observed in the NIW.
Figure 5. Road density in 1965. Figure 6. Road density in 2005.
Class PA Categories
I 0 Zero
II 47.92-62.53 Very low
III 62.53-77.15 low
IV 77.15-91.28 Moderate
V
91.28-106.38 High
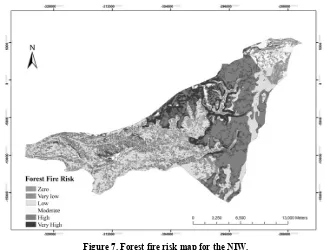
Forest fire risk map in the NIW
The overlaying/merging of the layer factors together in GIS software resulted in a map indicating the level of risk for forest fires from absent or nil to very high (Figure 7).
A large part (48.66%) of the NIW is subject to a high risk for forest fires, localized in the middle to upper part of the basin where the majority of the forest and shrubs is located. In addition, zones with very high risk (5%) are adjacent to these regions. Another part, a bit smaller area (37%) is attributed with a low risk and only 6% with a very low risk. Areas with moderate risk (7%) are areas containing bare rocks where shrubs are found in large quantities. An almost insignificant fraction (2.75 %) is without risk: these are the lakes, river, and urban settlements, fraction almost non observable on the FFRM.
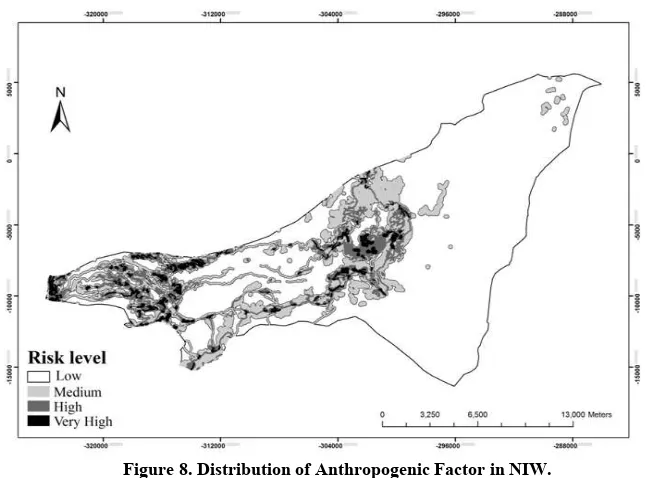
Map representing the anthropogenic factor in the NIW
The combination of the three anthropogenic factors with their corresponding weights resulted with a map locating the anthropogenic factor within the area of study (Figure 8). According to Figure 8, the majority of urban settlement is located on the lower part of the basin, explaining the existence of roads in the same zone. Furthermore, the agricultural areas are located in the same region. While only a very little number of urban settlements is located in the upper part of the basin. In this respect, zones with very high risk (in black) are zones located in proximity to urban settlement, roads and agricultural areas. Those with high risk level (dark grey) are in proximity to two anthropogenic factors, and areas with medium level
(light grey) of risk are in proximity to one factor only. The low risk areas (white) are zones distant from all the anthropogenic factors
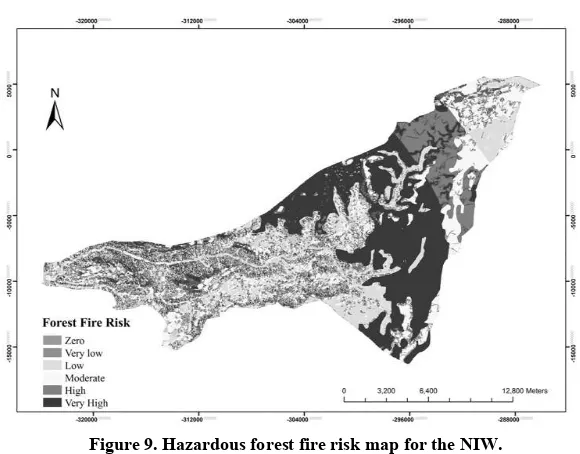
Hazardous forest fire risk map for the NIW
As previously mentioned, the combination of anthropogenic and natural maps results in a HFFRM. This is illustrated in Figure 9.
A large area (37.88%) of the NIW is found with a very high risk for forest fires. And almost 22% are with a high risk. Besides, 25% represent areas with moderate risk. Zones with a low risk form 11.8% of the total surface of the NIW, and only 0.5% are attributed with a very low risk.
Figure 8. Distribution of Anthropogenic Factor in NIW.
Zones with very high risk in the NFFRM and the HFFRM are zones where factors influencing FFR were combined together. Favorable climatic conditions, fuel type, soil characteristics and topographic nature, in addition to anthropogenic interference, can lead to a higher level of FFR.
Climatic factors: a relatively high temperature (22-26˚C) is found in more than 80%
Topographic factors: a great section of terrain (43-63%) in the NIW is found with a slopping and steep slope. However, 75.85% are located between 1000 and 2650m altitude which contributes in decreasing the forest fires risk.
Fuel factor: the fuel influenced the risk according to different type and density found in the NIW. Hence, 13% of the forest trees are coniferous trees (where 45% are with high density), 31% are broadleaved trees (where 15% are dense), 27% are herbaceous (where 23% are dense) and 36% are shrubs vegetations.
Soil factor: 7.15% of the NIW are soils with a high content in organic matter (5.9-8%) and 53% of the soils have a clay and clay loam texture, thus having a protective and preserving fraction of the water content in the soil to maintain soil water regime and land cover in the dry period.
Anthropogenic factors: 10% of forest surfaces are located within 50m of the roads and 17% are located within 100m of the agricultural areas, allocating for a higher risk. Hence among the 1.15% or urban settlement present in the NIW, 0.54% is an urban sprawl.
COMPARISON WITH PREVIOUS STUDIES
Comparing the results generated in this research with previous ones revealed that areas with low to very low risk in the previous work (Figure 11) shifted to areas of high to very high risk. Whereas areas with high and very high risk still exist but expanded to a larger surface. In addition, in the previous study bare rocks were excluded and considered as a zero risk area, but field survey showed that bare rocks are heavily covered with shrubs aggravating the risk.
Figure 10. FFRM according to Faour et al. ( 2006).
DATA VALIDATION
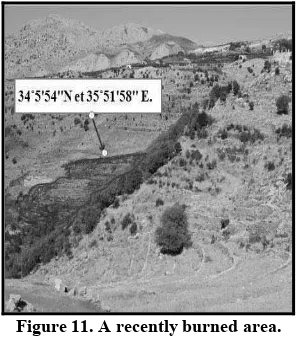
Field visit to the NIW, on the 10th of July 2010, accompanied with a Global Positioning System tool made possible the delineation and the exact localization of a burned area in the NIW (Figure 11).
According to the GPS, this zone is located between the geographic coordinates:
34˚5'54''N et 35˚51'58'' E. According to the FFRM this zone is attributed with a very high risk.
This helps primarily for data verification and emphasizes on the importance of taking necessary management actions to reduce the possibility of appearance of such risk.
Figure 11. A recently burned area.
CONCLUSION AND RECOMMENDATIONS
high risk increased 4 times, while areas of low risk decreased by 50% and those with very low risk almost disappeared. Hence, the results given by this research clearly showed an increase in the level of risk which is related to the urban expansion and socio economic activities in this area. This research showed again the reliability, effectiveness and the efficiency of using advanced new techniques in assessing natural risks. Moreover, the use of satellite images made possible the coverage of a large surface and consequently facilitated field work.
This research can be considered as a pilot study and can be applied on other Lebanese regions for a better forest management and preservation.
ACKNOWLEDGEMENTS
Special thanks to the National Council for Scientific Research, Center for Remote Sensing for providing the support to this research within the framework of CEDRE project: “Agriculture et paysages dans la montagne libanaise à l'Holocène : protection et gestion durable des ressources naturelles en sol et en eau”.
REFERENCES
Abi Saleh, B., Nasser, N., Rami, H., Safi, N., Safi, S., Tohmé, H. 1996. Flore terrestre. Étude de la biodiversité du Liban. République Libanaise, Ministère de l’Agriculture, PNUE, Liban.
ACS 2006. Administration Centrale de la Statistique. Compendium statistique nationale sur les statistiques environnementales au Liban, 36p.
Alacantara 2010. The Mediterranean: a biodiversity hotspot under threats. 13th Meeting of the FAO-CIHEAM sub-network on Mediterranean pastures and fodder crops. The contributions of grasslands to the conservation of Mediterranean biodiversity. Alicante, 7 April 2010.
Bou Saab, H., Nassif, N., El Samrani, A., Daoud, R., Medawar, S. 2007. Suivi de la qualité bactériologique des eaux de surface (rivière Nahr Ibrahim, Liban). Revue des Sciences de l'Eau, 20(4): 341-352.
CAL 1977. Atlas climatique du Liban. Tome II, Service Météorologique, Ministère des Travaux publics et Transports, 37 pp.
CAL 1982. Atlas climatique du Liban. Tome II, Service Météorologique, Ministère des Travaux publics et Transports, 31 pp.
CNRS 2006. Land cover map of Lebanon.
Chuvieco, E., Congalton, R. 1989. Application of remote sensing and geographic information system to forest fire hazard mapping. Remote Sensing Environment, 29:147- 159. Darwish, T., Khawlie, M., Jomaa, I., Abou Daher, M., Awad, M., Masri, T., Shaban, A.,
Faour, G., Bou Kheir, R., Abdallah, C. and Haddad, T. 2006. Soil map of Lebanon 1/50000. CNRS-Lebanon, Monograph Series 4, pp. 367.
Darwish, T., Khater, C., Jomaa, I., Stehouwer, R., Shaban, A., Hamzé, M. 2010. Environmental impact of quarries on natural resources in Lebanon. Land Degradation and Development, DOI: 10.1002/ldr.1011.
DGGA 1963. Topographic map of Lebanon. scale 1/20.000.
Erten, E., Kurgun, V., Musaoglu, N. 2004. Forest fire zone mapping from satellite imagery and GIS. A case study. Institute of Informatics, Malak Istambul, Turkey, 7p. FAO 2010. Global forest resources assessment country report - Lebanon. FRA 2010/114,
Rome, FAO, 50p.
Faour, G., Bou Kheir, R. 2006. Effectiveness of using very high resolution imagery (IKONOS) for land use mapping. GIS development journal, http://www.gisdevelopment.net/technology/ip/techip-002.htm.
Faour, G., Bou Kheir, R., Darwish, A. 2006. Méthode globale d’évaluation du risque
d’incendies de forêt utilisant la télédétection et les SIG : cas du Liban.
Télédétection, 5(4): 359-377.
Fetter, C. 1994. Applied hydrogeology. 3rd ed., Prentice Hall, Engkewood Cliffs, N.Y., 680p. Garcia Strino, J., Alhaddad, B., RocaGladera, J. 2007. Remote sensing to detect fire risk
locations. GéoCongrés, 2-5 octobre 2007.
Jaiswal, R.K., Mukherrjee, S., Raju, D., Saxena, R. 2002. Forest fire risk zone mapping from satellite imagery and GIS. International Journal of Applied Earth Observation, 4: 1-10.
Khater, C. 2004. Dynamiques végétales sur les carrières calcaires au Liban. Mémoire de doctorat, Université de Montpellier, 120p.
Korfali, S., Davies, E. 2004. The relationships of metals in river sediments (Nahr Ibrahim, Lebanon) and adjacent floodplain and soils. Agricultural Engineering International: the CIGR Journal of Scientific Research and Development, 6: 22.
LARI 2010. Periodical records from the Lebanese Agricultural Research Institute (LARI), Tal Amara, Lebanon
Limin, D., Zhanqing, H.A.O., Lei, T., Dong, X.U., Shao, G., Hui, W. 2006. Mapping forest fire risk zones with saptial data and principal component analysis. Science in China: Series E Technological Sciences, 49: 140-149.
Maheras, G. 2002. Forest fires in Greece. The analysis of the phenomenon affecting both natural and human environment. The role of sustainable development in controlling fire effects. MSc. Thesis, Land University, Sweden, 38p.
Mitri, G., Rodriguez, F., Palacios, G., Senra Rivero, F. 2010. Introduction to forest fire management in Lebanon. A publication of the association for forest, development and conservation, Tragsa and the University of Cordoba, Mitri, G., Ed., Beirut, Lebanon.
NAP 2003. National action program to combat desertification. Ministry of Agriculture and GTZ, Beirut, Lebanon.
Shaban, A., Khawlie, M., Bou Kheir, R., Abdallah, C. 2000. Assessment of road instability along a typical mountainous road using GIS and aerial photos, Lebanon, eastern Mediteranean. Bulletin of Engineering Geology and Environment, 60: 93-101. The National Wind Atlas of Lebanon 2011. CEDRO, Country energy efficiency and
renewable energy demonstration project for the recovery of Lebanon. 63p.