This content has been downloaded from IOPscience. Please scroll down to see the full text.
Download details:
IP Address: 54.86.175.99
This content was downloaded on 23/08/2017 at 06:39
Please note that terms and conditions apply.
The influence of regional surface soil moisture anomalies on forest fires in Siberia observed
from satellites
View the table of contents for this issue, or go to the journal homepage for more
Environ. Res. Lett.4(2009) 045021 (9pp) doi:10.1088/1748-9326/4/4/045021
The influence of regional surface soil
moisture anomalies on forest fires in
Siberia observed from satellites
A Bartsch
1, H Balzter
2and C George
31Institute of Photogrammetry and Remote Sensing, Vienna University of Technology,
1040 Vienna, Austria
2Department of Geography, University of Leicester, University Road, Leicester LE1 7RH, UK 3Earth Observation, Centre for Ecology and Hydrology, Crowmarsh Gifford,
Wallingford OX10 8BB, UK E-mail:[email protected] Received 27 February 2009
Accepted for publication 14 October 2009 Published 27 October 2009
Online atstacks.iop.org/ERL/4/045021
Abstract
Forest fires are frequent in the Siberian taiga and are predicted to increase in frequency as a result of increased fire risk under drought conditions, and prolonged fire seasons caused by climate change. There is, however, some uncertainty as to the extent to which drought influences forest fire frequency at a regional scale. Here, we present an analysis of satellite derived soil moisture anomaly data from ERS-1/2 (ERS: Earth Resources Satellite)
scatterometer data and burned area maps from MODIS/AVHRR/ATSR (Moderate Resolution Imaging Spectroradiometer/Advanced Very High Resolution Radiometer/Along-Track Scanning Radiometer) over Central Siberia for the years 1992–2000. The purpose of this study is to investigate the relationship of remotely sensed soil moisture deviations from the long-term mean and fire within the boreal biome on a sub-continental scale.
Results show that wet surface soil moisture conditions limit the extent of burned area. They can prevent the outbreak of fires but the magnitude of a negative (dry) deviation does not determine the maximum size of fire affected areas. It is known from the literature, however, that an ignition is more likely to occur under low surface wetness conditions, such as those that we observed during July and August in both permafrost and non-permafrost regions. Although the burned area under drier conditions in July is lowest over non-permafrost, the actual number of fires is as high as over continuous permafrost. Approximately 80% of all events occurred under such conditions during that month. The fire size was below 50 km2under moist conditions.
Larger burned areas have in general not been detected when the surface wetness deviation exceeded+5%.
Keywords:forest fires, remote sensing, scatterometer, soil moisture, radar
1. Introduction
The circumpolar boreal forest covers approximately 1.37 billion ha, or 9.2% of the world’s land surface. The observed and predicted warming trend in the Northern Hemisphere is about twice as high as the global average. At the same time the boreal biome is highly vulnerable to temperature increases due to many ecosystem processes being temperature limited. The boreal biome is also likely to cause significant
feedbacks to the climate system through large-scale albedo changes and temperature-induced greenhouse gas emissions under warming scenarios. The boreal biome in general and Siberia in particular are therefore a hotspot of climate change. Annual temperature anomalies (deviations from the long-term average) since 1850 have shown a warming trend over Central Siberia (50◦
–70◦ N, 80◦
–120◦
Environ. Res. Lett.4(2009) 045021 A Bartschet al
Forest fires have always been part of the boreal biome, and generate a patchy landscape mosaic of successional stages. Lightning frequency, litter fuel mass and fuel moisture content all have an impact on the fire regime and are linked to meteorological conditions. Fuel moisture is defined as the mass of water divided by the dry mass of fuel. Fuel moisture is an important determinant in the forest fire regime since it retards the rate of combustion. Fuel moisture influences the necessary preheating and ignition of unburned fuels, the rate of fire spread, the rate of energy release, and the production of smoke from flaming and smoldering fuel components [2]. Since humans colonized the region, human-induced ignitions have grown in importance. Under scenarios of climate change many predictions show an intensification of the fire regime, i.e. more frequent and/or more intense fires. Human-induced ignitions and impacts of climate change at continental and regional scale are playing a role in the changing fire regime, as is documented, e.g., by [3]. Greenhouse gas emissions from fires are an important component in the global carbon cycle. Fire is arguably the most significant ecological disturbance affecting carbon cycling worldwide releasing approximately 3.5 Pg C yr−1 to the atmosphere [4], which is
a significant carbon flux when compared to the approximately 5.8–8 Pg C emissions from fossil fuels [5]. Interannual variability in atmospheric carbon dioxide concentrations can be influenced significantly by fire emissions. For the 1997/1998 atmospheric carbon dioxide growth rate anomaly it is thought that 66% of the growth rate anomaly (the residuals of the concentration change from the increasing long-term trend line) can be attributed to global biomass burning, of which 10% originates from the boreal biome [4]. Increasing greenhouse gas emissions from an intensifying fire regime could lead to a positive feedback with global warming [6]. Other case studies have suggested that in the long term the positive radiative forcing effect from the emitted trace gases is balanced by changes in surface albedo after the fire, which causes a negative radiative forcing [7,8].
The fire regime in Siberia is thought to be influenced by the climate system via large-scale atmospheric circulation patterns [1, 9, 10]. The arctic oscillation (AO) index characterizes the difference in atmospheric pressure between the northern hemisphere mid and high latitudes extending from the surface deep into the troposphere. It is defined as the ‘leading empirical orthogonal function of the wintertime sealevel pressure field’ [11] and correlates with air temperature anomalies and other meteorological variables over the entire northern hemisphere. When the AO is in its positive phase, generally low pressure can be observed over the polar region and high pressure in mid latitudes. During this positive phase, the model shows an increase in annual burned area. A positive value of AO indicates higher pressure at mid latitudes, which brings higher than normal temperatures to northern Eurasia [11]. This leads to enhanced greening conditions over large regions in Europe and Asian Russia that have been detected by satellite derived vegetation indices [12,13].
In recent decades Siberia has experienced several extreme fire years [14], which coincided with years in which the AO was in a more positive phase [9]. Analyzing remotely sensed
burned area maps in conjunction with precipitation data, [3] observed that in addition to the continental scale effect of the AO, regional clusters of fire scars in Siberia occurred in places with lower than average precipitation anomalies at scales of tens of kilometers. An analysis of surface air temperature and precipitation at 10 meteorological stations in West Siberia by [15] demonstrated that West Siberia shows increases in temperature and precipitation, particularly springtime warming and more winter precipitation, which are associated to the AO. On average, the AO was linearly correlated with 96% (winter), 19% (spring), 0% (summer), 67% (autumn), and 53% (annual) of the warming [15]. Since 1950 the AO showed a statistically significant trend towards its positive phase [1], which is thought to indicate global climate change. Wind fields have shifted from north-easterly flows in the 1980s to anomalous south-westerly flows during March and April in the 1990s in Siberia [16], coinciding with a systematic shift in the AO near the end of the 1980s.
To explain the AO impact on the Siberian fire regime, a closer investigation of climate/ecosystem/fire interactions is necessary. The occurrence of forest fires depends on fuel mass and structure, presence of an ignition source, wind speed and fuel moisture, i.e. water content of dead bark, dead trees and/or the litter layer including the top organic soil horizon over peat lands. If fuel moisture is high, the rate of combustion is lower because the volatilization of the fuel is delayed, thus increasing the necessary preheating time to above 200◦
C [2]. The overall fuel consumption also tends to be reduced, and the fuel particle residence time is increased because the heat of ignition increases with moisture content of the fuel [2].
Remotely sensed data provide a wide range of parameters which can be used for fire danger assessment [17]. Reference [3] suggested that regional scale patches of low precipitation are linked to geographical forest fire clusters in Siberia. Since precipitation is only a proxy for changes in fuel moisture, this finding raises the question whether a statistical attribution of fire clusters to the spatial occurrence of low fuel moisture patches can be undertaken to provide a more physically meaningful interpretation of the analysis by [3]. Global soil moisture data are available from satellite-based scatterometers. The data indicate surface wetness conditions in the upper soil and litter layer, but have not yet been used for studying forest fires. The objective of this study is to test whether regional scale soil moisture anomalies coincide with regional fire clusters, since this would provide a plausible causal link between precipitation anomalies and fires [3]. The analyses presented here are based on monthly forest fire scar data from optical satellite data [9,18] and a global soil moisture dataset from scatterometer measurements [19]. A range of surface soil moisture products are available from satellite data, both from passive and active sensors. The latter comprise synthetic aperture radar (SAR) and scatterometer systems. SAR data have already been applied on a local scale for the investigation of post-fire soil moisture conditions in boreal environments [20,21]. Backscatter intensities recorded with C-band SAR data show a close relationship with parameters used for forest fire danger assessment [22]. SAR data are currently however neither continuously available nor in near
4 et al
real time at sufficient temporal resolution and spatial scale. C-band scatterometers are also active microwave sensors. Algorithms for estimating relative soil moisture on regional to global scales have been developed and tested [19, 23]. These data are available from the Earth Resources Satellite (ERS-1/2) scatterometers since 1992, allowing the calculation of temporal anomalies. These anomalies are thought to relate to drought and vegetation stress [24]. The first MetOp (Meteorological Operational satellite) which was launched in 2007 has the Advanced scatterometer (ASCAT) instrument on board which is similar to ERS1/2. It has delivered surface wetness measurements in near real time since December 2008 via the European Organisation for the Exploitation of Meteorological Satellites (EUMETSAT) Broadcast System for Environmental Data (EUMETCAST). ASCAT data may thus be incorporated into forest fire warning schemes anywhere on the globe. It covers the entire globe in 2–3 days [25] with better than daily acquisitions at high latitudes as required for the determination of fire danger indices [26].
Our study area investigates the region of Central Siberia, which comprises the administrative districts of Irkutsk Oblast, Krasnoyarsk Kray, Khakass Republic and Evenksky and Taimir Autonomous Oblast. It extends northwards from approximately 50–70◦
N, from Lake Baikal to the Taimir Peninsula covering ca. 3 Mio km2. The exact boundaries are
determined by administrative borders.
The calculation of soil moisture anomalies is based on the entire nine year period of ERS-1 and ERS-2 data availability (1992–2000). Monthly mean soil moisture deviations were compared to the number of fire scars and the burned area from optical satellite data [18]. The forest fire and surface soil moisture relationship is investigated with respect to permafrost presence. Permafrost impacts the temporal dynamics of near surface soil moisture content. The ground is frozen initially (after snowmelt) and thus impedes drainage [27]. The active layer depth then increases throughout the summer and the near surface soil moisture gradually decreases [28]. The permafrost zones (continuous, discontinuous, sporadic and isolated) within the study area do not correspond to strict latitudinal belts. They reflect terrain and continentality. Continuous permafrost can be found north of 65◦
N in the western region and north of 60◦
N in the eastern region of the study area. The taiga biome extents until 65◦
N [29] in the west and east. The aim of this letter is to investigate the impact of surface wetness conditions on forest fire occurrence in boreal environments.
2. Materials and methods
2.1. The soil moisture dataset
The global soil moisture dataset provided by Vienna University of Technology (TUW, [30]) was derived from active microwave data acquired by the ERS-1 and ERS-2 scatterometers. Both operate in C-band (5.6 cm wavelength) with vertical receive and transmit polarization (VV) and have a 50 km nominal spatial resolution. Soil moisture influences
the dielectric constant of the imaged area, which microwave radiation is sensitive to. Hence, changing moisture conditions at or near the Earth surface can be estimated from active microwave signals, assuming that sufficient backscatter return from the soil surface can penetrate any vegetation layer. At mid latitudes, however, the ERS scatterometers have been tested and found to be applicable for soil moisture estimation in forested areas [31]. Seasonal changes in the canopy may also impact on the microwave signal in addition to moisture changes. However, any canopy-induced backscatter changes are relatively small compared to the soil moisture signal with perhaps the exception of a significant reduction in biomass of the vegetation layer. Phenological changes of the vegetation are accounted for in the relative soil moisture estimation algorithm [19]. The soil moisture derived from C-band backscatter represents the upper 2–5 cm of the soil and/or overlying litter due to the limited penetration depth at the 5.6 cm wavelength [23,32]. Therefore, it is referred to as surface wetness or near surface soil moisture in the following text. Surface wetness is not available when the ground is frozen or covered with snow. The scatterometer data were resampled to a 25 km global grid in swath geometry using a sinusoidal projection [25].
The near surface soil moisture can be determined by time series analysis. A dry and wet reference (minimum and maximum backscatter) is identified for each grid point and each single measurement scaled between these limits [19,23]. This results in a relative measure of near surface soil moisture which is used in this study. By application of a simple infiltration model, the soil moisture in the entire soil profile can be derived, which is referred to as soil water index (SWI). The SWI has been applied and validated in most of the studies which deal with the TUW product, e.g. [30,33–36]. Previous calculations of soil moisture anomalies [37] which aimed at hydrological applications were also based on the SWI. The original surface soil moisture values (before application of the infiltration model), however, are a better indicator of fuel moisture content and hence are more useful for forest fire studies as they (1) provide a direct representation of the litter layer whose moisture content determines the required heat of ignition and (2) are independent of the actual active layer depth in case of permafrost.
Environ. Res. Lett.4(2009) 045021 A Bartschet al
Figure 1.Relationship between ERS scatterometer derived surface wetness (in %) and near surface soil moisture recorded at an automated station in a boreal environment (in vol%), Sodankyl¨a, Northern Finland; ground data source: CarboEurope.
2.2. Burned forest area dataset
Moderate Resolution Imaging Spectroradiometer (MODIS) Nadir bidirectional reflectance distribution function (BRDF)-adjusted reflectance (NBAR) 16-Day composite (MOD43B4) [38] data from 2003 and the IGBP (International Geosphere– Biosphere Program) land cover map from 1992 were used to detect fire scars for 1992–2003 [9, 18]. The normalized difference short-wave infrared index (NDSWIR=
(NIR-SWIR)/(NIR+SWIR); NIR—near infrared, SWIR— shortwave infrared) which is sensitive to canopy moisture content was used to identify burned area polygons. Active fire data from AVHRR (Advanced Very High Resolution Radiometer), (A)ATSR (Advanced Along-Track Scanning Radiometer) and MODIS was then used to assign either a proportion, if the area had burnt more than once, or all of the polygon area to a date of burn. The resolution of the burnt area product is approximately 1km and the temporal resolution is monthly [18]. The burned forest area map was validated using visual interpretation of Landsat images [18].
2.3. Comparison
A seasonal relationship between precipitation anomalies and fire activities has previously been observed in Siberia [3], where a lack of precipitation during the months April to July had a significant impact on fire activity. Consequently, surface soil moisture index relationships with fire scars were analyzed within a temporal window from May to August of each year. April was omitted due to the presence of snow cover over most of the study area which prevents a derivation of soil moisture using the method stated here. The relative surface soil moisture values were averaged for each month before calculation of the deviation from the long-term mean (1992–2000) of the relevant month for each ERS grid point. This time series was then compared with the corresponding location in the burned forest area dataset, using the center coordinate and date information for each fire polygon. Altogether 5378 fire scar locations were
analyzed. They were subdivided into groups according to their underlying permafrost conditions (source: National Snow and Ice Data Centre (NSIDC), [39]).
3. Results
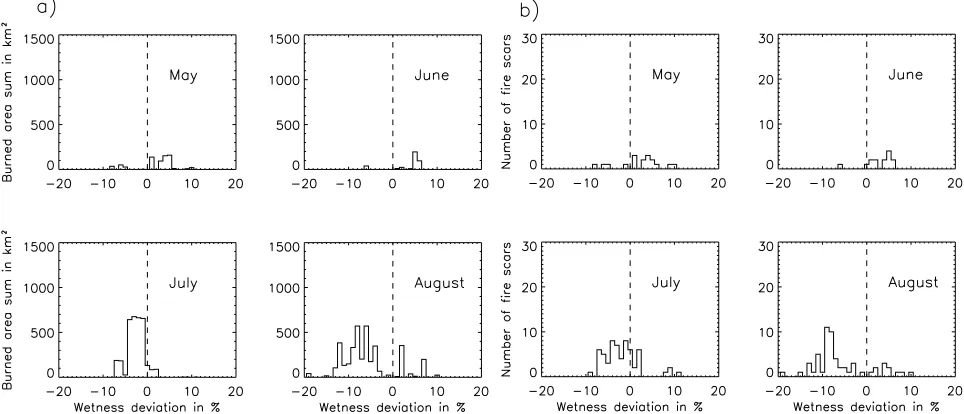
The monthly number of forest fires (or number of fire scars) and monthly total burned area are plotted against the monthly near surface soil moisture deviation in figures2and3for both non-permafrost and continuous permafrost areas. There are differences between single months, burned area and number, and between the types. Although the number of detected forest fires is lower in permafrost regions, clear differences can be observed regarding the surface wetness conditions. For the continuous permafrost regions, in July and August, both the number of fires and total burned area increase with decreasing surface wetness (figure 3). However for the non-permafrost regions, such a relationship is found for number of fires in June and July. Although almost 80% of forest fires in non-permafrost areas of July occur at below average soil moisture conditions (figure2(b)), the total burned area cannot be attributed to negative soil moisture deviations during July (figure2(a)). No influence of surface wetness deviations was found for May in any of the cases.
The percentage of fire events and the total monthly burned area in the period 1992–2000 is shown for dry near surface soil moisture conditions in figure4. Results are presented also for transition zones of sporadic and discontinuous permafrost. The differences between the permafrost types are highest for May and June and lowest for August. The central eastern part of the area is in the zone of continuous permafrost and shows comparably low mean relative surface wetness during July. This region is therefore a hotspot of high fire activity in years where drier conditions are found (figure 6). The majority of forest fire scars in non-permafrost areas are smaller than 20 km2 (figure 5). Many fire scars were observed
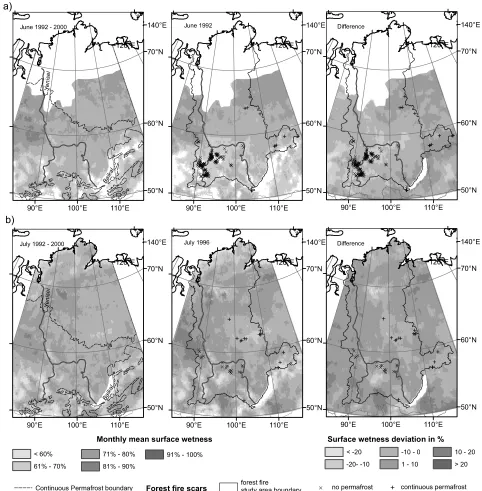
during the summer of 1992. The spatial patterns of monthly average surface soil moisture, the 1992 June monthly mean and deviations are shown in figure6(b). A high number of fires occurred especially in the southwestern part of the study area during this specific month. The affected regions show both a lower absolute surface wetness and stronger negative anomaly than the surrounding unburned areas (figure 6). Figure 6(b) also shows July 1996 fires in other regions including permafrost areas.
4. Discussion
Our results suggest that dry soil moisture anomalies detected from scatterometer data provide a partial but incomplete explanation of the forest fire dynamics in Siberia. Soil moisture anomalies appear to act as an on/off switch instead of a linear factor influencing fire scar frequency in any particular year. Litter moisture then determines the probability of ignition. This finding has implications for future fire model development. The size of the burned area is not directly related to surface soil moisture variations. It is likely that the extent of the fire is influenced more by fuel availability and local weather conditions such as temperature and wind
4 et al
Figure 2.Surface wetness deviation from ERS scatterometer data (1992–2000) in regions without permafrost for (a) total burned area and (b) number of fire scars (source: MODIS/AVHRR/ATSR).
Figure 3.Surface wetness deviation from ERS scatterometer data (1992–2000) in regions with continuous permafrost for (a) total burned area and (b) number of fire scars (source: MODIS/AVHRR/ATSR).
speed. Large burned areas (>50 km2), however, tend to only
occur if the monthly mean surface soil moisture is maximum 5% above average. From our results July is the exception in non-permafrost regions (figures 2(a) and3(a)), but this could be an anomaly. This means that wet conditions can prevent the spread of fires but, but once started, the magnitude of the negative deviation does not determine the maximum size of forest fire affected areas.
Over 80% of burned area in all regions occurs under dry conditions in the month of August. Although the burned area under drier conditions is low (45%) in July, the actual number of fires is high with almost 80%. The relationship of forest fire occurrence over sporadic and discontinuous permafrost is more similar to non-permafrost regions than those areas with continuous permafrost. A general occurrence of forest fires
Environ. Res. Lett.4(2009) 045021 A Bartschet al
Figure 4.Forest fire properties (source: MODIS/AVHRR/ATSR) at below average surface wetness conditions (derived from ERS
scatterometer data) for different permafrost extents (source: National Snow and Ice Data Centre (NSIDC)): total burned area (left) and number of fire scars (right).
Figure 5.Burned area (in km2) by surface wetness deviation (in %) over (a) non-permafrost area and (b) continuous permafrost.
only impact the number of thawing days but may also cause an earlier susceptibility to drought conditions within the summer and thus increase the likely burned area in case of a fire event. Additionally ground thermal conditions change after the event of a fire over permafrost. Thermokarst phenomena are triggered or enhanced and a transition from forest to swamp or grassy plain may be irreversible [42].
The current analysis only considers monthly mean soil moisture values. The dryness of litter changes with relative humidity on a daily basis and also with rainfall patterns. Average monthly wetness condition may hide short-term anomalies and the relationship to satellite observed surface wetness might be stronger in some cases. Droughts occur over longer periods and should therefore nevertheless be captured on a monthly scale. In order to evaluate predictive capabilities of surface soil moisture measurements from satellite data a temporally more detailed investigation would be necessary. The length of a dry period may have an impact on the number of fires. A higher temporal resolution would also allow the assessment of the impact of snowmelt variations which
may have consequences for the fire regime [41]. The end of snowmelt can vary by up to a month in southern central Siberia [43]. Acquisitions by the ERS1/2 scatterometers are irregularly spaced. Only every 10 days a full coverage can be expected. With the recently launched MetOp ASCAT, repeat cycles are not only shorter (2–3 days) but the spatial resolution is improved as well. An improved analysis of forest fire occurrence and surface wetness, however, requires also a more precise determination of fire event timing, which is currently not available over larger regions such as Siberia. An analysis of thermal anomaly (hotspot) data such as the MODIS active fire product may resolve this issue. An event based comparison would also provide a basis for consideration of human-induced ignitions in the analyses.
An increased risk of wild fires is projected for central Siberia due to expected higher numbers of droughts [26]. The number of days with ‘high and more flammability’ is expected to increase by up to 50% in the southern part of Central Siberia [44]. This underlines the importance of forest fire monitoring and prediction in this region. Our
4 et al
Figure 6.Map of ERS1/2 scatterometer derived multi-annual monthly average surface wetness (1992–2000, left), specific monthly average surface wetness (middle) and their difference for (a) June 1992 (with snow mask) and (b) July 1996. The border between continuous and non-permafrost is shown on the left figures. Location of fire scars (source: MODIS/AVHRR/ATSR) are indicated as+(permafrost)and×
(non-permafrost) on the middle and right.
results suggest that fire prediction can be enhanced through observations of relative soil moisture from scatterometers if they are available in near real time. The continuation of the ERS1/2 record is ensured by the Metop satellite series in conjunction with near real time data availability [25]. This allows the development of a method which incorporates satellite derived surface wetness information for fire weather indices which are based on drought, duff and fuel moisture conditions (e.g. palmer drought severity index [45], Canadian forest fire weather index [46], Nesterov index [47,48]). As
Environ. Res. Lett.4(2009) 045021 A Bartschet al
5. Conclusions
This study shows that soil moisture index estimates from scatterometer data help explain the observed spatial and temporal clustering of forest fires in Siberia. Soil moisture anomalies have been shown to be related to the occurrence of forest fires in central Siberia and can provide a causal explanation of previously observed coincidence of regional precipitation anomalies with fire clusters, because fuel moisture is directly related to the required heat of ignition. The actual relationship between soil moisture index and forest fires differs by season and by frozen ground conditions. The level of surface wetness needs to be considered when assessing the risk of forest fire as well as the temporal anomalies.
Acknowledgments
This work has been funded by a Hertha Firnberg research fellowship (Austrian Science Fund, T322-N10). The forest fire scar maps have been created within the framework of the SIBERIA-2 project, Multi-Sensor concepts for Greenhouse Gas Accounting in Northern Eurasia, a 5th Framework Program of the European Commission, contract no: EVG1-CT-2001-00048. In situ soil moisture measurements have been available through the CarboEurope database (www. carboeurope.com).
References
[1] Balzter H, Gerard F, George C, Weedon G, Grey W, Combal B, Bartholome E, Bartlalev S and Los S 2007 Coupling of vegetation growing season anomalies and fire activity with hemispheric and regional-scale climate patterns in central and east SiberiaJ. Clim.203713–29
[2] Nelson R M Jr 2001 Water relations of forest fuelsForest Fires—Behavior and Ecological Effectsed E Johnson and K Miyanishi (Amsterdam: Elsevier) pp 79–149
[3] Jupp T E, Taylor C M, Balzter H and George C T 2006 A statistical model linking Siberian forest fire scars with early summer rainfall anomaliesGeophys. Res. Lett.3314701
[4] van der Werf G R, Randerson J T, Collatz G J, Giglio L, Kasibhatla P S, Arellano A F, Olsen S C and
Kasischke E S 2004 Continental-scale partitioning of fire emissions during the 1997 to 2001 El Nino/La Nina period
Science30373–6
[5] IPCC 2007Climate Change 2007: The Physical Science Basis. Contribution of Working Group I to the Fourth Assessment Report of the Intergovernmental Panel on Climate Change
(Cambridge: Cambridge University Press)
[6] Amiro B D, Stocks B J, Alexander M E, Flannigan M D and Wotton B M 2001 Fire, climate change, carbon and fuel management in the canadian boreal forestInt. J. Wildland Fire10405–13
[7] Randerson J Tet al2006 The impact of boreal forest fire on climate warmingScience3141130–2
[8] Goetz S J, Mack M C, Gurney K R, Randerson J T and Houghton R A 2007 Ecosystem responses to recent climate change and fire disturbance at northern high latitudes: observations and model results contrasting northern Eurasia and North AmericaEnviron. Res. Lett.2045031
[9] Balzter Het al2005 Impact of the Arctic oscillation pattern on interannual forest fire variability in Central SiberiaGeophys. Res. Lett.3214709
[10] Hallett D J, Lepofsky D S, Methewes R W and
Lertzman K P 2003 11 000 years of fire history and climate in the mountain hemlock rain forests of southwestern British Columbia based on sedimentary charcoalCan. J. Forest Res.-Rev. Can. Rech. Forest.33292–312
[11] Thompson D W J and Wallace J M 1998 The Arctic oscillation signature in the wintertime geopotential height and temperature fieldsGeophys. Res. Lett.251297–300
[12] Buermann W, Anderson B, Tucker C J, Dickinson R E, Lucht W, Potter C S and Myneni R B 2003 Interannual covariability in Northern Hemisphere air temperatures and greenness associated with El Ni˜no-Southern Oscillation and the Arctic OscillationJ. Geophys. Res.1084396
[13] Forbes B C, Fauria M M and Zetterberg P 2009 Russian Arctic warming and greening are closely tracked by tundra shrub willowsGlob. Change Biol.at press
doi:10.1111/j.1365-2486.2009.02047.x
[14] Sukhinin A Iet al2004 AVHRR-based mapping of fires in Russia: new products for fire management and carbon cycle studiesRemote Sens. Environ.93546–64
[15] Frey K E and Smith L C 2003 Recent temperature and precipitation increases in West Siberia and their association with the Arctic oscillationPolar Res.22287–300
[16] Overland J E, Wang M Y and Bond N A 2002 Recent temperature changes in the Western Arctic during spring
J. Clim.151702–16
[17] Arroyo L A, Pascual C and Manzanera J A 2008 Fire models and methods to map fuel types: the role of remote sensing
Forest Ecol. Manage.2561239–52
[18] George C, Rowland C, Gerard F and Balzter H 2006
Retrospective mapping of burnt areas in central Siberia using a modification of the normalised difference water index
Remote Sens. Environ.104346–59
[19] Wagner W, Lemoine G and Helmut Rott 1999 A method for estimating soil moisture from ERS scatterometer and soil dataRemote Sens. Environ.70191–207
[20] Bourgeau-Chavez L L, Kasischke E S, Riordan K, Cella B, Alden S, Kwart M and Murphy K 2007 Remote monitoring of spatial and temporal surface soil moisture in fire disturbed boreal forest ecosystems with ERS SAR imageryInt. J. Remote Sens.282133–62
[21] Kasischke E S, Bourgeau-Chavez L L and Johnstone J F 2007 Assessing spatial and temporal variations in surface soil moisture in fire-disturbed black spruce forests in Interior Alaska using spaceborne synthetic aperture radar
imagery—implications for post-fire tree recruitmentRemote Sens. Environ.10842–58
[22] Abbott K N, Leblon B, Staples G C, Maclean D A and Alexander M E 2007 Fire danger monitoring using RADARSAT-1 over northern boreal forestsInt. J. Remote Sens.281317–38
[23] Wagner W, Naeimi V, Scipal K, de Jeu R and
Mart´ınez-Fern´andez J 2007 Soil moisture from operational meteorological satellitesHydrol. J.15121–31
[24] Gouveia C, Trigo R M and DaCamara C C 2009 Drought and vegetation stress monitoring in Portugal using satellite data
Nat. Hazards Earth Syst. Sci.9185–95
[25] Bartalis Z, Wagner W, Naeimi V, Hasenauer S, Scipal K, Bonekamp H, Figa J and Anderson C 2007 Initial soil moisture retrievals from the METOP-A Advanced Scatterometer (ASCAT)Geophys. Res. Lett.34L20401
[26] Malevsky-Malevich S P, Molkentin E K, Nadyozhina E D and Shklyarevich O B 2008 An assessment of potential change in wildfire activity in the Russian boreal forest zone induced by climate warming during the twenty-first centuryClim. Change86463–74
[27] Woo M-K, Kane D L, Carey S K and Yang D 2008 Progress in permafrost hydrology in the new millenniumPermafr. Periglac. Processes19237–54
[28] Sugimoto A, Naito D, Yanagisawa N, Ichiyanagi K, Kurita N, Kubota J, Kotake T, Ohata T, Maximov T C and
Fedorov A N 2003 Characteristics of soil moisture in
4 et al
permafrost observed in East Siberian taiga with stable isotopes of waterHydrol. Process.171073–92
[29] Stolbovoi V S and McCallum I 2002CD-ROM ‘Land Resources of Russia’International Institute for Applied Systems Analysis and the Russian Academy of Science, Laxenburg, Austria
[30] Wagner W, Scipal K, Pathe C, Gerten D, Lucht W and Rudolf B 2003 Evaluation of the agreement between the first global remotely sensed soil moisture data with model and precipitation dataJ. Geophys. Res.D1084611
[31] R¨udiger C, Calvet J-C, Gruhier C, Holmes T R H,
de Jeu R A M and Wagner W 2009 An intercomparison of ERS-Scat and AMSRE soil moisture observations with model simulations over FranceJ. Hydrometeorol.10431–47
[32] Albergel C, R¨udiger C, Carrer D, Calvet J C, Fritz N, Naeimi V, Bartalis Z and Hasenauer S 2009 An evaluation of ASCAT surface soil moisture products within situobservations in southwestern FranceHydrol. Earth Syst. Sci.13115–24 [33] Ceballos A, Scipal K, Wagner W and Martinez-Fernandez J
2005 Validation of ERS scatterometer-derived soil moisture data over the central part of the Duero Basin, SpainHydrol. Process.191549–66
[34] Crow W T and Zhan X 2007 Continental-scale evaluation of remotely sensed soil moisture productsIEEE Geosci. Remote Sens. Lett.4451–5
[35] Scipal K, Drusch M and Wagner W 2008 Assimilation of a ERS scatterometer derived soil moisture index in the ECMWF numerical weather prediction systemAdv. Water Res.311101–12
[36] Brocca L, Melone F, Moramarco T and Morbidelli R 2009 Antecedent wetness conditions based on ERS scatterometer dataJ. Hydrol.36473–87
[37] Scipal K, Scheffler C and Wagner W 2005 Soil moisture-runoff relation at the catchment scale as observed with coarse resolution microwave remote sensingHydrol. Earth Syst. Sci.9173–83
[38] Schaaf C Bet al2002 First operational BRDF, albedo nadir reflectance products from MODISRemote Sens. Environ. 83135–48
[39] Brown J, Ferrians O J Jr, Heginbottom J A and
Melnikov E S 1998Circum-Arctic Map of Permafrost and
Ground-Ice Conditions(Boulder, CO: National Snow and Ice Data Center/World Data Center for Glaciology) Digital Media, revised February 2001
[40] Delbart N, Kergoat L, Le Toan T, Lhermitte J and Picard G 2005 Determination of phenological dates in boreal regions using normalized difference water indexRemote Sens. Environ.9726–38
[41] Westerling A L, Hidalgo H G, Cayan D R and
Swetnam T W 2006 Warming and earlier spring increases western US forest wildfire activityScience313940
[42] Chikahisa T, Anzai H, Hishinuma Y and Kudo K 2005 Modeling and evaluating the effect of forest fire control on the CO2cycle in SiberiaEnergy302261–74
[43] Bartsch A, Kidd R A, Wagner W and Bartalis Z 2007 Temporal and spatial variability of the beginning and end of daily spring freeze/thaw cycles derived from scatterometer data
Remote Sens. Environ.106360–374
[44] ROSHYDROMET 2008Assessment Report on Climate Change and its Consequences in Russian Federation—General SummaryFederal Service for Hydrometeorology and Environmental Monitoring, Moscow
[45] Xiao J and Zhuang Q 2007 Drought effects on large fire activity in Canadian and Alaska forestsEnviron. Res. Lett.2044003
[46] Wotton B M and Beverly J L 2007 Stand-specific litter moisture content calibrations for the Canadian fine fuel moisture code
Int. J. Wildland Fire16463–72
[47] Sofronov M A 1998 Drought indices for forest fire danger evaluationForest and Forest Economy of West Siberiavol 6 (Tyumen: Tyumen University Press) pp 55–62 (in Russian) [48] Venevsky S, Thonicke K, Sitch S and Cramer W 2002
Simulating fire regimes in human-dominated ecosystems: Iberian peninsula case studyGlob. Change Biol.8984–98
[49] Bartsch A, Wagner W, Scipal K, Pathe C, Sabel D and Wolski P Global monitoring of wetlands—the value of ENVISAT ASAR global modeJ. Environ. Manag.at pressdoi:10.1016/j.jenvman.2007.06.023
[50] Wagner W, Pathe C, Doubkova M, Sabel D, Bartsch A and Hasenauer S 2008 G. Bl¨oschl, K. Scipal, J.