Detection of Taste Change of Bovine and Goat Milk in Room Ambient
Using Electronic Tongue
Imam Tazi
1,2, Anis Choiriyah
1, Dwi Siswanta
3, and Kuwat Triyana
2,4,* 1Department of Physics, Universitas Islam Negeri Maulana Malik Ibrahim, Jl. Gajayana No. 50, Dinoyo, Lowokwaru, Malang 65144, East Jawa, Indonesia2Department of Physics, Faculty of Mathematics and Natural Sciences, Universitas Gadjah Mada, Sekip Utara, Yogyakarta 55281, Indonesia
3Department of Chemistry, Faculty of Mathematics and Natural Sciences, Universitas Gadjah Mada, Sekip Utara, Yogyakarta 55281, Indonesia
4Interdisciplinary Halal Research Group, Universitas Gadjah Mada, Jl. Kaliurang Km. 4, Sekip Utara, Yogyakarta 55281, Indonesia
Received May 24, 2017; Accepted August 9, 2017
ABSTRACT
An electronic tongue (e-tongue) based on an array of lipid/polymer membranes has been successfully developed for measuring the taste evolution of natural milk. The e-tongue consisted of 16 different lipid/polymer membranes combined with or without a pH sensor. The natural milk of bovine and goat were purchased from the local farming store in Malang-Indonesia. The taste measurement was carried out, from fresh (0 h) to stale (12 h), every two hours under room ambient without any treatment. The responses of the e-tongue were evaluated using a Principal Component Analysis (PCA) and a Linear Discriminant Analysis (LDA). From PCA results, the taste of both milk samples tends to change by time although some groups show a partial overlapping. LDA results show the high precision of the e-tongue in clustering taste evolution. The correctly classified groups after the cross-validation procedure were achieved 95.7 and 87.1% for bovine and goat milk, respectively. The improvement of the classification using LDA was obtained by adding data from a pH sensor of each measurement as 100 and 98.6% for bovine and goat milk, respectively. This work indicates that the lab-made e-tongue may be useful to predict the quality of natural milk for the food industry.
Keywords:electronic tongue; taste; linear discriminant analysis; principal component analysis
ABSTRAK
Lidah elektronik berbasis kanal lipid membran telah berhasil dikembangkan, dan digunakan untuk mengukur perkembangan rasa dari susu segar sampai basi. Lidah elektronik yang digunakan dalam penelitian ini terdiri dari 16 membran lipid dan 1 sensor pH. Susu sapi dan susu kambing mentah dibeli dari peternakan lokal di Malang-Indonesia. Pengukuran kualitas rasa susu dilakukan setiap dua jam dalam kondisi suhu kamar tanpa perlakuan khusus dan diukur dari kondisi segar sampai 12 jam. Respon dari lidah elektronik dievaluasi menggunakan metode pengenalan pola analisis komponen utama (PCA) dan analisis diskriminan linier (LDA). Berdasarkan hasil PCA, kedua sampel susu menunjukkan pola perubahan terhadap waktu meskipun terjadi tumpang tindih antara kelompok. Metode LDA menunjukkan ketepatan yang tinggi dalam mengelompokkan perkembangan rasa susu. Berdasarkan LDA, kelompok yang diklasifikasikan secara tepat setelah prosedur cross-validation dicapai 95,7% untuk susu sapi dan 87,1% untuk susu kambing. Perbaikan klasifikasi menggunakan LDA diperoleh dengan menambahkan data sensor pH pada masing-masing pengukuran. Peningkatan ketepatan klasifikasi pada susu sapi ini menjadi 100% dan untuk susu kambing sebesar 98,6%. Hal ini menunjukkan bahwa lidah elektronik ini mampu untuk memprediksi kualitas susu alami.
Kata Kunci:lidah elektronik; rasa; analisis linear diskriminan; analisis komponen utama
INTRODUCTION
The body requires energy to optimize daily activities. Energy can be met by consuming food or
is one of the drinks components that it contains protein, lactose, calcium, magnesium, vitamin B and vitamin D [1-2].
Bovine and goat milk can be consumed directly without any treatment, nor heating or additives. This type of milk usually sold in simple packaging, so it was often known as natural milk. The freshness of natural milk was very short because of without preservatives [3,4]. One of the methods to preserve milk was to store it in the freezer. Harmful bacteria could contaminate the natural milk that results in the change of the taste quality rapidly that produce non-consumable sour milk [5-6]
The taste is the primary parameter of milk quality. Measurement of taste for beverage quality assessment usually performed by human tongue [7-9]. For many cases like sour milk, it is impossible to evaluate by human tongue because of harmful. Moreover, the human tongue is usually more subjective if compared to other expensive analytical instruments. When using human tongue, the assessment process of the taste of beverage or food can be influenced by the health condition at this time. The chemical analysis using standard analytical instruments is very expensive, time-consuming for sample preparation, and requires specialized experts although it shows high accuracy. At present, ones seek a method for rapid test of milk taste [10-16].
A sensor-array based electronic tongue (e-tongue), fortunately, has been reported as potential, versatile and advantageous electrochemical tools within food analysis. It is because e-tongue is able to qualitatively estimate characteristic properties of food samples, to distinguish among several types of foods and to recognize taste attributes [17].
An e-tongue has been reported as a qualitative and rapid analysis of foods and dairy products. It composes of an array of taste sensors, a data acquisition system, and a pattern recognition system. The taste sensor is made from an active material of lipid/polymer and has a low selectivity. Originally, it was used to evaluate and recognize the five basic tastes (sweet, salty, sour, bitter, and umami), but recently, it is employed in many applications. If the taste sensor is utilized in an array, there would be the cross sensitivity of each sensor [8,18-19]. Some applications of e-tongue include differentiating some brand of milk and yogurt [9,20].
Because of resulting a particular pattern, an e-tongue should also be equipped with a pattern recognition system. A multivariate analysis of Principal Component Analysis (PCA) and Linear Discriminant Analysis (LDA) are a pattern recognition system which used for the purpose of classification or discrimination [21-22]. PCA is a non-supervised pattern recognition system [23-25], while LDA is a supervised pattern recognition system [17,26-28].
The objective of this study is to investigate the ability of self-developed e-tongue in detecting the taste evolution of natural milk without preservation at room ambient. The taste of natural milk changes rapidly with time because of the absence of the preservation. For this purpose, natural milk of bovine and goat were used as the sample of the investigation. PCA was applied to a pattern recognition system, starting from fresh milk until different taste conditions for up to 12 h. Moreover, LDA method was applied as the comparison of a pattern recognition system. The last analysis would result in the best pattern recognition multivariate model.
EXPERIMENTAL SECTION
Sensor Array
The sensor array of the working electrodes consisted of 16 types of lipid/polymer membranes coupled with a pH sensor. The membrane composed of polyvinyl chloride (PVC) as a matrix, 2-nitrophenyl octyl ether (2-NPOE) as a plasticizer, and many kinds of lipid as an active material. All the above materials were then dissolved in tetrahydrofuran (THF) for producing the membranes. Table 1 shows the composition of 16 kinds of the membrane. Finally, each solution was attached to the gold layer of the end of electrode [29,30].
Data Acquisition System
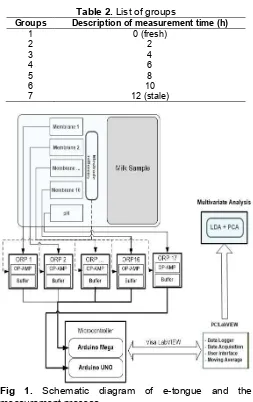
Fig. 1 shows a diagram of an e-tongue system used in this study. The sensor array consisted of a pH electrode and 16 kinds of membrane connected to silver electrodes. From the definition, a Data Acquisition Systems (DAQ) is a system consists of sensors or transducers, signal conditioning, and processing, an analog to digital converter and a computer. The roles of DAQ includes measuring physical quantities, recording data (as a data logger) and also controlling the measurement system [30]. In the case of e-tongue, the recorded data were in the form of patterns. A pattern recognition system was then applied to cluster or classify the data.
Measurement
Table 1.The composition of membranes (S1 to S16), all materials are in PVC Matrix (32%) Sensor Active Material Lipid (3%) Plasticizer (65%)
S1 Octadecylamine 2-NPOE
S2 Oleyl alcohol 2-NPOE
S3 Methyltrioctylammonium chloride 2-NPOE
S4 Oleic acid 2-NPOE
S5 Octadecylamine Bis(2-ethylhexyl) sebacate
S6 Oleyl alcohol Bis(2-ethylhexyl) sebacate
S7 Methyltrioctylammonium chloride Bis(2-ethylhexyl) sebacate
S8 Oleic acid Bis(2-ethylhexyl) sebacate
S9 Octadecylamine Bis(2-ethylhexyl) phosphate
S10 Oleyl alcohol Bis(2-ethylhexyl) phosphate
S11 Methyltrioctylammonium chloride Bis(2-ethylhexyl) phosphate
S12 Oleic acid Bis(2-ethylhexyl) phosphate
S13 Octadecylamine Bis(1-butylpentyl) adipate
S14 Oleyl alcohol Bis(1-butylpentyl) adipate
S15 Methyltrioctylammonium chloride Bis(1-butylpentyl) adipate
S16 Oleic acid Bis(1-butylpentyl) adipate
Table 2.List of groups
Groups Description of measurement time (h)
1 0 (fresh)
2 2
3 4
4 6
5 8
6 10
7 12 (stale)
Fig 1. Schematic diagram of e-tongue and the measurement process
at 0 h (fresh condition) to 12 h (stale condition). Measured data of bovine milk were saved as Dataset01, while that of goat milk were saved as Dataset02.
Statistical Analysis
PCA and LDA are statistical methods that use an orthogonal transformation to convert a set of observations of possibly correlated variables into a set of values which are linearly uncorrelated. Both unsupervised (PCA) and supervised (LDA) statistical techniques can be used to analyze the ability of the different techniques to discriminate qualitatively between samples.
In this case, PCA and LDA were applied for reducing of 16 or 17 sensors to a smaller number of new variables as principal components. Those methods were used for visualization and classification of groups of milk data. Using PCA and LDA, the ability of the e-tongue for recognizing milk taste was analyzed. For this purpose, the effect of a pH sensor addition to the sensor array was also investigated related to the performance of the e-tongue.
RESULT AND DISCUSSION
aqueous solution. As a result, a potential will be generated in the electrodes and measures as the response of the sensor. As each sensor contains a different combination of active compound and membrane solvent (plasticizer), then each sensor will give different response pattern to different taste. The response pattern of the 16 sensors to a particular analyte then can be used as a marker for that taste, that can be analyzed further using PCA or LDA.
Taste components are sourness, saltiness, umami, bitterness, and sweetness. Each taste can be represented chemically such as acid for sourness, NaCl as saltiness, sodium glutamate for umami, coffee for bitterness, sucrose for sweetness. The active compound in a series of 16 sensors will respond unselectively to the various compounds representing various flavors in the sample. The response of each sensor will be a cumulative potential for each taste-representative compounds to that membrane sensor.
Membrane component consists of PVC as the membrane matrix, membrane solvent (plasticizer) and sensing-active compound. As the membrane solvent, four types of compounds were used, namely 2-NPOE, bis(2-ethylhexyl) sebacate, bis(2-ethylhexyl) phosphate, and bis(1-butylpentyl) adipate. These four plasticizers have different lipophilicity (log Po/w) and dielectric constant (ε) that will affect the sensitivity and speed of
the electrochemical response of each membrane. Eventually, the difference in membrane solvent will give different response patterns.
The active compounds that used for the preparation of the 16-sensor in this work are expected to have an interaction with a group of taste-representative compounds. These compounds can be grouped into (1) amines (octadecylamine); (2) ammonium salts (methyltrioctylammonium chloride); (3) acid (oleic acid); and (4) alcohol (oleyl alcohol). The amine compound will respond to the acidic taste component; while the ammonium salt will respond to chloride ions as a saltiness representation. The active acid compound will respond to the base compound as a bitter taste representation, while the alcoholic compound will interact with the nonionic polar compounds, such as sugars. By combining four active compounds and four membrane solvent, then a series of 16 sensors can be constructed, that each sensor will give a different response to each taste to give a response pattern.
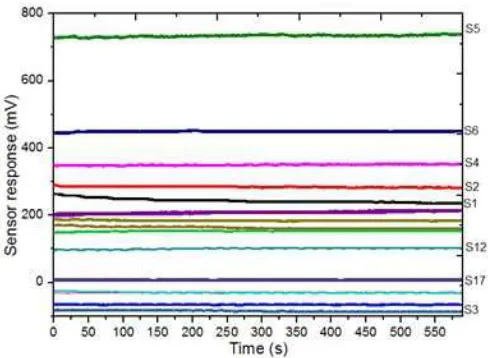
Fig. 2 are typical responses of a sensor array in the e-tongue when detecting the same sample. Each curve represents the corresponding potential (mV) of a sensor
against time (s). Significant changes took place in 0-275
s for sensor S1, while the remain sensors achieved a dynamic balance very fast. The last 50 signal values of the e-tongue sensors were chosen for average treatment. From the sensor array, there are 17 (with pH
Fig 2. Typical responses of sensor array of the e-tongue
sensor) original variables in total for each sample (bovine or goat milk), that is, a 17 × 70 (10 replications × 7 groups) data matrix.
Characteristic Response of the Sensors
Sixteen sensors used in the e-tongue here were a combination of four types of lipid and four types of plasticizer. The lipids used were octadecyl amine, oleyl alcohol, methyltrioctylammonium chloride and oleic acid, while the plasticizer was 2-NPOE, bis(2-ethylhexyl) sebacate, bis(2-bis(2-ethylhexyl) phosphate and bis(1-butylpentyl) adipate. The analyte used were KCl, MSG, NaCl and MgCl2 as a representative for four
types of taste, i.e., sour, umami, salty, and bitter, respectively. Octadecylamine, as a base, interacts with acidic components (H3O+) or with a cation (ion-dipole
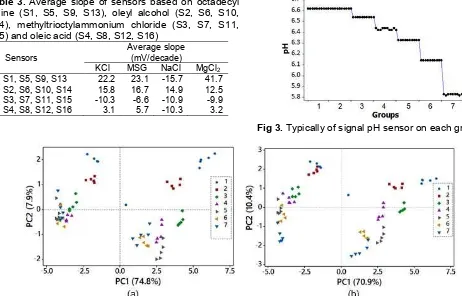
Table 3. Average slope of sensors based on octadecyl amine (S1, S5, S9, S13), oleyl alcohol (S2, S6, S10, S14), methyltrioctylammonium chloride (S3, S7, S11, S15) and oleic acid (S4, S8, S12, S16)
Sensors
Average slope (mV/decade)
KCl MSG NaCl MgCl2
S1, S5, S9, S13 22.2 23.1 -15.7 41.7
S2, S6, S10, S14 15.8 16.7 14.9 12.5
S3, S7, S11, S15 -10.3 -6.6 -10.9 -9.9
S4, S8, S12, S16 3.1 5.7 -10.3 3.2
Fig 3.Typically of signal pH sensor on each group
Fig 4. Score plot of PCA for natural bovine milk, (a) without and (b) with involving a pH sensor in which seven groups refer to Table 2
Based on the data in Table 3, it was observed that the sensor based on octadecyl amine exhibited the high responses to KCl, MSG, and MgCl2. The essential
character of the amine as a strong electron pair donor could explain the relatively strong interaction between the lipid and cation. However, the basic character of the amine depends on the pH of the solution. In an acidic media, the amine group will bind a proton and become – NH3+, which will respond to the anion. Therefore, the
strength of the sensor response based on amine compound will depend on the pH of the solution. As expected, oleyl alcohol showed a weaker response compared to that of octadecyl amine. Methyltrioctylammonium chloride showed a negative slope that in accordance with the theory, the sensor based on methyltrioctylammonium chloride responds to the anionic analyte. As for oleic acid, that could exist in two types of species, as molecular acid and as oleate anionic. The proportion of the two species will depend on the pH of the solution. In acidic solution, the molecular acid will be dominant, while in more basic solution the anionic species will be dominant. As the molecular acid, the lipid may interact with anionic species, while as anionic species the sensor will generate a response to cationic species. As a result, there will be a competition of cationic and anionic responses that depend on the pH of
the solution. The result in Table 3 for sensor based on oleic acid exhibited a positive slope that means the cationic response is more dominant than that of the anionic response.
The process of being sour in fresh milk is the activity ofLactobacillusin fresh milk converting lactose into lactic acid, so that the milk becomes sour (decrease in pH) [31]. In this study, an unconventional approach is attempted by adding a selective sensor to the acidic taste (H+) that is pH electrode. By the
addition of one pH probe to the series of 16-unselective membrane sensors, it strengthened the confirmation of the taste change during the process of milk decay. Our experiment showed that there was a significant change in the pH of the milk from 6.6 to 5.8, slightly acidic. An example of pH sensor signal in each group is shown in Fig. 3. The change in the pH of the solution will affect the sensitivity of the sensor based on octadecyl amine compound and oleic acid. In lower pH, the sensitivity of the sensor based on amine compound will decrease its cationic response character; while for the sensor based on oleic acid will be affected oppositely.
Fig 5. Score plot of PCA for natural goat milk, (a) without and (b) with involving pH sensor in which seven groups refer to Table 2
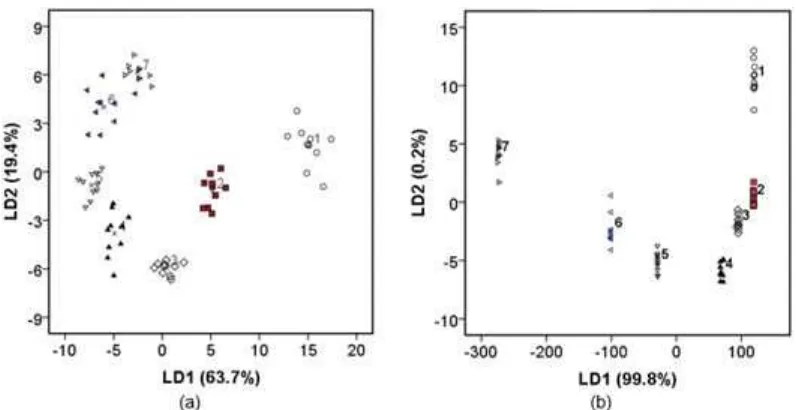
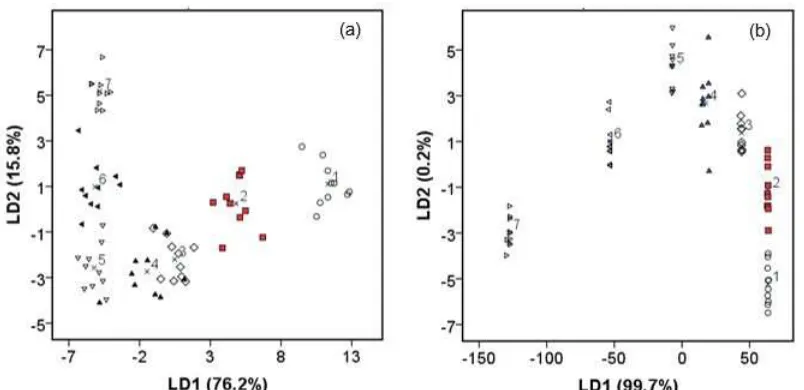
Fig 6.LDA results of seven groups of bovine milk measured using the e-tongue: (a) without and (b) with employing a pH sensor, in which seven groups refer to Table 2
response pattern of the sensors during the souring process could be used to track the souring process in the fresh milk using a chemometric method as described in the next section.
Identification Results Based on PCA
The discrimination amongst different groups of the samples was analyzed. Firstly, PCA was conducted on the recorded data. Fig. 4(a) shows the two-dimensional score plot of PCA of bovine milk (based on Dataset01) where separation amongst groups is not complete. The
variances explained by the first and the second principal
components were 74.8 and 7.9%, respectively. Similarly, Fig. 4(b) also shows that some of the groups are
overlapped. The variances explained first and the
second principal components are 70.9 and 10.4%,
respectively. It indicates that the addition of using pH sensor did not change the separation amongst the groups completely. From these two plots, there is a certain area of overlapping in which no clear differentiation could be made between bovine milk samples at the condition of fresh (0 h) to stale (12 h).
Fig 7.LDA results of seven groups of goat milk measured using the e-tongue: (a) without and (b) with employing a pH sensor, in which seven groups refer to Table 2
From both datasets, the features explain that the taste of milk samples tend to change by time.
Identification Results Based on LDA
Different from PCA, LDA is mainly used for classification. Here, a stepwise LDA procedure was then employed to visualize the distribution of groups. For this purpose, the leave-one-out cross-validation was applied to avoid overoptimistic data modulation, while the Wilks' Lambda test was carried out to verify which canonical
discriminant functions were significant.
Fig. 6(a) shows LDA plot of the 16 e-tongue
sensors (without pH sensor) for the first two discriminant
functions (LD1 and LD2). When using Dataset01 (for bovine milk), the stepwise LDA resulted in better discrimination with a complete separation amongst the groups. These two functions explained 83.1% of the total
variance of the e-tongue data to the bovine milk (the first
explaining 63.7% and the second 19.4%). All samples
(100%) are correctly classified for the original groups, but only 95.7% are correctly classified for the
cross-validation procedure. The improvement of classification based on Dataset01 obtained by employing a pH sensor in the sensor array is shown in Fig. 6(b). From this figure, the 100% groups are perfectly separated from each other. Therefore, from LDA, all samples (100%) are
correctly classified both for the original groups and for
the cross-validation procedure.
Fig. 7(a) shows LDA plot of seven groups of Dataset02 using 16 e-tongue sensors (without pH sensor) for LD1 and LD2. These two functions explained 83.1% (LD1 = 63.7% and LD2 = 19.4%) of the total variance of the e-tongue data to the goat milk. From the
validation procedure, 97.1% of Dataset02 are correctly classified for the original groups, while 87.1% of cross-validated grouped cases correctly classified. The improvement of the classification based on Dataset02 was also obtained by employing a pH sensor in the sensor array, as shown in Fig. 7(b), in which all groups are perfectly separated from each other. These two functions explained 99.9% of the total variance of the
e-tongue data to the goat milk (the first explaining
99.7% and the second 0.2%). From LDA results, all
samples (100%) are correctly classified for the original groups while 98.6% are correctly classified for the
cross-validation procedure.
CONCLUSION
ACKNOWLEDGEMENT
This study was funded in part by the Ministry of Research, Technology and Higher Education, the Republic of Indonesia No. 2384/UN1.P.III/DIT-LIT/LT/2017. The authors also thank the Directorate General of Islamic Education, the Republic of Indonesia for supporting throughout the completion of this work. Prof. A.M. Peres from LSRE - Laboratory of Separation and Reaction Engineering, Escola Superior Agrária, Bragança, Portugal and Prof. L.G. Dias from CIMO -Mountain Research Centre, Escola Superior Agrária de Bragança, Bragança, Portugal are also acknowledged for giving us the opportunity to learn how to construct lipid/polymer membranes.
REFERENCES
[1] Hadde, E.K., Nicholson, T.M., Cichero, J.A.Y., and Deblauwe, C., 2015, Rheological characterisation of thickened milk components (protein, lactose and minerals),J. Food Eng., 166, 263–267.
[2] Yang, M., Song, D., Cao, X., Wu, R., Liu, B., Ye, W., Wu, J., and Yue, X., 2017, Comparative proteomic analysis of milk-derived exosomes in human and bovine colostrum and mature milk samples by iTRAQ-coupled LC-MS/MS, Food Res. Int., 92, 17–25.
[3] Todaro, M., Palmeri, M., Settanni, L., Scatassa, M.L., Mazza, F., Bonanno, A., and Di Grigoli, A., 2017, Effect of refrigerated storage on microbiological, chemical and sensory characteristics of a ewes’ raw milk stretched cheese,Food Packag. Shelf Life, 11, 67–73.
[4] Van Asselt, E.D., Capuano, E., and van der Fels-Klerx, H.J., 2015, Sustainability of milk production in the Netherlands - A comparison between raw organic, pasteurised organic and conventional milk, Int. Dairy J., 47, 19–26.
[5] Wei, Z., Wang, J., and Jin, W., 2013, Evaluation of varieties of set yogurts and their physical properties using a voltammetric electronic tongue based on various potential waveforms, Sens. Actuators, B, 177, 684–694.
[6] Wang, B., Xu, S., and Sun, D.W., 2010, Application of the electronic nose to the identification of different milk flavorings,Food Res. Int., 43 (1), 255–262.
[7] Hruškar, M., Major, N., Krpan, M., Krbavčić, I.P., Šarić, G., Marković, K., and Vahčić, N., 2009,
Evaluation of milk and dairy products by electronic tongue,Mljekarstvo, 59 (3), 193–200.
[8] Ghasemi-Varnamkhasti, M., Saeid, S., and Siadat, M., 2010, Biomimetic-based odor and taste sensing systems to food quality and safety characterization: An overview on basic principles and recent
achievements,J. Food Eng., 100 (3), 377–387. [9] Dias, L.A., Peres, A.M., Veloso, A.C.A., Reis, F.S.,
Vilas-boas, M., and Machado, A.A.S.C., 2009, An electronic tongue taste evaluation: Identification of goat milk adulteration with bovine milk Sens. Actuators, B, 136, 209–217.
[10] Cetó, X., Gutiérrez-Capitán, M., Calvo, D., and del Valle, M., 2013, Beer classification by means of a potentiometric electronic tongue,Food Chem., 141 (3), 2533–2540.
[11] Platikanov, S., Garcia, V., Fonseca, I., Rullán, E., Devesa, R., and Tauler, R., 2012, Influence of minerals on the taste of bottled and tap water: A chemometric approach, Water Res., 47 (2), 693– 704.
[12] Kaltsum, U., Triyana, K., and Siswanta, D., 2014, Development of taste sensor system for differentiation of Indonesian herbal medicines,AIP Conf. Proc., 1617, 100–104.
[13] Manuel, J., Haddi, Z., Amari, A., Bouchikhi, B., Mimendia, A., and Cetó, X., 2013, Hybrid electronic tongue based on multisensor data fusion for discrimination of beers,Sens. Actuators, B, 177, 989–996.
[14] Tiwari, K., Tudu, B., Bandyopadhyay, R., and Chatterjee, A., 2013, Identification of monofloral honey using voltammetric electronic tongue, J. Food Eng., 117 (2), 205–210.
[15] Wang, Y., Feng, Y., Wu, Y., Liang, S., and Xu, D., 2013, Sensory evaluation of the taste of berberine hydrochloride using an Electronic Tongue, Fitoterapia, 86, 137–143.
[16] Yang, Y., Chen, Q., Shen, C., Zhang, S., Gan, Z., Hu, R., Zhao, J., and Ni, Y., 2013, Evaluation of monosodium glutamate, disodium inosinate and guanylate umamitaste by an electronic tongue, J. Food Eng., 116 (3), 627–632.
[17] Sipos, L., Kovács, Z., Sági-Kiss, V., Csiki, T., Kókai, Z., Fekete, A., and Héberger, K., 2012, Discrimination of mineral waters by electronic tongue, sensory evaluation and chemical analysis, Food Chem., 135 (4), 2947–2953.
[18] Haddi, Z., Mabrouk, S., Bougrini, M., Tahri, K., Sghaier, K., Barhoumi, H., El Bari, N., Maaref, A., Jaffrezic-Renault, N., and Bouchikhi, B., 2014, E-Nose and e-Tongue combination for improved recognition of fruit juice samples, Food Chem., 150, 246–253.
[19] Dias, L.A., Peres, A.M., Vilas-Boas, M., Rocha, M.A., Estevinho, L., and Machado, A.A.S.C., 2008, An electronic tongue for honey classification, Microchim. Acta, 163 (1-2), 97–102.
preferences,J. Sens. Stud., 25 (3), 431–446. [21] Chen, Q., Zhao, J., and Vittayapadung, S., 2008,
Identification of the green tea grade level using electronic tongue and pattern recognition, Food Res. Int., 41 (5), 500–504.
[22] Lin, H., Yan, Y., Zhao, T., Peng, L., Zou, H., Li, J., Yang, X., Xiong, Y., Wang, M., and Wu, H., 2013, Rapid discrimination of Apiaceae plants by electronic nose coupled with multivariate statistical analyses,J. Pharm. Biomed. Anal., 84, 1–4.
[23] Ouyang, Q., Zhao, J., and Chen, Q., 2013, Classification of rice wine according to different marked ages using a portable multi-electrode electronic tongue coupled with multivariate analysis, Food Res. Int., 51 (2), 633–640.
[24] Kang, B.S., Lee, J.E., and Park, H.J., 2014, Electronic tongue-based discrimination of Korean rice wines (makgeolli) including prediction of sensory evaluation and instrumental measurements,Food Chem., 151, 317–323.
[25] Novakowski, W., Bertotti, M., and Paixão, T.R.L.C., 2011, Use of copper and gold electrodes as sensitive elements for fabrication of an electronic tongue: Discrimination of wines and whiskies,
Microchem. J., 99 (1), 145–151.
[26] Masnan, M.J., Mahat, N.I., Zakaria, A., Shakaff, A.Y.M., and Adom, A.H., 2012, Enhancing classification performance of multisensory data through extraction and selection of features, Procedia Chem., 6, 132–140.
[27] Loutfi, A., Coradeschi, S., Mani, G.K., Shankar, P., and Rayappan, J.B.B., 2015, Electronic noses for
food quality : A review, J. Food Eng., 144, 103– 111.
[28] Peris, M., and Escuder-Gilabert, L., 2013, On-line monitoring of food fermentation processes using electronic noses and electronic tongues: A review, Anal. Chim. Acta, 804, 29–36.
[29] Dias, L.G., Peres, A.M., Barcelos, T.P., Morais, J.S., and Machado, A.A.S.C., 2011, Semi-quantitative and Semi-quantitative analysis of soft drinks using an electronic tongue, Sens. Actuators, B, 154 (2), 111–118.