ABSTRACT:
Atmospheric quality dramatically deteriorates over the past decades around the metropolitan areas of China. Due to the coal combustion, industrial air pollution, vehicle waste emission, etc., the public health suffers from exposure to such air pollution as fine particles of particulates, sulfur and carbon dioxide, etc. Many meteorological stations have been built to monitor the condition of air quality over the city. However, they are installed at fixed sites and cover quite a small region. The monitoring results of these stations usually do NOT coincide with the public perception of the air quality. This paper is motivated to mimic the human breathing along the citys transportation network by the mobile sensing vehicle of atmospheric quality. To obtain the quantitative perception of air quality, the Environmental Monitoring Vehicle of Wuhan University (EMV-WHU) has been developed to automatically collect the data of air pollutants. The EMV-WHU is equipped with GPS/IMU, sensors of PM2.5, carbon dioxide, anemometer, temperature, humidity, noise, and illumination, as well as the visual and infrared camera. All the devices and sensors are well collaborated with the customized synchronization mechanism. Each sort of atmospheric data is accompanied with the uniform spatial and temporal label of high precision. Different spatial and data-mining techniques, such as spatial correlation analysis, logistic regression, spatial clustering, are employed to provide the periodic report of the roadside air quality. With the EMV-WHU, constant collection of the atmospheric data along the Luoyu Road of Wuhan city has been conducted at the daily peak and non-peak time for half a year. Experimental results demonstrated that the EMV is very efficient and accurate for the perception of air quality. Comparative findings with the meteorological stations also show the intelligence of big data analysis and mining of all sorts of EMV measurement of air quality. It is promising for the aerial and emergent air quality monitoring over the sky of big cities, if EMV-WHU be miniaturized for the unmanned aerial vehicles(UAV) in the future.
1. INTRODUCTION
Atmospheric quality dramatically deteriorates over the past decades around the metropolitan areas of China. Due to the coal combustion, industrial air pollution, vehicle waste emission, etc., the public health suffers from exposure to such air pollution as fine particles of particulates, sulfur and carbon dioxide, etc. Peo-ple began to demand environmental quality information, such as air quality, wind speed, temperature, light intensity, etc.. In order To obtain the quantitative perception of air quality, the Environ-mental Monitoring Vehicle of Wuhan University (EMV-WHU) has been developed to automatically collect the data of air pol-lutants. The EMV-WHU is equipped with GPS/IMU, sensors of PM2.5, carbon dioxide, anemometer, temperature, humidity, noise, and illumination, as well as the visual and infrared cam-era(Hiremath et al., 2015). As each sensor operating frequency is not the same, a synchronous controller is designed to issue a syn-chronous trigger signal to the host computer, so that the host can collect all sensor data according to different trigger mode and the frequency(Bobek et al., 2016). The EMV - WHU can quickly get the current various environmental indicators, and share the infor-mation through the Internet. Users can know PM2.5 indicators, wind speed, light intensity, temperature and humidity immedi-ately, and then decide whether it is suitable for outdoor exercise, shopping, travel, etc..
2. ENVIRONMENTAL MONITORING SYSTEM
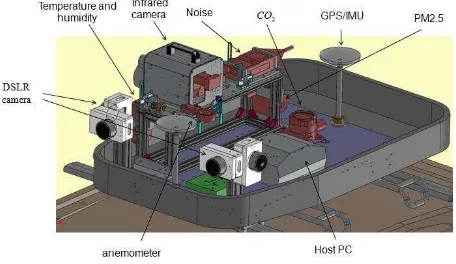
Environmental Monitoring system is mounted on the SUV roof. The system is fixed by a bracket on the roof and powered by a large capacity lithium battery(Gstaiger et al., 2015). The system can be commanded from inside the Vehicle via LAN.EMV-WHU
Figure 1. Environmental monitoring system
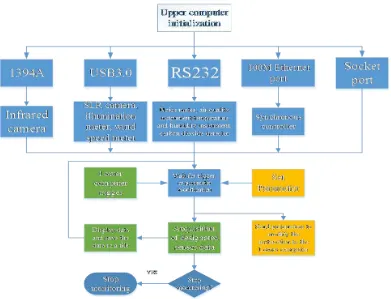
is equipped with a lot of sensors, the interface of the various sen-sors are not the same, such as: RS232, RS485, USB3.0, USB2.0, 1394A FireWire. Figure 2 depicts the association of each sensor and device.
1. The noise meter is connected to the serial port 1 of the In-dustrial Personal Computer (IPC) via RS232.
2. PM2.5 detector connected to the IPC serial port 2 via RS232.
Figure 2. Connection of sensors
4. Carbon dioxide detector connected to the IPC serial port 4 via the RS232.
5. The illuminometer is connected to the USB port of the IPC via USB cable.
6. The anemometer is connected to the USB port of the IPC via USB cable.
7. GPS / IMU is connected to the synchronization controller via RS232 serial port.
8. The encoder is connected to the synchronization controller via a dedicated interface.
9. DSLR camera to connect IPC via USB3.0.
10. The infrared camera is connected to the IPC via the 1394A bus.
In addition to the above sensors, the IPC is also connected to the synchronization controller via the module of Ethernet to SPI (Serial Peripheral Interface) , and connected to the monitor via the VGA, and connected to keyboard and mouse via 2.4G wireless.
3. PROGRAM DESIGN
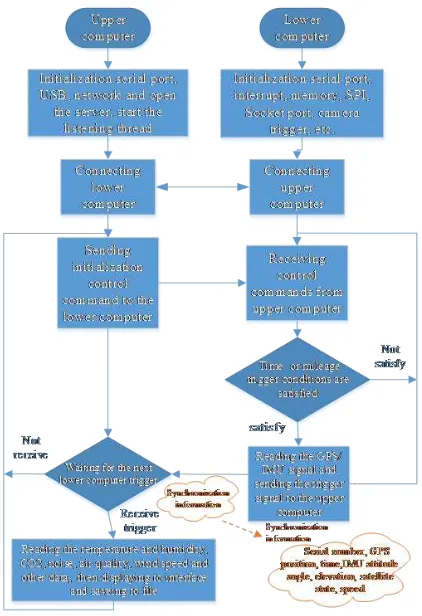
The whole system program is divided into upper computer pro-gram and lower computer propro-gram. The interaction between the upper computer and the lower computer is shown in Fig3.
3.1 Upper computer software
The main function of the upper computer program is to integrate all the instruments and synchronization boards together. The pro-gram will receive and analyze the synchronization information sent from the socket port of the synchronization board and dis-play some key information on the interface(Matz et al., 2016).
Figure 3. The connection of the upper computer and lower computer
con-Figure 4. The flow chart of the upper computer
nection until the connection is successful. When the connection is established successfully, the upper computer will receive user set-tings through the program interface . Finally, the upper computer will receive synchronization trigger signal of the lower computer. The trigger signal contains synchronization information. When the program receives the synchronization information, the pro-gram will collect the sensor data. Then the sensor data will be analyzed and displayed on the program interface(Campbell et al., 2014). The analyzed synchronization information and sensor data are saved to the project directory.
Program operations include new projects, parameter settings, start monitoring, stop monitoring, and camera data export. all key operation function is as follows:
1. New project: In order to export data collection, the program needs to first create a new project in the corresponding di-rectory, and then select the program need to use the sensor.
2. Stop detection: When this button is pressed, the sensor will stop collecting data.
3. Parameter setting: The program can query the status of the synchronization controller and set the trigger mode during the process of collecting data.
4. Camera data: Finally, after the data acquisition is complete, the button of camera data can export all the camera data to the project directory under the camera data folder.
3.2 Lower computer software
The main function of the lower computer is to be a synchronous controller and read the GPS / IMU and the encoder signal. As
the synchronous controller does not support Ethernet, the system uses a module of SPI to Ethernet to establish the connection be-tween the upper computer and the lower computer. When the lower computer is turned on, the program will first be initialized. The initialization purpose is to initialize the GPS / IMU, Encoder, Serial port, SPI and set the listening server to listen to eight ports. Then the lower computer sends the connection signal to the host computer. Then the lower computer sends the connection sig-nal to the host computer. If the connection fails, the program will send the connection signal until the connection is established suc-cessfully. After the connection is established, the lower computer enters the waiting phase and waits for the parameter modification instruction(Chiuchisan et al., 2016). When the lower computer receives the parameter modification instruction, the program will follow the instructions to modify the corresponding parameters, such as select trigger mode between the time trigger and mileage trigger, set the time trigger interval, set the mileage trigger inter-val, switch to stop monitoring. When the synchronization trigger condition is satisfied, the program will collect the GPS / IMU signal. These signals are packed into synchronization informa-tion and sent to the host computer. Then the host computer will collect the data of the specified sensor.
3.3 Synchronous triggering mechanism
sys-Figure 5. The flow chart of the lower computer
tem data is unreasonable. Therefore, the system specially set up a synchronous trigger controller. The principle of Synchronous controller is send different acquisition frequency of trigger sig-nal based on different sensors. Trigger mode is divided into two types: time trigger and distance trigger, or internal trigger and external trigger. When the trigger mode is set to time trigger, the controller collects the GPS / IMU signal when the trigger con-dition is satisfied. GPS / IMU signal will be packaged into the synchronization information on the trigger signal, and then sent to the host computer(Kim, 2016). The host computer will collect the data of the specified sensor after receiving the trigger signal. When the trigger mode is set to the distance trigger, the controller calculates the distance according to the encoder mounted on the wheel. According to the different trigger distance interval of each sensor , once the mileage trigger interval conditions are satisfied, the controller will collect GPS / IMU signal. GPS / IMU signal will be packaged into the synchronization information on the trig-ger signal, and then sent to the host computer. The host computer will collect the data of the specified sensor after receiving the trig-ger signal. In the process of collecting data, the host computer can send commands to start or stop the synchronization controller.
4. EXPERIMENTAL RESULTS
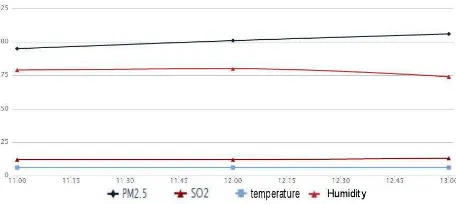
After the completion of the design of the entire environmental monitoring system, some of the actual monitoring data has been collected in Wuhan Wu Luo Road. These data are analyzed and processed to be produced as figure 7.
Figure 8 is some of the data from the government website. Rely on the data in the figure, some obvious problems can be found.
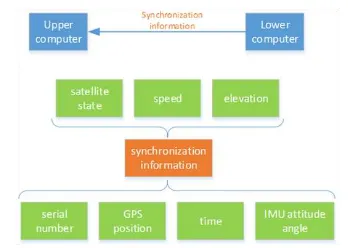
Figure 6. The structure of synchronization information
First of all, these monitoring data collection cycle is long, so it can not reflect the environmental quality of a moment. Second, these data reflect the average quality of a large area, and can not reflect the actual changes in a small place. On the contrary, envi-ronmental monitoring vehicles can frequently gather on a small area. Obviously, the data collected by the environmental monitor-ing vehicle can more accurately reflect the situation in this small area.
Figure 7. Some data of air quality from EMV-WHU
5. CONCLUSION
dif-ferent voltage to each sensor, such as 24V, 12V, 9V, 7.6V, 6V and so on. The system achieve the command transmission and syn-chronization trigger between the the host computer and the lower computer through the transmission protocol.
As some sensors are not fully open source, the system still has a problem. The system can only read data from the sensor, and can not control the sensor boot and standby operation. This make some sensors can not be turned into the running state when the system power on. The system requires a manual operation of the sensor to start the machine. These problem still need to find other ways to solve later.
REFERENCES
Bobek, S., Nalepa, G. J., Adrian, W. T. and Kaczor, K., 2016. Mobile context-based framework for threat monitoring in urban environment with social threat monitor. Multimedia Tools and Applications75(17), pp. 10595–10616.
Campbell, V. L., Lear, K. L., Vacha, B. J., Zacher, J. and Notaros, O. K., 2014. Multi-sensor environmental and physiological mon-itor system and methods of use. US Patent 8,830,068.
Chiuchisan, I., Geman, O., Prelipceanu, M. and Costin, H.-N., 2016. Health care system for monitoring older adults in a” green” environment using organic photovoltaic devices. Environmental Engineering & Management Journal (EEMJ).
Gstaiger, V., R¨omer, H., Rosenbaum, D. and Henkel, F., 2015. Airborne camera system for real-time applications-support of a national civil protection exercise. The International Archives of Photogrammetry, Remote Sensing and Spatial Information Sci-ences40(7), pp. 1189.
Hiremath, S. V., Intille, S. S., Kelleher, A., Cooper, R. A. and Ding, D., 2015. Detection of physical activities using a physical activity monitor system for wheelchair users. Medical engineer-ing & physics37(1), pp. 68–76.
Kim, H.-J., 2016. Development of a moving monitor system for growing crops and environmental information in green house.
The Journal of Korea Institute of Information, Electronics, and Communication Technology9(3), pp. 285–290.