Katalog BPS:
6205004
2014
STATISTIK
CAPTIVE POWER
2014
ISSN
: 2354-6867
No. Publikasi
: 05330.1409
Katalog BPS
: 6205004
Ukuran Buku
: 28 cm x 21 cm
Halaman
: xiii + 54 halaman
Naskah :
Gambar Kulit :
Subdirektorat Publikasi dan Kompilasi Statistik
Diterbitkan oleh :
Badan Pusat Statistik, Indonesia
Dicetak oleh :
Boleh dikutip dengan menyebut sumbernya
TIM PENYUSUN/ TEAM MEMBERS
Editor/ Editors :
Sodikin Baidowi, M.Stat.
Edi Prawoto, M.App.Econ.
Penulis/ Contributors :
Intan Nafisah, S.ST.
Nesti Dwiningrum, S.ST.
Pengolah Data/ Data Processing :
Intan Nafisah, S.ST.
Ika Wahyu Pradipta, S.ST.
v
Kata Pengantar
Statistik Captive Power 2014 merupakan penerbitan kelima dari publikasi
Statistik Captive Power oleh Badan Pusat Statistik. Publikasi ini menyajikan data
energi listrik yang diproduksi oleh instansi pemerintah dan perusahaan komersial
untuk memenuhi kebutuhan energi listrik. Data energi listrik tersebut sangat
bermanfaat untuk mengetahui secara komprehensif volume produksi dan kebutuhan
energi listrik nasional.
Kami menyadari akan keterbatasan cakupan penyajian data Statistik Captive
Power tahun ini yang masih terbatas pada kegiatan bandar udara, stasiun, pelabuhan/
dermaga, penerbangan komersil, angkutan kereta, angkutan air dan bioskop. Kedepan,
kami akan mencoba melengkapi cakupan sektor kegiatan sehingga dapat memperoleh
data captive power yang lebih komprehensif.
Akhirnya, kami mengharapkan saran dan masukan dari pengguna data untuk
penyempurnaan publikasi mendatang.
Jakarta, November 2014
KEPALA BADAN PUSAT STATISTIK
Dr. Suryamin, M.Sc.
vi
Preface
Indonesian Captive Power Statistics 2014 is a fifth edition of the Captive
Power Statistics Publication issued by BPS - Statistics Indonesia. This publication
presents electricity energy data covering production and consumption of electricity by
company. This publication is very useful for assessing and formulating electricity
energy policy in Indonesia.
The activity coverage on this publication are airports, train stations,
harbours, passenger air transports, railways transports, water transportations and
cinemas. We are aware of coverage limitation on this issues due to unavailability of
data sources. For the next year, another activities will be added for more
comprehensif captive power data.
Finally, suggestions for further improvements are always welcome.
Jakarta, November 2014
BPS-Statistics Indonesia
Dr. Suryamin, M.Sc.
Chief Statistician
Statistik Captive Power/Captive Power Statistics vii
DAFTAR ISI/CONTENTS
Halaman
Page
Kata Pengantar /Preface ... ………
v
Daftar Isi /Contents ... ………
vii
Daftar Tabel /List of Table...
viii
Daftar Gambar /List of Figure ...
xii
Tanda-tanda /Symbols ...
xiii
Penjelasan Umum /General Explanation ... ………
3
Ulasan Ringkas /Brief Review ... ………
9
Tabel-tabel /Tables ... ………
17
viii Statistik Captive Power/Captive Power Statistics
DAFTAR TABEL/LIST OF TABLES
Halaman
Page
Tabel
1.1 Persentase Jumlah Bandar Udara Menurut Provinsi dan Sumber
Table
Tenaga Listrik yang Digunakan
Percentage of Airports by Province and Source of Electricity
Used ...
17
Tabel
1.2 Persentase Jumlah Stasiun Kereta Menurut Provinsi dan Sumber
Table
Tenaga Listrik yang Digunakan
Percentage of Train Stations by Province and Source of Electricity
Used ...
18
Tabel
1.3 Persentase Jumlah Pelabuhan/ Dermaga Menurut Provinsi dan
Table
Sumber Tenaga Listrik yang Digunakan
Percentage of Harbours by Province and Source of Electricity
Used ...
19
Tabel
1.4 Persentase Jumlah Perusahaan Penerbangan Komersil Menurut
Table
Provinsi dan Sumber Tenaga Listrik yang Digunakan
Percentage of Passenger Air Transport Establishments by
Province and Source of Electricity Used ...
20
Tabel
1.5 Persentase Jumlah Perusahaan Angkutan Kereta Menurut Provinsi
Table
dan Sumber Tenaga Listrik yang Digunakan
Percentage of Railways Transport Establishments by Province
and Source of Electricity Used ...
21
Tabel
1.6 Persentase Jumlah Perusahaan Angkutan Air Menurut Provinsi dan
Table
Sumber Tenaga Listrik yang Digunakan
Percentage of Water Transportation Establishments by Province
and Source of Electricity Used ...
22
Tabel
1.7 Persentase Jumlah Bioskop Menurut Provinsi dan Sumber Tenaga
Table
Listrik yang Digunakan
Percentage of Cinemas by Province and Source of Electricity
Used ...
23
Tabel
2
Rata-Rata Daya Terpasang Listrik Berlangganan Menurut Provinsi
Table
dan Jenis Kegiatan Usaha
Average Electricity Installed Capacities by Province
and Kind of Activity ...
24
Tabel
3
Rata-Rata Pemakaian Listrik Berlangganan per Perusahaan
Table
Menurut Provinsi dan Jenis Kegiatan Usaha Selama Setahun
Average Electricity Consumpt by a Company by Province and Kind
of Activity for a Year ...
25
Tabel
4
Rata-rata Harga Listrik Berlangganan per Kwh Menurut Provinsi
Table
dan Jenis Kegiatan Usaha
Average Value of Electricity Consumed per Kwh in a Month
by Province and Kind of Activity ...
26
http://www.bps.go.id
Statistik Captive Power/Captive Power Statistics ix
Tabel
5
Rata-Rata Nilai Pemakaian Listrik Berlangganan per Perusahaan
Table
per Bulan Menurut Provinsi dan Jenis Kegiatan Usaha
Average Value of Electricity Consumpt by an Establishment for
a Month by Province and Kind of Activity ...
27
Tabel
6.1 Persentase Jumlah Bandar Udara Menurut Provinsi dan Persentase
Table
Biaya Listrik Terhadap Biaya Operasional
Percentage of Airports by Province and Percentage of Electricity
Cost to Total Operating Cost ...
28
Tabel
6.2 Persentase Jumlah Stasiun Kereta Menurut Provinsi dan Persentase
Table
Biaya Listrik Terhadap Biaya Operasional
Percentage of Train Stations by Province and Percentage
of Electricity Cost to Total Operating Cost ...
29
Tabel
6.3 Persentase Jumlah Pelabuhan/ Dermaga Menurut Provinsi dan
Table
Persentase Biaya Listrik Terhadap Biaya Operasional
Percentage of Harbours by Province and Percentage of
Electricity Cost to Total Operating Cost ...
30
Tabel
6.4 Persentase Jumlah Perusahaan Penerbangan Komersil Menurut
Table
Provinsi dan Persentase Biaya Listrik Terhadap Biaya Operasional
Percentage of Passenger Air Transport Establishments by Province
and Percentage of Electricity Cost to Total Operating Cost ...
31
Tabel
6.5 Persentase Jumlah Perusahaan Angkutan Kereta Menurut Provinsi
Table
dan Persentase Biaya Listrik Terhadap Biaya Operasional
Percentage of Railways Transport Establishments by Province
and Percentage of Electricity Cost to Total Operating Cost ...
32
Tabel
6.6 Persentase Jumlah Perusahaan Angkutan Air Menurut Provinsi dan
Table
Persentase Biaya Listrik Terhadap Biaya Operasional
Percentage of Water Transportation Establishments by Province
and Percentage of Electricity Cost to Total Operating Cost ...
33
Tabel
6.7 Persentase Jumlah Bioskop Menurut Provinsi dan Persentase Biaya
Table
Listrik Terhadap Biaya Operasional
Percentage of Cinemas by Province and Percentage of Electricity
Cost to Total Operating Cost ...
34
Tabel
7.1 Persentase Jumlah Bandar Udara Menurut Provinsi dan Periode
Table
Tahun Awal Penggunaan Generator Listrik
Percentage of Airports by Province and Starting Year Period of
Using Electricity Generator ...
35
Tabel
7.2 Persentase Jumlah Stasiun Kereta Menurut Provinsi dan Periode
Table
Tahun Awal Penggunaan Generator Listrik
Percentage of Train Stations by Province and Starting Year
Period of Using Electricity Generator ...
36
Tabel
7.3 Persentase Jumlah Pelabuhan/ Dermaga Menurut Provinsi dan
Table
Periode Tahun Awal Penggunaan Generator Listrik
Percentage of Harbours by Province and Starting Year
Period of Using Electricity Generator ...
37
http://www.bps.go.id
x Statistik Captive Power/Captive Power Statistics
Tabel
7.4 Persentase Jumlah Perusahaan Penerbangan Komersil Menurut
Table
Provinsi dan Periode Tahun Awal Penggunaan Generator Listrik
Percentage of Passenger Air Transport Establishment by Province
and Starting Year Period of Using Electricity Generator ...
38
Tabel
7.5 Persentase Jumlah Perusahaan Angkutan Kereta Menurut Provinsi
Table
dan Periode Tahun Awal Penggunaan Generator Listrik
Percentage of Railways Transport Establishments by Province
and Starting Year Period of Using Electricity Generator ...
39
Tabel
7.6 Persentase Jumlah Perusahaan Angkutan Air Menurut Provinsi dan
Table
Periode Tahun Awal Penggunaan Generator Listrik
Percentage of Water Transportations Establishments by Province
and Starting Year Period of Using Electricity Generator ...
40
Tabel
7.7 Persentase Jumlah Bioskop Menurut Provinsi dan Periode Tahun
Table
Awal Penggunaan Generator Listrik
Percentage of Cinemas by Province and Starting Year Period of
Using Electricity Generator ...
41
Tabel
8.1 Persentase Jumlah Bandar Udara Menurut Provinsi dan Rata-Rata
Table
Kapasitas Generator Listrik yang Digunakan
Percentage of Airports by Province and Average of Electricity
Generator Capacity Used ...
42
Tabel
8.2 Persentase Jumlah Stasiun Kereta Menurut Provinsi dan Rata-Rata
Table
Kapasitas Generator Listrik yang Digunakan
Percentage of Train Stations by Province and Average of Electricity
Generator Capacity Used ...
43
Tabel
8.3 Persentase Jumlah Pelabuhan/ Dermaga Menurut Provinsi dan
Table
Rata-Rata Kapasitas Generator Listrik yang Digunakan
Percentage of Harbours by Province and Average of
Generator Capacity Used ...
44
Tabel
8.4 Persentase Jumlah Perusahaan Penerbangan Komersil Menurut
Table
Provinsi dan Rata-Rata Kapasitas Generator Listrik yang
Digunakan
Percentage of Passenger Air Transport Establishment by Province
and Average of Generator Capacity Used ...
45
Tabel
8.5 Persentase Jumlah Perusahaan Angkutan Kereta Menurut Provinsi
Table
dan Rata-Rata Kapasitas Generator Listrik yang Digunakan
Percentage of Railways Transport Establishment by Province
and Average of Electricity Generator Capacity Used ...
46
Tabel
8.6 Persentase Jumlah Perusahaan Angkutan Air Menurut Provinsi dan
Table
Rata-Rata Kapasitas Generator Listrik yang Digunakan
Percentage of Water Transportation Establishments by Province
and Average of Electricity Generator Capacity Used ...
47
Tabel
8.7 Persentase Jumlah Bioskop Menurut Provinsi dan Rata-Rata
Table
Kapasitas Generator Listrik yang Digunakan
Percentage of Cinemas by Province and Average of Electricity
Generator Capacity Used ...
48
http://www.bps.go.id
Statistik Captive Power/Captive Power Statistics xi
Tabel
9.1 Rata-rata Volume Pemakaian Minyak Solar dan Bensin Selama
Table
Setahun oleh Bandar Udara Menurut Provinsi
Average Volume of Automotive Diesel Oil (HSD) and Gasoline
Consumed by Airports in Year by Province ...
49
Tabel
9.2 Rata-rata Volume Pemakaian Minyak Solar dan Bensin Selama
Table
Setahun oleh Stasiun Kereta Menurut Provinsi
Average Volume of Automotive Diesel Oil (HSD) and Gasoline
Consumed by Train Stations in Year by Province ...
50
Tabel
9.3 Rata-rata Volume Pemakaian Minyak Solar dan Bensin Selama
Table
Setahun oleh Pelabuhan/ Dermaga Menurut Provinsi
Average Volume of Automotive Diesel Oil (HSD) and Gasoline
Consumed by Harbours in Year by Province ...
51
Tabel
9.4 Rata-rata Volume Pemakaian Minyak Solar dan Bensin Selama
Table
Setahun oleh Perusahaan Penerbangan Komersil Menurut Provinsi
Average Volume of Automotive Diesel Oil (HSD) and Gasoline
Consumed by Passenger Air Transport Establishments
in Year by Province ...
52
Tabel
9.5 Rata-rata Volume Pemakaian Minyak Solar dan Bensin Selama
Table
Setahun oleh Perusahaan Angkutan Kereta Menurut Provinsi
Average Volume of Automotive Diesel Oil (HSD) and Gasoline
Consumed by Railways Transport Establishments
in Year by Province ...
53
Tabel
9.6 Rata-rata Volume Pemakaian Minyak Solar dan Bensin Selama
Table
Setahun oleh Perusahaan Angkutan Air Menurut Provinsi
Volume of Automotive Diesel Oil (HSD) and Gasoline Consumed
by Water Transportation Establishments in Year by Province ...
54
Tabel
9.7 Rata-rata Volume Pemakaian Minyak Solar dan Bensin Selama
Table
Setahun oleh Bioskop Menurut Provinsi
Volume of Automotive Diesel Oil (HSD) and Gasoline Consumed
by Cinemas in Year by Province ...
55
Tabel
10
Rata-rata Listrik yang Dibangkitkan Menurut Provinsi dan
Table
Kegiatan Usaha Selama Setahun
Average of Electricity Production by Province and
Kind of Activity in Year ...
56
Tabel
11
Rata-rata Pengeluaran Pemakaian Bahan Bakar Untuk
Table
Pembangkitan Listrik Menurut Provinsi dan Jenis Kegiatan Usaha
Selama Setahun
Average of Expenditure of Fuel Consumed for Generate Electricity
by Province and Kind of Activity in Year...
57
http://www.bps.go.id
xii Statistik Captive Power/Captive Power Statistics
DAFTAR GAMBAR/LIST OF FIGURES
Halaman
Page
Gambar 1
Persentase Perusahaan dengan Captive Power Menurut Sektor Kegiatan
Figure
Tahun 2013
Percentage of Captive Power Establishments by Activity
Sector, 2013 ...
10
Gambar 2
Persentase Generator Listrik yang Digunakan Menurut Kapasitas
Figure
Terpasang Tahun 2013
Percentage of Electricity Generating Unit Used by Installed
Capacity, 2013 ...
11
Gambar 3
Rata-rata Produksi dan Pembelian Listrik Tahun 2013
Figure
Average Electricity Production and Purchasing, 2013 ...
12
Gambar 4
Rata-rata Volume Konsumsi Bahan Bakar Tahun 2013
Figure
Average Volume of Fuel Consumed, 2013 ...
13
Statistik Captive Power/Captive Power Statistics xiii
TANDA-TANDA/SYMBOLS
Data tidak tersedia/Data not available ………... : …
Tidak ada atau nol/Null or zero ……….. : -
xiv Statistik Captive Power/Captive Power Statistics
PENJELASAN UMUM
GENERAL EXPLANATION
Statistik Captive Power / Captive Power Statistics 3
PENJELASAN UMUM
I. Pendahuluan
Energi listrik merupakan salah satu jenis
energi
yang
ketersediaannya
sangat
dibutuhkan oleh perusahaan, baik yang
melakukan secara komersial maupun non
komersial. Banyak kegiatan yang sangat
tergantung pada kontinuitas ketersediaan
energi listrik, diantaranya adalah bandar
udara,
stasiun,
pelabuhan/dermaga,
penerbangan komersial, angkutan kereta,
angkutan
air
dan
bioskop.
Belum
terjaminnya
penyediaan
listrik
mengharuskan
mereka
melakukan
pemenuhan
kebutuhan
energi
listrik
melalui pembangkitan listrik sendiri.
Publikasi ini memuat data tentang kegiatan
pembangkitan listrik untuk kebutuhan
sendiri yang dilakukan oleh perusahaan
tahun 2013. Data yang disajikan dalam
publikasi
ini
merupakan
hasil
dari
pelaksanaan Survei Captive Power yang
telah dilaksanakan oleh Badan Pusat
Statistik (BPS) pada tahun 2014.
GENERAL EXPLANATION
I. Introduction
Electricity is one of energy type that its
availability indeed needed by both
commercial
and
non
commercial
company. There are many sectors which
really sustained to the continuity of
electric energy supply. Some of them are
airports,
train
stations,
harbours,
passenger
air
transports,
railways
transports, water transportations and
cinemas. Not guaranted and supplies of
electricity pushed them to fulfill their need
through their own electric production that
was using own power plant.
This publication provide data on captive
power during 2013. The data presented in
this publication was the result of the
annual survey of Captive Power in 2014.
II. Tujuan dan Sasaran Survei
Tujuan dan sasaran dari Survei Captive
Power
adalah
untuk
mendapatkan
informasi tentang:
a. Konsumsi energi listrik perusahaan.
b. Besarnya
energi
listrik
yang
dibangkitkan sendiri.
II. The Objectives
The objective of the annual Captive Power
survey are collecting information about :
a. Electricity consumed companies
b. Volume of electricity generated by own
power plant .
4 Statistik Captive Power/ Captive Power Statistics
III. Ruang Lingkup Survei
Perusahaan yang dicakup dalam survei ini
mencakup perusahaan yang melakukan
kegiatan di sektor-sektor sebagai berikut:
a. Jasa Kebandarudaraan mencakup
perusahaan yang melayani jasa
pendaratan,
penempatan
dan
penyimpanan
pesawat
udara
(PJP4U),
jasa
pelayanan
penerbangan
(JP2)
dan
jasa
pelayanan pemakaian garbarata/
belalai (avio bridge).
b. Jasa Stasiun Kereta mencakup
perusahaan yang melayani jasa
perkeretaapian
meliputi
penjadwalan keberangkatan kereta
api dan pelayanan naik turun
penumpang.
c. Jasa Pelabuhan/Dermaga mencakup
perusahaan yang melayani jasa
pengoperasian fasilitas terminal,
navigasi, pelayaran dan kegiatan
kepelabuhan
lainnya
untuk
angkutan laut, sungai, danau dan
penyeberangan.
d. Penerbangan Komersial mencakup
perusahaan yang memberikan jasa
angkutan bagi penumpang dan
barang melalui udara, termasuk jasa
penjualan tiket yang berada di
bawah
manajemen
maskapai
penerbangan.
III. Coverage
The establishments sectors covered in this
survey were as follow:
a. The
Airport
services,
includes
companies that provide landings
service, placement and storage of
aircraft (PJP4U), flight services
(JP2) and the use of garbarata
services/ trunk (avio bridge).
b. Train
station
services
include
companies that provide railway
services include scheduling train
departures and up and down the
passenger.
c. Harbour
services,
include
companies that provide operation of
terminal
facilities
services,
navigation, shipping and other
harbour activities for sea transport,
rivers, lakes and crossings.
d. Passenger air transports, include
companies that provide services for
transport of passengers and goods
by air, including ticket sales services
which are under management of the
airlines.
Statistik Captive Power / Captive Power Statistics 5
e. Angkutan Kereta mencakup angkutan
rel untuk penumpang dan barang
yang menggunakan jalan rel kereta,
baik melayani antarkota maupun
dalam kota.
f. Angkutan Air mencakup perusahaan
yang memberikan jasa angkutan bagi
penumpang dan barang melalui laut,
danau, sungai dan penyeberangan,
baik
bertrayek
maupun
tidak.
Termasuk
pengoperasian
kapal
penarik dan pendorong, kapal pesiar,
wisata atau penjelajah, fery, taksi air
dan lain-lain.
g. Bioskop
mencakup
usaha
penyelenggara pemutaran film atau
video tape di bioskop, di ruang
terbuka atau di tempat pemutaran
film lainnya dan kegiatan klub
cinema.
IV. Konsep dan Definisi
1. Captive
Power
adalah
usaha
pembangkitan listrik untuk memenuhi
kebutuhan energi listrik sendiri.
2. Generator listrik adalah sebuah alat
yang
membangkitkan/memproduksi
energi listrik dari sumber energi
mekanikal,
biasanya
dengan
menggunakan induksi elektromagnetik
.
e. Railways transports, include rail
transport for passengers and goods
using the railways, serving both
intercity and in the city.
f. Water
transportations,
include
companies
that
provide
transportation
services
for
passengers and goods by sea, lakes,
rivers and crossings, with trayek or
without
trayek.
Including
the
operation of the towing vessel and
driving, cruises, tours or explorers,
fery, water taxis and others.
g. Cinemas,
includes
business
organizer of film or video tape
playback in cinemas, in open spaces
or in other film screenings and
activities of cinema clubs.
IV. Concept and Definition
1. Captive Power is an establishment to
generate electricity by own generator
to fullfil own electricity need.
2. Electricity Generating Unit is unit to
generate electricity from mechanical
energy
using
electromagnetic
induction.
6 Statistik Captive Power/ Captive Power Statistics
3. PLN adalah PT PLN (Persero), yaitu
perusahaan
penyedia
listrik
milik
negara. Listrik PLN dialirkan ke tempat
pelanggan melalui instalasi listrik dan
penggunaannya terukur dengan meteran
listrik.
4. Listrik Swasta adalah perusahaan
penyedia listrik milik swasta. Listrik
Swasta dialirkan ke tempat pelanggan
melalui instalasi listrik dan biasanya
jarak pelanggan dan perusahaan Swasta
tidak berjauhan. Penggunaan listrik
Swasta
biasanya
terukur
dengan
meteran listrik.
V. Metode Pemilihan Sampel
Survey
Captive
Power
tahun
2014
dilakukan secara cacah lengkap.
Metode Pengumpulan Data
Metode pencacahan survei ini adalah
pencacahan
langsung,
yaitu
dengan
mendatangi perusahaan terpilih dengan
membawa kuesioner untuk wawancara
3. PLN is Electricity State Enterprise that
is responsible to supply electricity in
Indonesia. PLN electricity distribute to
customer using installation where
KWh consumed recorded in electric
recorder tool.
4. Private Electricity is a Electricity
establishment owned by non state
electricity
company.
Non
estate
electricity distribute to customer using
installation where KWh consumed
recorded in electric recorder tool.
Location of customers usually is
around the establishment.
V.
Sampling Method
Captive Power Survey 2014 used complete
enumeration method.
Collecting Data Method
The collecting data method is direct
interview, that is by visiting the sampled
establishment to be interviewed directly.
ULASAN RINGKAS
REVIEW
Statistik Captive Power/Captive Power Statistics 9
ULASAN RINGKAS
1. Pengguna Captive Power
Pada umumnya usaha membangkitkan listrik
untuk memenuhi kebutuhan listrik sendiri
dilakukan perusahaan sebagai sumber listrik
cadangan bila listrik berlangganan (PLN dan
Perusahaan
Listrik
Swasta)
mengalami
pemadaman. Hal ini dilakukan untuk menjaga
keberlangsungan ketersediaan listrik untuk
operasional perusahaan.
Pada tahun 2013, sekitar 58,77 persen dari
seluruh
bandar
udara,
stasiun,
pelabuhan/dermaga, penerbangan komersial,
angkutan kereta, angkutan air dan bioskop di
Indonesia melakukan pembangkitan listrik
sendiri. Sektor dengan persentase pengguna
captive power terbesar adalah bandara, yaitu
sekitar 91,17 persen dari seluruh bandara yang
ada di Indonesia. Selanjutnya secara
berturut-turut persentase pengguna captive power dari
total masing-masing sektor adalah untuk
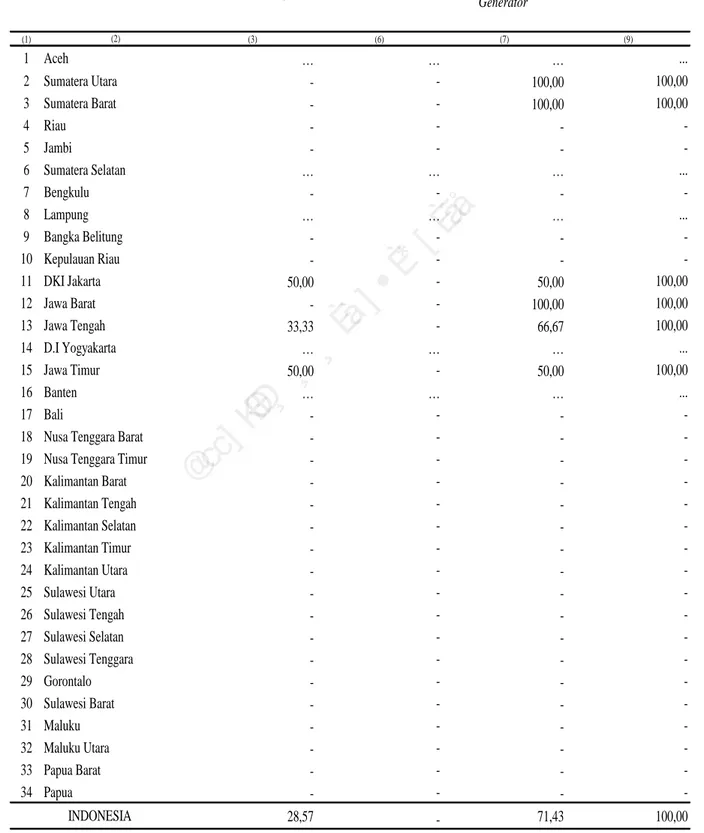
angkutan kereta sebesar 71,43 persen,
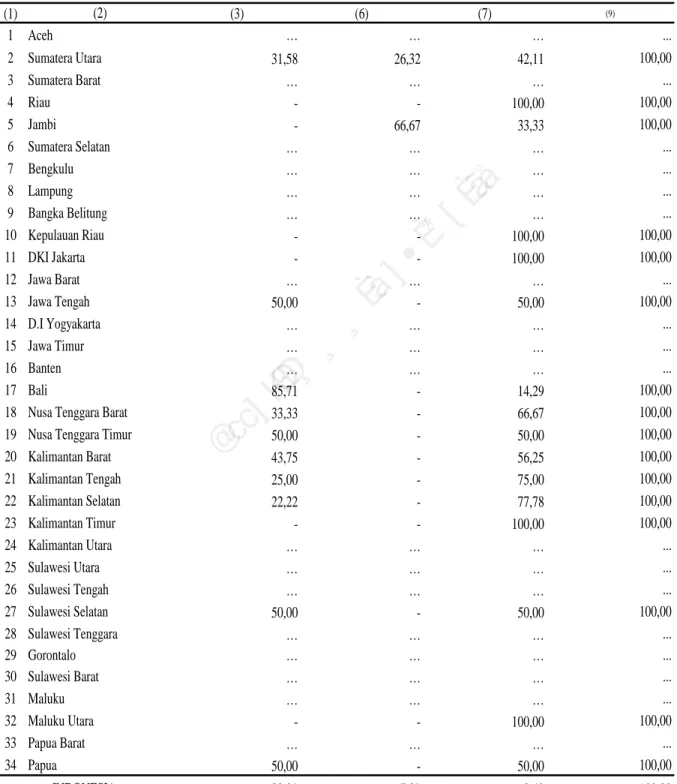
angkutan air sebesar 67,71 persen, bioskop
sebesar 65,93 persen, stasiun kereta sebesar
62,11 persen, pelabuhan sebesar 48,52 dan
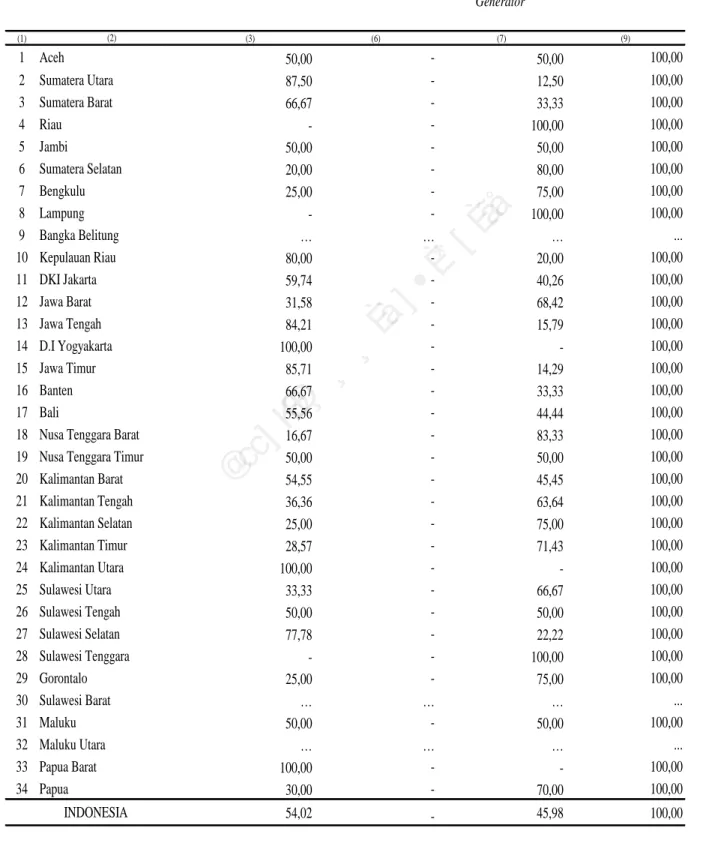
penerbangan komersial sebesar 45,98.
REVIEW
1. User Companies
Generally, the electricity of captive power
produced to fulfil their own needs, it was
done by electricity companies as reserve
electricity source when main electricity from
State Electricity and Non State Electricity
was not enough or power outage. That was
very important to keep sustainability of
electricity supply.
In 2013 about 58.77 percent of the following
establishments, they are airports, train
stations, harbours, passenger air transports,
railways transports, water transportations
and cinemas in Indonesia using captive
power. Airport was the largest sector that
used 91.17 percent of captive power of
airports in Indonesia. Then, railways
transports
was
71.43
percent,
water
transportations was 67.71 percent, cinemas
was 65.93 percent, train stations was 62.11
percent, harbours was 48.52 and also
passenger air transports was 45.98 percent.
10 Statistik Captive Power/Captive Power Statistics
2.
Kapasitas Pembangkit Listrik
Pembangkit listrik yang digunakan oleh
bandar udara, stasiun, pelabuhan/dermaga,
penerbangan komersial, angkutan kereta,
angkutan air dan bioskop sebagai sumber
listrik alternatif adalah pembangkit listrik
tenaga diesel. Kapasitas generator pembangkit
listrik yang terbanyak dipakai adalah kurang
dari 500 KW yaitu sekitar 87,77 persen dari
seluruh pengguna generator listrik. Jumlah
pemakai
generator
menurut
kapasitas
generator lainnya yang digunakan
berturut-turut adalah kapasitas antara 500-1000 KW
yaitu sekitar 5,28 persen, kapasitas antara
1000-1500 KW yaitu sekitar 1,93 persen dan
kapasitas lebih dari 1500 KW sekitar 5,02
persen.
2. Installed Capacity of Power Plants
The airports, train stations, ports/docks,
commercial flights, freight trains, water
transports and cinemas used diesel as a
generating
power.
The
largest
used
electricity was less than 500 KW, which is
about 87.77 percent from the total user.
Other generator capacity with number of
users was 500-1000 KW used about 5.28
percent, then 1000-1500 KW used about 1.93
percent and generator capacity was more
than 1500 KW used about 5.02 percent.
Statistik Captive Power/Captive Power Statistics 11
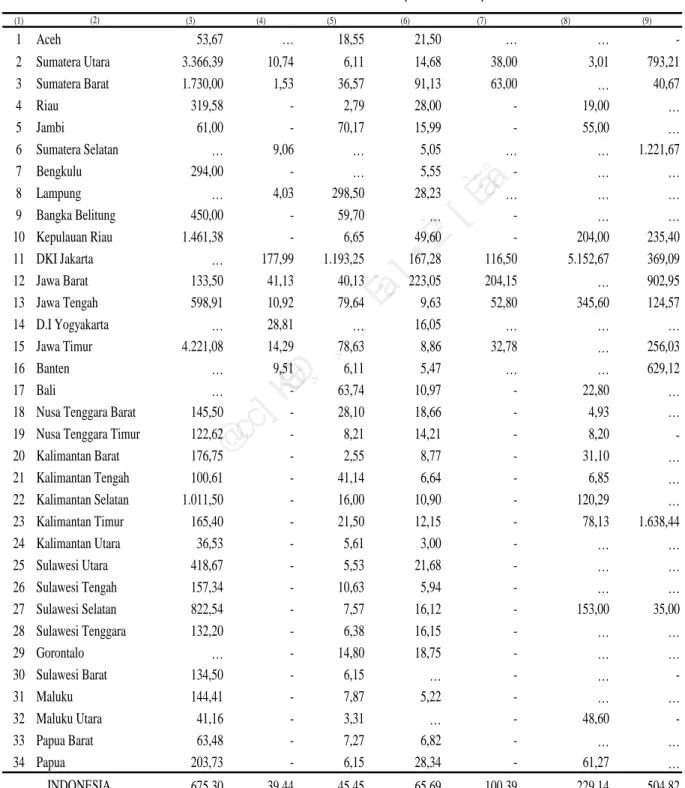
3. Produksi/Pembelian Listrik
Rata-rata tenaga listrik yang diproduksi pada
tahun 2013 oleh bandar udara adalah sebesar
15,20 MWh, stasiun sebesar 2,73 MWh,
pelabuhan/dermaga sebesar 17,21 MWh,
penerbangan komersil sebesar 3,59 MWh,
angkutan
kereta
sebesar
50,78
MWh,
angkutan air sebesar 5,33MWh dan bioskop
sebesar 17,07 MWh. Sedangkan rata-rata
konsumsi listrik berlangganan pada tahun
2013 jauh lebih besar dibandingkan dengan
rata-rata
produksinya.
Kelompok
usaha
dengan rata-rata konsumsi listrik terbesar
adalah bandar udara yaitu sebesar 675,29
MWh.
Kemudian
berturut-turut
adalah
bioskop sebesar 504,82 MWh, angkutan air
3. Producing / Purchasing Electricity
Electricity produced in the 2013 by the
airports was 15.20 MWh averagely, train
stations was 2.73 MWh, harbours was 17.21
MWh, passenger air transports was 3.59
MWh, railways transports was 50.78 MWh,
water transportations was 5.33 MWh and
also cinemas was 17.07 MWh.
While electricity consumed by all sectors in
2013 was greater than its production. Sector
with
the
highest
average
electricity
consumed was airports that consumed
675.29 MWh in a year. then cinemas 504.82
MWh, water transportations 229.14 MWh,
railways transports 100.39 MWh, passenger
12 Statistik Captive Power/Captive Power Statistics
sebesar 229,14 MWh, angkutan kereta sebesar
100,39 MWh, penerbangan komersil sebesar
65,69 MWh, pelabuhan/dermaga sebesar
45,45 MWh dan stasiun sebesar 39,44 MWh.
air transports 65.69 MWh, harbours 45.45
MWh and also stations 39.44MWh.
5. Pemakaian Bahan Bakar
Salah satu komponen pengeluaran operasional
yang cukup besar dalam pembangkitan listrik
adalah biaya bahan bakar. Hanya ada dua
jenis bahan bakar yang digunakan, yaitu
minyak solar dan bensin. Volume bahan bakar
terbanyak yang digunakan adalah minyak
solar. Rata-rata konsumsi minyak solar pada
tahun 2013 untuk bandar udara, stasiun,
pelabuhan/dermaga, penerbangan komersil,
angkutan kereta, angkutan air dan bioskop
adalah sebesar 4.112,41 liter. Sedangkan
5. Fuel Consumed
One of the component of operating cost
which was rather high in total operating cost
was fuel consumed. There were two types of
fuel consumed such as Automotive Diesel Oil
(HSD) and gasoline. The highest volume in
2013 was Automotive Diesel Oil (HSD).
Average electricity consumption in 2013 for
airports, train stations, harbours, passenger
air transports, railways transports, water
transportations and cinemas were 4,112.41
litres. Gasoline was usually used as
MWh
Statistik Captive Power/Captive Power Statistics 13
bahan bakar bensin secara umum hanya
merupakan bahan bakar pendukung dalam
proses
pembangkitan
listrik.
Rata-rata
konsumsi bahan bakar bensin untuk keenam
sektor tersebut pada tahun 2013 adalah
sebesar 420,81 liter.
complementer
fuel.
Consumption
for
gasoline in 2013 was 420.81 litre.
14 Statistik Captive Power/Captive Power Statistics
TABEL-TABEL
TABLES
Statistik Captive Power / Captive Power Statistics 17 Tabel Table No. PLN/ State Electricity Genset/ Generator PLN dan Genset/
State Electricity and Generator Total/ Total (1) (3) (6) (7) (9) 1 Aceh 11,11 - 88,89 100,00 2 Sumatera Utara 14,29 14,29 71,43 100,00 3 Sumatera Barat - - 100,00 100,00 4 Riau - - 100,00 100,00 5 Jambi - 33,33 66,67 100,00 6 Sumatera Selatan … … … … 7 Bengkulu - - 100,00 100,00 8 Lampung … … … … 9 Bangka Belitung - - 100,00 100,00 10 Kepulauan Riau - - 100,00 100,00 11 DKI Jakarta … … … … 12 Jawa Barat - - 100,00 100,00 13 Jawa Tengah - - 100,00 100,00 14 D.I Yogyakarta … … … … 15 Jawa Timur 25,00 - 75,00 100,00 16 Banten … … … … 17 Bali … … … …
18 Nusa Tenggara Barat - - 100,00 100,00
19 Nusa Tenggara Timur - - 100,00 100,00
20 Kalimantan Barat - - 100,00 100,00 21 Kalimantan Tengah - - 100,00 100,00 22 Kalimantan Selatan - - 100,00 100,00 23 Kalimantan Timur - 20,00 80,00 100,00 24 Kalimantan Utara - - 100,00 100,00 25 Sulawesi Utara - - 100,00 100,00 26 Sulawesi Tengah - - 100,00 100,00 27 Sulawesi Selatan - 14,29 85,71 100,00 28 Sulawesi Tenggara - 16,67 83,33 100,00 29 Gorontalo … … … … 30 Sulawesi Barat 50,00 - 50,00 100,00 31 Maluku 44,44 22,22 33,33 100,00 32 Maluku Utara 33,33 - 66,67 100,00 33 Papua Barat - - 100,00 100,00 34 Papua 12,50 - 87,50 100,00 8,82 5,15 86,03 100,00 Provinsi/ Province (2) INDONESIA
Persentase Jumlah Bandar Udara Menurut Provinsi dan Sumber Tenaga Listrik yang Digunakan
Percentage of Airports by Province and Source of Electricity Used
1.1
18 Statistik Captive Power/ Captive Power Statistics Tabel Table No. PLN/ State Electricity Genset/ Generator PLN dan Genset/
State Electricity and Generator Total/ Total (1) (3) (6) (7) (9) 1 Aceh … … … … 2 Sumatera Utara 19,05 - 80,95 100,00 3 Sumatera Barat 77,78 - 22,22 100,00 4 Riau - - - -5 Jambi - - - -6 Sumatera Selatan 28,57 - 71,43 100,00 7 Bengkulu - - - -8 Lampung 82,35 - 17,65 100,00 9 Bangka Belitung - - - -10 Kepulauan Riau - - - -11 DKI Jakarta 17,50 - 82,50 100,00 12 Jawa Barat 36,00 - 64,00 100,00 13 Jawa Tengah 37,35 - 62,65 100,00 14 D.I Yogyakarta 25,00 - 75,00 100,00 15 Jawa Timur 42,86 - 57,14 100,00 16 Banten 50,00 - 50,00 100,00 17 Bali - - -
-18 Nusa Tenggara Barat - - -
-19 Nusa Tenggara Timur - - -
-20 Kalimantan Barat - - - -21 Kalimantan Tengah - - - -22 Kalimantan Selatan - - - -23 Kalimantan Timur - - - -24 Kalimantan Utara - - - -25 Sulawesi Utara - - - -26 Sulawesi Tengah - - - -27 Sulawesi Selatan - - - -28 Sulawesi Tenggara - - - -29 Gorontalo - - - -30 Sulawesi Barat - - - -31 Maluku - - - -32 Maluku Utara - - - -33 Papua Barat - - - -34 Papua - - - -37,89 - 62,11 100,00 1.2 Provinsi/ Province (2) INDONESIA
Persentase Jumlah Stasiun Kereta Menurut Provinsi dan Sumber Tenaga Listrik yang Digunakan
Percentage of Train Stations by Province and Source of Electricity Used
Statistik Captive Power / Captive Power Statistics 19 Tabel Persentase Jumlah Pelabuhan/Dermaga Menurut Provinsi dan Sumber Tenaga Listrik yang Digunakan
Table No. PLN/ State Electricity Genset/ Generator PLN dan Genset/
State Electricity and Generator Total/ Total (1) (3) (6) (7) (9) 1 Aceh 54,55 - 45,45 100,00 2 Sumatera Utara 51,85 3,70 44,44 100,00 3 Sumatera Barat 57,14 - 42,86 100,00 4 Riau 66,67 8,33 25,00 100,00 5 Jambi 16,67 - 83,33 100,00 6 Sumatera Selatan … … … ... 7 Bengkulu … … … ... 8 Lampung 40,00 - 60,00 100,00 9 Bangka Belitung 54,55 - 45,45 100,00 10 Kepulauan Riau 82,61 - 17,39 100,00 11 DKI Jakarta 50,00 - 50,00 100,00 12 Jawa Barat 50,00 - 50,00 100,00 13 Jawa Tengah 50,00 - 50,00 100,00 14 D.I Yogyakarta … … … ... 15 Jawa Timur 25,00 - 75,00 100,00 16 Banten 42,86 - 57,14 100,00 17 Bali 66,67 - 33,33 100,00
18 Nusa Tenggara Barat 50,00 - 50,00 100,00
19 Nusa Tenggara Timur 66,67 11,11 22,22 100,00
20 Kalimantan Barat 75,00 - 25,00 100,00 21 Kalimantan Tengah 50,00 12,50 37,50 100,00 22 Kalimantan Selatan - 50,00 50,00 100,00 23 Kalimantan Timur 11,11 - 88,89 100,00 24 Kalimantan Utara 33,33 - 66,67 100,00 25 Sulawesi Utara 41,67 - 58,33 100,00 26 Sulawesi Tengah 55,56 - 44,44 100,00 27 Sulawesi Selatan 40,00 5,00 55,00 100,00 28 Sulawesi Tenggara 62,50 4,17 33,33 100,00 29 Gorontalo - 16,67 83,33 100,00 30 Sulawesi Barat 81,82 9,09 9,09 100,00 31 Maluku 46,67 13,33 40,00 100,00 32 Maluku Utara 61,90 - 38,10 100,00 33 Papua Barat 33,33 - 66,67 100,00 34 Papua 20,00 - 80,00 100,00 51,48 3,25 45,27 100,00 1.3 Provinsi/ Province (2) INDONESIA
Percentage of Harbours by Province and Source of Electricity Used
20 Statistik Captive Power/ Captive Power Statistics
Tabel Persentase Jumlah Perusahaan Penerbangan Komersil Menurut Provinsi dan Sumber Tenaga Listrik yang Digunakan
Table Percentage of Passenger Air Transport Establishments by Province and Source of Electricity Used
No. PLN/
State Electricity
Genset/
Generator
PLN dan Genset/
State Electricity and Generator Total/ Total (1) (3) (6) (7) (9) 1 Aceh 50,00 - 50,00 100,00 2 Sumatera Utara 87,50 - 12,50 100,00 3 Sumatera Barat 66,67 - 33,33 100,00 4 Riau - - 100,00 100,00 5 Jambi 50,00 - 50,00 100,00 6 Sumatera Selatan 20,00 - 80,00 100,00 7 Bengkulu 25,00 - 75,00 100,00 8 Lampung - - 100,00 100,00 9 Bangka Belitung … … … ... 10 Kepulauan Riau 80,00 - 20,00 100,00 11 DKI Jakarta 59,74 - 40,26 100,00 12 Jawa Barat 31,58 - 68,42 100,00 13 Jawa Tengah 84,21 - 15,79 100,00 14 D.I Yogyakarta 100,00 - - 100,00 15 Jawa Timur 85,71 - 14,29 100,00 16 Banten 66,67 - 33,33 100,00 17 Bali 55,56 - 44,44 100,00
18 Nusa Tenggara Barat 16,67 - 83,33 100,00
19 Nusa Tenggara Timur 50,00 - 50,00 100,00
20 Kalimantan Barat 54,55 - 45,45 100,00 21 Kalimantan Tengah 36,36 - 63,64 100,00 22 Kalimantan Selatan 25,00 - 75,00 100,00 23 Kalimantan Timur 28,57 - 71,43 100,00 24 Kalimantan Utara 100,00 - - 100,00 25 Sulawesi Utara 33,33 - 66,67 100,00 26 Sulawesi Tengah 50,00 - 50,00 100,00 27 Sulawesi Selatan 77,78 - 22,22 100,00 28 Sulawesi Tenggara - - 100,00 100,00 29 Gorontalo 25,00 - 75,00 100,00 30 Sulawesi Barat … … … ... 31 Maluku 50,00 - 50,00 100,00 32 Maluku Utara … … … ... 33 Papua Barat 100,00 - - 100,00 34 Papua 30,00 - 70,00 100,00 54,02 - 45,98 100,00 1.4 Provinsi/ Province (2) INDONESIA
http://www.bps.go.id
Statistik Captive Power / Captive Power Statistics 21
Tabel Persentase Jumlah Perusahaan Angkutan Kereta Menurut Provinsi dan Sumber Tenaga Listrik yang Digunakan
Table No. PLN/ State Electricity Genset/ Generator PLN dan Genset/
State Electricity and Generator Total/ Total (1) (3) (6) (7) (9) 1 Aceh … … … ... 2 Sumatera Utara - - 100,00 100,00 3 Sumatera Barat - - 100,00 100,00 4 Riau - - - -5 Jambi - - - -6 Sumatera Selatan … … … ... 7 Bengkulu - - - -8 Lampung … … … ... 9 Bangka Belitung - - - -10 Kepulauan Riau - - - -11 DKI Jakarta 50,00 - 50,00 100,00 12 Jawa Barat - - 100,00 100,00 13 Jawa Tengah 33,33 - 66,67 100,00 14 D.I Yogyakarta … … … ... 15 Jawa Timur 50,00 - 50,00 100,00 16 Banten … … … ... 17 Bali - - -
-18 Nusa Tenggara Barat - - -
-19 Nusa Tenggara Timur - - -
-20 Kalimantan Barat - - - -21 Kalimantan Tengah - - - -22 Kalimantan Selatan - - - -23 Kalimantan Timur - - - -24 Kalimantan Utara - - - -25 Sulawesi Utara - - - -26 Sulawesi Tengah - - - -27 Sulawesi Selatan - - - -28 Sulawesi Tenggara - - - -29 Gorontalo - - - -30 Sulawesi Barat - - - -31 Maluku - - - -32 Maluku Utara - - - -33 Papua Barat - - - -34 Papua - - - -28,57 - 71,43 100,00 INDONESIA 1.5
Percentage of Railways Transport Establishments by Province and Source of Electricity Used
Provinsi/
Province
(2)
22 Statistik Captive Power/ Captive Power Statistics
Tabel Persentase Jumlah Perusahaan Angkutan Air Menurut Provinsi dan Sumber Tenaga Listrik yang Digunakan
Table No. PLN/ State Electricity Genset/ Generator PLN dan Genset/
State Electricity and Generator Total/ Total (1) (3) (6) (7) (9) 1 Aceh … … … ... 2 Sumatera Utara 31,58 26,32 42,11 100,00 3 Sumatera Barat … … … ... 4 Riau - - 100,00 100,00 5 Jambi - 66,67 33,33 100,00 6 Sumatera Selatan … … … ... 7 Bengkulu … … … ... 8 Lampung … … … ... 9 Bangka Belitung … … … ... 10 Kepulauan Riau - - 100,00 100,00 11 DKI Jakarta - - 100,00 100,00 12 Jawa Barat … … … ... 13 Jawa Tengah 50,00 - 50,00 100,00 14 D.I Yogyakarta … … … ... 15 Jawa Timur … … … ... 16 Banten … … … ... 17 Bali 85,71 - 14,29 100,00
18 Nusa Tenggara Barat 33,33 - 66,67 100,00
19 Nusa Tenggara Timur 50,00 - 50,00 100,00
20 Kalimantan Barat 43,75 - 56,25 100,00 21 Kalimantan Tengah 25,00 - 75,00 100,00 22 Kalimantan Selatan 22,22 - 77,78 100,00 23 Kalimantan Timur - - 100,00 100,00 24 Kalimantan Utara … … … ... 25 Sulawesi Utara … … … ... 26 Sulawesi Tengah … … … ... 27 Sulawesi Selatan 50,00 - 50,00 100,00 28 Sulawesi Tenggara … … … ... 29 Gorontalo … … … ... 30 Sulawesi Barat … … … ... 31 Maluku … … … ... 32 Maluku Utara - - 100,00 100,00 33 Papua Barat … … … ... 34 Papua 50,00 - 50,00 100,00 32,29 7,29 60,42 100,00 INDONESIA 1.6
Percentage of Water Transportation Establishments by Province and Source of Electricity Used
Provinsi/
Province
(2)
Statistik Captive Power / Captive Power Statistics 23 Tabel Table No. PLN/ State Electricity Genset/ Generator PLN dan Genset/
State Electricity and Generator Total/ Total (1) (3) (6) (7) (9) 1 Aceh - - - -2 Sumatera Utara 50,00 - 50,00 100,00 3 Sumatera Barat 33,33 - 66,67 100,00 4 Riau … … … ... 5 Jambi … … … ... 6 Sumatera Selatan - - 100,00 100,00 7 Bengkulu … … … ... 8 Lampung … … … ... 9 Bangka Belitung … … … ... 10 Kepulauan Riau 100,00 - - 100,00 11 DKI Jakarta 47,37 - 52,63 100,00 12 Jawa Barat 21,43 - 78,57 100,00 13 Jawa Tengah 20,00 - 80,00 100,00 14 D.I Yogyakarta … … … ... 15 Jawa Timur 17,65 - 82,35 100,00 16 Banten 27,27 - 72,73 100,00 17 Bali … … … ...
18 Nusa Tenggara Barat … … … ...
19 Nusa Tenggara Timur - - -
-20 Kalimantan Barat … … … ... 21 Kalimantan Tengah … … … ... 22 Kalimantan Selatan … … … ... 23 Kalimantan Timur 75,00 - 25,00 100,00 24 Kalimantan Utara … … … ... 25 Sulawesi Utara … … … ... 26 Sulawesi Tengah … … … ... 27 Sulawesi Selatan 66,67 - 33,33 100,00 28 Sulawesi Tenggara … … … ... 29 Gorontalo … … … ... 30 Sulawesi Barat - - - -31 Maluku … … … ... 32 Maluku Utara - - - -33 Papua Barat … … … ... 34 Papua … … … ... 34,07 - 65,93 100,00 INDONESIA
1.7Persentase Jumlah Bioskop Menurut Provinsi dan Sumber Tenaga Listrik yang Digunakan
Percentage of Cinemas by Province and Source of Electricity Used
Provinsi/
Province
(2)
24 Statistik Captive Power/ Captive Power Statistics
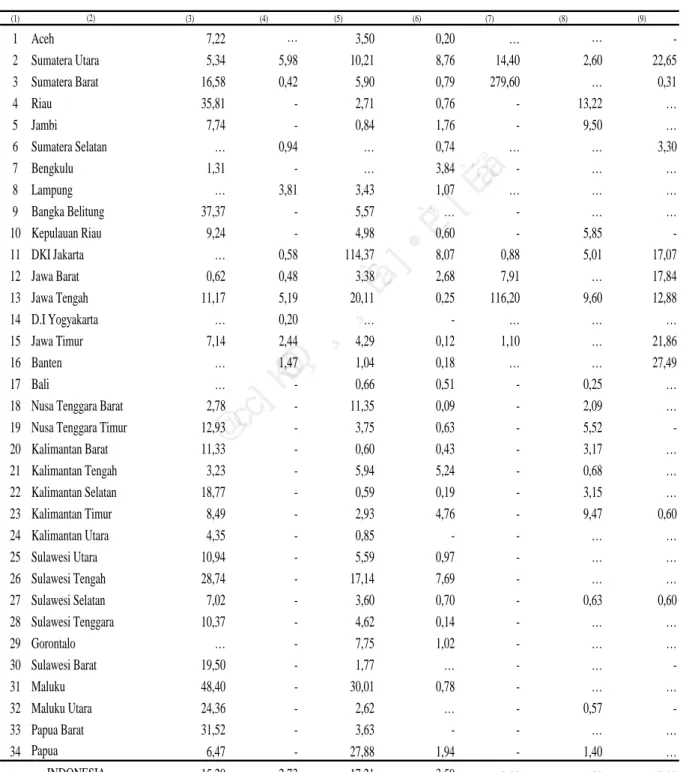
Tabel Rata-Rata Daya Terpasang Listrik Berlangganan Menurut Provinsi dan Jenis Kegiatan Usaha
Table Average Electricity Installed Capacities by Province and Kind of Activity
No. Bandar Udara
Airports Stasiun Train Stations Pelabuhan/ Dermaga Harbours Penerbangan Komersil Passenger Air Transports Angkutan Kereta Railways Transports Angkutan Air Water Transportations Bioskop Cinemas (1) (3) (4) (5) (6) (7) (8) (9) 1 Aceh 53,67 … 18,55 21,50 … … -2 Sumatera Utara 3.366,39 10,74 6,11 14,68 38,00 3,01 793,21 3 Sumatera Barat 1.730,00 1,53 36,57 91,13 63,00 … 40,67 4 Riau 319,58 - 2,79 28,00 - 19,00 … 5 Jambi 61,00 - 70,17 15,99 - 55,00 … 6 Sumatera Selatan … 9,06 … 5,05 … … 1.221,67 7 Bengkulu 294,00 - … 5,55 - … … 8 Lampung … 4,03 298,50 28,23 … … … 9 Bangka Belitung 450,00 - 59,70 … - … … 10 Kepulauan Riau 1.461,38 - 6,65 49,60 - 204,00 235,40 11 DKI Jakarta … 177,99 1.193,25 167,28 116,50 5.152,67 369,09 12 Jawa Barat 133,50 41,13 40,13 223,05 204,15 … 902,95 13 Jawa Tengah 598,91 10,92 79,64 9,63 52,80 345,60 124,57 14 D.I Yogyakarta … 28,81 … 16,05 … … … 15 Jawa Timur 4.221,08 14,29 78,63 8,86 32,78 … 256,03 16 Banten … 9,51 6,11 5,47 … … 629,12 17 Bali … - 63,74 10,97 - 22,80 …
18 Nusa Tenggara Barat 145,50 - 28,10 18,66 - 4,93 …
19 Nusa Tenggara Timur 122,62 - 8,21 14,21 - 8,20
-20 Kalimantan Barat 176,75 - 2,55 8,77 - 31,10 … 21 Kalimantan Tengah 100,61 - 41,14 6,64 - 6,85 … 22 Kalimantan Selatan 1.011,50 - 16,00 10,90 - 120,29 … 23 Kalimantan Timur 165,40 - 21,50 12,15 - 78,13 1.638,44 24 Kalimantan Utara 36,53 - 5,61 3,00 - … … 25 Sulawesi Utara 418,67 - 5,53 21,68 - … … 26 Sulawesi Tengah 157,34 - 10,63 5,94 - … … 27 Sulawesi Selatan 822,54 - 7,57 16,12 - 153,00 35,00 28 Sulawesi Tenggara 132,20 - 6,38 16,15 - … … 29 Gorontalo … - 14,80 18,75 - … … 30 Sulawesi Barat 134,50 - 6,15 … - … -31 Maluku 144,41 - 7,87 5,22 - … … 32 Maluku Utara 41,16 - 3,31 … - 48,60 -33 Papua Barat 63,48 - 7,27 6,82 - … … 34 Papua 203,73 - 6,15 28,34 - 61,27 … 675,30 39,44 45,45 65,69 100,39 229,14 504,82 2 Provinsi/ Province (2) INDONESIA (Kilo Watt)
http://www.bps.go.id
Statistik Captive Power / Captive Power Statistics 25
Tabel Rata-Rata Pemakaian Listrik Berlangganan per Perusahaan Menurut Provinsi dan Jenis Kegiatan Usaha Selama Setahun
Table Average Electricity Consumpt by a Company by Province and Kind of Activity for a Year
No. Bandar Udara
Airports Stasiun Train Stations Pelabuhan/ Dermaga Harbours Penerbangan Komersil Passenger Air Transports Angkutan Kereta Railways Transports Angkutan Air Water Transportations Bioskop Cinemas (1) (3) (4) (5) (6) (7) (8) (9) 1 Aceh 7,38 … 2,57 4,05 … … -2 Sumatera Utara 491,85 2,68 0,64 0,89 1,71 0,77 142,05 3 Sumatera Barat 227,87 0,60 5,60 6,79 15,25 … 6,20 4 Riau 39,82 - 1,79 5,76 - 16,08 … 5 Jambi 9,40 - 0,74 1,49 - 9,33 … 6 Sumatera Selatan … 5,71 … 2,58 … … 145,67 7 Bengkulu 20,25 - … 0,89 - … … 8 Lampung … 0,75 8,25 4,44 … … … 9 Bangka Belitung 52,87 - 6,43 … - … … 10 Kepulauan Riau 54,71 - 0,85 1,47 - 9,33 55,16 11 DKI Jakarta … 21,31 91,72 18,00 26,09 1.647,55 46,03 12 Jawa Barat 10,00 8,44 5,23 7,12 36,62 … 85,82 13 Jawa Tengah 208,41 5,82 11,62 2,12 107,07 45,72 34,57 14 D.I Yogyakarta … 10,95 … 3,32 … … … 15 Jawa Timur 590,92 34,24 13,59 2,90 18,44 … 56,43 16 Banten … 1,62 4,09 1,67 … … 89,64 17 Bali … - 14,01 1,73 - 3,61 …
18 Nusa Tenggara Barat 32,69 - 6,27 1,62 - 0,95 …
19 Nusa Tenggara Timur 17,72 - 1,92 3,21 - 3,25
-20 Kalimantan Barat 62,86 - 0,25 2,06 - 8,19 … 21 Kalimantan Tengah 24,63 - 2,69 3,10 - 1,34 … 22 Kalimantan Selatan 121,53 - 3,80 2,77 - 45,54 … 23 Kalimantan Timur 28,16 - 5,87 2,46 - 26,72 121,83 24 Kalimantan Utara 9,24 - 1,43 0,83 - … … 25 Sulawesi Utara 211,38 - 1,07 4,88 - … … 26 Sulawesi Tengah 33,67 - 11,59 9,59 - … … 27 Sulawesi Selatan 181,73 - 1,56 1,72 - 19,53 13,87 28 Sulawesi Tenggara 24,35 - 2,50 3,30 - … … 29 Gorontalo … - 2,10 3,55 - … … 30 Sulawesi Barat 10,39 - 0,63 … - … -31 Maluku 13,30 - 1,43 0,67 - … … 32 Maluku Utara 2,91 - 0,56 … - 9,24 -33 Papua Barat 22,46 - 0,85 1,60 - … … 34 Papua 90,14 - 1,65 5,48 - 12,00 … 133,51 11,03 5,66 6,84 32,14 65,07 63,33 Provinsi/ Province (2) INDONESIA (MWh) 3
http://www.bps.go.id
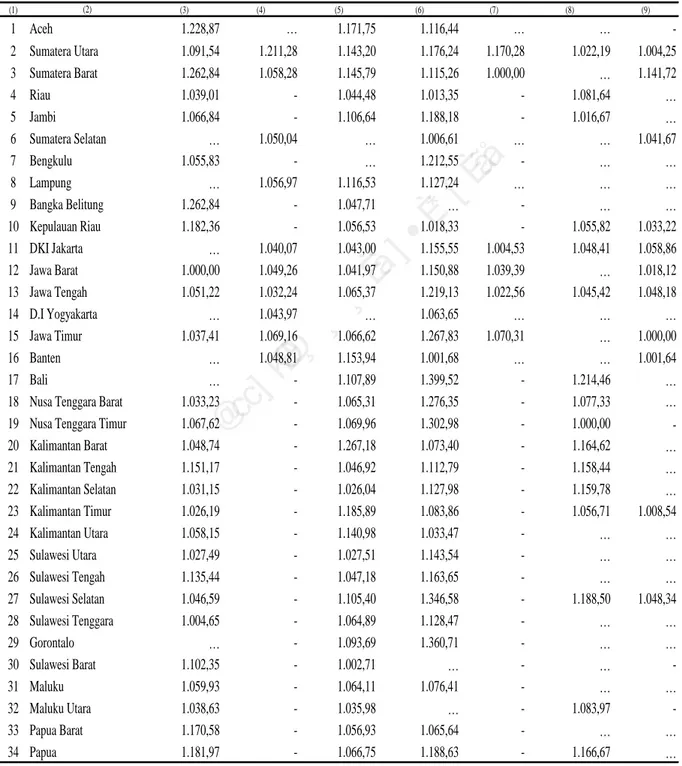
26 Statistik Captive Power/ Captive Power Statistics
Tabel Rata-rata Harga Listrik Berlangganan per Kwh Menurut Provinsi dan Jenis Kegiatan Usaha
Table Average Value of Electricity Consumed in a Month by Province and Kind of Activity
No. Bandar Udara
Airports Stasiun Train Stations Pelabuhan/ Dermaga Harbours Penerbangan Komersil Passenger Air Transports Angkutan Kereta Railways Transports Angkutan Air Water Transportations Bioskop Cinemas (1) (3) (4) (5) (6) (7) (8) (9) 1 Aceh 1.228,87 … 1.171,75 1.116,44 … … -2 Sumatera Utara 1.091,54 1.211,28 1.143,20 1.176,24 1.170,28 1.022,19 1.004,25 3 Sumatera Barat 1.262,84 1.058,28 1.145,79 1.115,26 1.000,00 … 1.141,72 4 Riau 1.039,01 - 1.044,48 1.013,35 - 1.081,64 … 5 Jambi 1.066,84 - 1.106,64 1.188,18 - 1.016,67 … 6 Sumatera Selatan … 1.050,04 … 1.006,61 … … 1.041,67 7 Bengkulu 1.055,83 - … 1.212,55 - … … 8 Lampung … 1.056,97 1.116,53 1.127,24 … … … 9 Bangka Belitung 1.262,84 - 1.047,71 … - … … 10 Kepulauan Riau 1.182,36 - 1.056,53 1.018,33 - 1.055,82 1.033,22 11 DKI Jakarta … 1.040,07 1.043,00 1.155,55 1.004,53 1.048,41 1.058,86 12 Jawa Barat 1.000,00 1.049,26 1.041,97 1.150,88 1.039,39 … 1.018,12 13 Jawa Tengah 1.051,22 1.032,24 1.065,37 1.219,13 1.022,56 1.045,42 1.048,18 14 D.I Yogyakarta … 1.043,97 … 1.063,65 … … … 15 Jawa Timur 1.037,41 1.069,16 1.066,62 1.267,83 1.070,31 … 1.000,00 16 Banten … 1.048,81 1.153,94 1.001,68 … … 1.001,64 17 Bali … - 1.107,89 1.399,52 - 1.214,46 …
18 Nusa Tenggara Barat 1.033,23 - 1.065,31 1.276,35 - 1.077,33 … 19 Nusa Tenggara Timur 1.067,62 - 1.069,96 1.302,98 - 1.000,00 -20 Kalimantan Barat 1.048,74 - 1.267,18 1.073,40 - 1.164,62 … 21 Kalimantan Tengah 1.151,17 - 1.046,92 1.112,79 - 1.158,44 … 22 Kalimantan Selatan 1.031,15 - 1.026,04 1.127,98 - 1.159,78 … 23 Kalimantan Timur 1.026,19 - 1.185,89 1.083,86 - 1.056,71 1.008,54 24 Kalimantan Utara 1.058,15 - 1.140,98 1.033,47 - … … 25 Sulawesi Utara 1.027,49 - 1.027,51 1.143,54 - … … 26 Sulawesi Tengah 1.135,44 - 1.047,18 1.163,65 - … … 27 Sulawesi Selatan 1.046,59 - 1.105,40 1.346,58 - 1.188,50 1.048,34 28 Sulawesi Tenggara 1.004,65 - 1.064,89 1.128,47 - … … 29 Gorontalo … - 1.093,69 1.360,71 - … … 30 Sulawesi Barat 1.102,35 - 1.002,71 … - … -31 Maluku 1.059,93 - 1.064,11 1.076,41 - … … 32 Maluku Utara 1.038,63 - 1.035,98 … - 1.083,97 -33 Papua Barat 1.170,58 - 1.056,93 1.065,64 - … … 34 Papua 1.181,97 - 1.066,75 1.188,63 - 1.166,67 … 1.068,83 1.058,02 1.069,33 1.159,34 1.066,54 1.061,88 1.033,78 4 Provinsi/ Province (2) INDONESIA (Rupiah/Kwh / Rupiah/Kwh )
http://www.bps.go.id
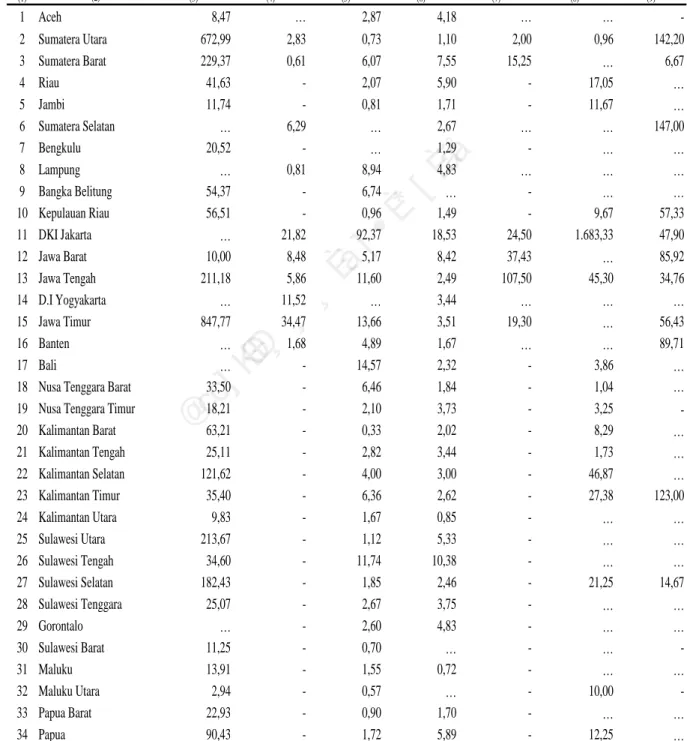
Statistik Captive Power / Captive Power Statistics 27
Tabel Rata-Rata Nilai Pemakaian Listrik Berlangganan per Perusahaan per Bulan Menurut Provinsi dan Jenis Kegiatan Usaha
Table Average Value of Electricity Consumpt by an Establishment for a Month by Province and Kind of Activity
No. Bandar Udara
Airports Stasiun Train Stations Pelabuhan/ Dermaga Harbours Penerbangan Komersil Passenger Air Transports Angkutan Kereta Railways Transports Angkutan Air Water Transportations Bioskop Cinemas (1) (3) (4) (5) (6) (7) (8) (9) 1 Aceh 8,47 … 2,87 4,18 … … -2 Sumatera Utara 672,99 2,83 0,73 1,10 2,00 0,96 142,20 3 Sumatera Barat 229,37 0,61 6,07 7,55 15,25 … 6,67 4 Riau 41,63 - 2,07 5,90 - 17,05 … 5 Jambi 11,74 - 0,81 1,71 - 11,67 … 6 Sumatera Selatan … 6,29 … 2,67 … … 147,00 7 Bengkulu 20,52 - … 1,29 - … … 8 Lampung … 0,81 8,94 4,83 … … … 9 Bangka Belitung 54,37 - 6,74 … - … … 10 Kepulauan Riau 56,51 - 0,96 1,49 - 9,67 57,33 11 DKI Jakarta … 21,82 92,37 18,53 24,50 1.683,33 47,90 12 Jawa Barat 10,00 8,48 5,17 8,42 37,43 … 85,92 13 Jawa Tengah 211,18 5,86 11,60 2,49 107,50 45,30 34,76 14 D.I Yogyakarta … 11,52 … 3,44 … … … 15 Jawa Timur 847,77 34,47 13,66 3,51 19,30 … 56,43 16 Banten … 1,68 4,89 1,67 … … 89,71 17 Bali … - 14,57 2,32 - 3,86 …
18 Nusa Tenggara Barat 33,50 - 6,46 1,84 - 1,04 …
19 Nusa Tenggara Timur 18,21 - 2,10 3,73 - 3,25
-20 Kalimantan Barat 63,21 - 0,33 2,02 - 8,29 … 21 Kalimantan Tengah 25,11 - 2,82 3,44 - 1,73 … 22 Kalimantan Selatan 121,62 - 4,00 3,00 - 46,87 … 23 Kalimantan Timur 35,40 - 6,36 2,62 - 27,38 123,00 24 Kalimantan Utara 9,83 - 1,67 0,85 - … … 25 Sulawesi Utara 213,67 - 1,12 5,33 - … … 26 Sulawesi Tengah 34,60 - 11,74 10,38 - … … 27 Sulawesi Selatan 182,43 - 1,85 2,46 - 21,25 14,67 28 Sulawesi Tenggara 25,07 - 2,67 3,75 - … … 29 Gorontalo … - 2,60 4,83 - … … 30 Sulawesi Barat 11,25 - 0,70 … - … -31 Maluku 13,91 - 1,55 0,72 - … … 32 Maluku Utara 2,94 - 0,57 … - 10,00 -33 Papua Barat 22,93 - 0,90 1,70 - … … 34 Papua 90,43 - 1,72 5,89 - 12,25 … 156,14 11,19 5,87 7,28 32,57 66,69 64,10 Provinsi/ Province (2) INDONESIA
(Juta Rupiah/Million Rupiahs ) 5
28 Statistik Captive Power/ Captive Power Statistics
Tabel
Table
No. Kurang dari 5%
Less than 5% 5% – <10% 10% – <15% 15% – <20% 20% atau lebih 20% or more Total/ Total (1) (3) (4) (5) (6) (7) (8) 1 Aceh 44,44 33,33 - - 22,22 100,00 2 Sumatera Utara 28,57 14,29 28,57 28,57 - 100,00 3 Sumatera Barat - - 50,00 50,00 - 100,00 4 Riau - 33,33 33,33 33,33 - 100,00 5 Jambi 33,33 33,33 33,33 - - 100,00 6 Sumatera Selatan … … … ... 7 Bengkulu - 50,00 50,00 - - 100,00 8 Lampung … … … ... 9 Bangka Belitung - 50,00 50,00 - - 100,00 10 Kepulauan Riau 50,00 25,00 25,00 - - 100,00 11 DKI Jakarta … … … ... 12 Jawa Barat - 50,00 - - 50,00 100,00 13 Jawa Tengah 60,00 20,00 - - 20,00 100,00 14 D.I Yogyakarta … … … ... 15 Jawa Timur - 75,00 - - 25,00 100,00 16 Banten … … … ... 17 Bali … … … ...
18 Nusa Tenggara Barat - 100,00 - - - 100,00
19 Nusa Tenggara Timur 41,67 33,33 - 8,33 16,67 100,00
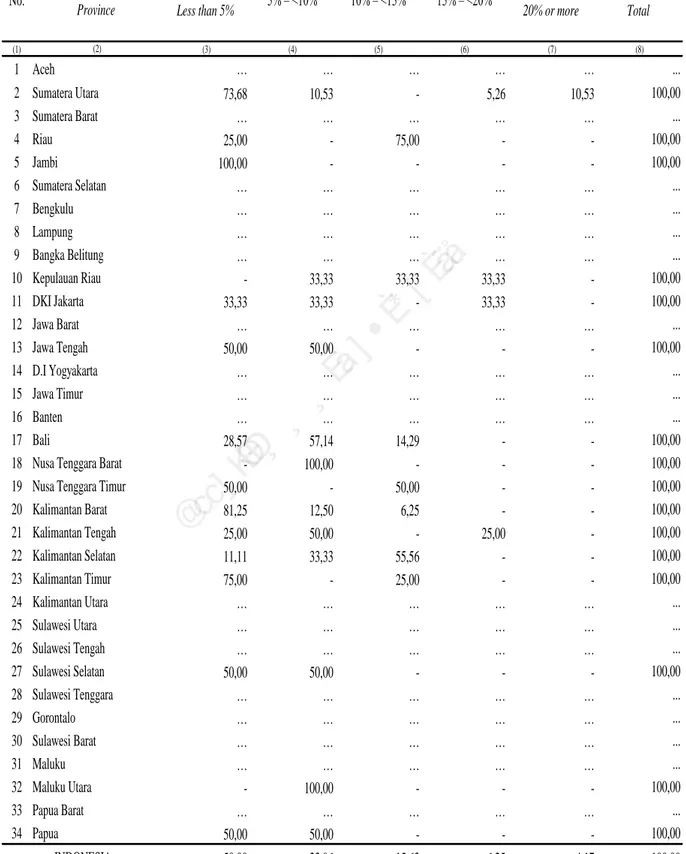
20 Kalimantan Barat 50,00 25,00 25,00 - - 100,00 21 Kalimantan Tengah 62,50 37,50 - - - 100,00 22 Kalimantan Selatan 50,00 - - - 50,00 100,00 23 Kalimantan Timur 80,00 20,00 - - - 100,00 24 Kalimantan Utara - 66,67 - - 33,33 100,00 25 Sulawesi Utara 33,33 33,33 33,33 - - 100,00 26 Sulawesi Tengah 20,00 80,00 - - - 100,00 27 Sulawesi Selatan 28,57 28,57 14,29 - 28,57 100,00 28 Sulawesi Tenggara 66,67 - 16,67 16,67 - 100,00 29 Gorontalo … … … ... 30 Sulawesi Barat - 50,00 - 50,00 - 100,00 31 Maluku 44,44 44,44 - - 11,11 100,00 32 Maluku Utara 16,67 33,33 16,67 16,67 16,67 100,00 33 Papua Barat 60,00 - 40,00 - - 100,00 34 Papua 12,50 50,00 25,00 12,50 - 100,00 33,82 36,03 13,24 7,35 9,56 100,00 Provinsi/ Province (2) INDONESIA
Persentase Jumlah Bandar Udara Menurut Provinsi dan Persentase Biaya Listrik Terhadap Biaya Operasional
Percentage of Airports by Province and Percentage of Electricity Cost to Total Operating Cost
6.1
Statistik Captive Power / Captive Power Statistics 29
Tabel
Table
No. Kurang dari 5%
Less than 5% 5% – <10% 10% – <15% 15% – <20% 20% atau lebih 20% or more Total/ Total (1) (3) (4) (5) (6) (7) (8) 1 Aceh … … … ... 2 Sumatera Utara 33,33 47,62 9,52 - 9,52 100,00 3 Sumatera Barat 44,44 11,11 22,22 22,22 - 100,00 4 Riau - - - -5 Jambi - - - -6 Sumatera Selatan 42,86 14,29 28,57 - 14,29 100,00 7 Bengkulu - - - -8 Lampung 41,18 11,76 29,41 17,65 - 100,00 9 Bangka Belitung - - - -10 Kepulauan Riau - - - -11 DKI Jakarta 52,50 25,00 10,00 7,50 5,00 100,00 12 Jawa Barat 46,00 26,00 16,00 4,00 8,00 100,00 13 Jawa Tengah 50,60 30,12 12,05 3,61 3,61 100,00 14 D.I Yogyakarta 25,00 75,00 - - - 100,00 15 Jawa Timur 57,14 20,00 14,29 2,86 5,71 100,00 16 Banten 61,11 16,67 22,22 - - 100,00 17 Bali - - -
-18 Nusa Tenggara Barat - - -
-19 Nusa Tenggara Timur - - -
-20 Kalimantan Barat - - - -21 Kalimantan Tengah - - - -22 Kalimantan Selatan - - - -23 Kalimantan Timur - - - -24 Kalimantan Utara - - - -25 Sulawesi Utara - - - -26 Sulawesi Tengah - - - -27 Sulawesi Selatan - - - -28 Sulawesi Tenggara - - - -29 Gorontalo - - - -30 Sulawesi Barat - - - -31 Maluku - - - -32 Maluku Utara - - - -33 Papua Barat - - - -34 Papua - - - -49,12 26,32 14,74 4,91 4,91 100,00 Provinsi/ Province (2) INDONESIA
6.2 Persentase Jumlah Stasiun Kereta Menurut Provinsi dan Persentase Biaya Listrik Terhadap Biaya Operasional
Percentage of Train Stations by Province and Percentage of Electricity Cost to Total Operating Cost
30 Statistik Captive Power/ Captive Power Statistics
Tabel
Table
No. Kurang dari 5%
Less than 5% 5% – <10% 10% – <15% 15% – <20% 20% atau lebih 20% or more Total/ Total (1) (3) (4) (5) (6) (7) (8) 1 Aceh 9,09 36,36 18,18 9,09 27,27 100,00 2 Sumatera Utara 62,96 11,11 3,70 - 22,22 100,00 3 Sumatera Barat 14,29 42,86 28,57 - 14,29 100,00 4 Riau 66,67 16,67 - - 16,67 100,00 5 Jambi 50,00 16,67 16,67 - 16,67 100,00 6 Sumatera Selatan … … … ... 7 Bengkulu … … … ... 8 Lampung 60,00 40,00 - - - 100,00 9 Bangka Belitung 45,45 36,36 - 9,09 9,09 100,00 10 Kepulauan Riau 52,17 26,09 4,35 4,35 13,04 100,00 11 DKI Jakarta 33,33 66,67 - - - 100,00 12 Jawa Barat 33,33 33,33 - 16,67 16,67 100,00 13 Jawa Tengah 60,00 30,00 10,00 - - 100,00 14 D.I Yogyakarta … … … ... 15 Jawa Timur 37,50 31,25 6,25 12,50 12,50 100,00 16 Banten 28,57 28,57 14,29 14,29 14,29 100,00 17 Bali - 44,44 22,22 - 33,33 100,00
18 Nusa Tenggara Barat 60,00 10,00 20,00 10,00 - 100,00
19 Nusa Tenggara Timur 44,44 44,44 - - 11,11 100,00
20 Kalimantan Barat 25,00 50,00 - - 25,00 100,00 21 Kalimantan Tengah 50,00 12,50 12,50 12,50 12,50 100,00 22 Kalimantan Selatan - - 100,00 - - 100,00 23 Kalimantan Timur 55,56 22,22 - - 22,22 100,00 24 Kalimantan Utara 33,33 - 33,33 - 33,33 100,00 25 Sulawesi Utara 50,00 41,67 8,33 - - 100,00 26 Sulawesi Tengah 33,33 22,22 22,22 11,11 11,11 100,00 27 Sulawesi Selatan 55,00 25,00 5,00 5,00 10,00 100,00 28 Sulawesi Tenggara 79,17 12,50 8,33 - - 100,00 29 Gorontalo 83,33 16,67 - - - 100,00 30 Sulawesi Barat 63,64 27,27 9,09 - - 100,00 31 Maluku 33,33 33,33 6,67 6,67 20,00 100,00 32 Maluku Utara 42,86 33,33 14,29 4,76 4,76 100,00 33 Papua Barat 100,00 - - - - 100,00 34 Papua 20,00 20,00 40,00 20,00 - 100,00 48,22 26,33 9,76 4,44 11,24 100,00 6.3 Provinsi/ Province (2) INDONESIA
Persentase Jumlah Pelabuhan/Dermaga Menurut Provinsi dan Persentase Biaya Listrik Terhadap Biaya Operasional
Percentage of Harbours by Province and Percentage of Electricity Cost to Total Operating Cost
Statistik Captive Power / Captive Power Statistics 31
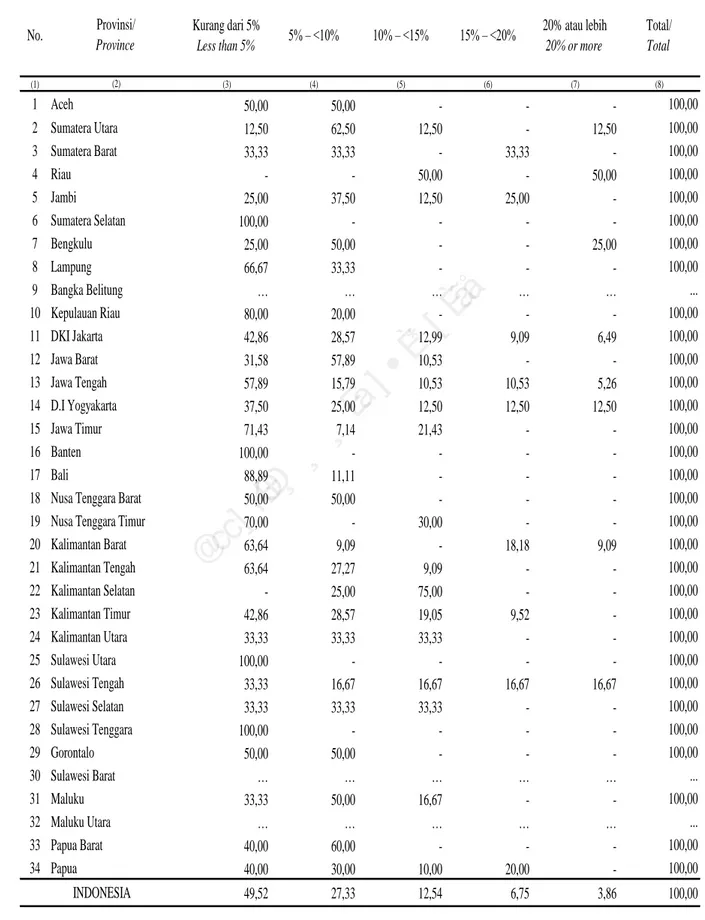
Tabel Persentase Jumlah Perusahaan Penerbangan Komersial Menurut Provinsi dan Persentase Biaya Listrik Terhadap Biaya Operasional
Table Percentage of Passenger Air Transport Establishments by Province and Percentage of Electricity Cost to Total Operating Cost
No. Kurang dari 5%
Less than 5% 5% – <10% 10% – <15% 15% – <20% 20% atau lebih 20% or more Total/ Total (1) (3) (4) (5) (6) (7) (8) 1 Aceh 50,00 50,00 - - - 100,00 2 Sumatera Utara 12,50 62,50 12,50 - 12,50 100,00 3 Sumatera Barat 33,33 33,33 - 33,33 - 100,00 4 Riau - - 50,00 - 50,00 100,00 5 Jambi 25,00 37,50 12,50 25,00 - 100,00 6 Sumatera Selatan 100,00 - - - - 100,00 7 Bengkulu 25,00 50,00 - - 25,00 100,00 8 Lampung 66,67 33,33 - - - 100,00 9 Bangka Belitung … … … ... 10 Kepulauan Riau 80,00 20,00 - - - 100,00 11 DKI Jakarta 42,86 28,57 12,99 9,09 6,49 100,00 12 Jawa Barat 31,58 57,89 10,53 - - 100,00 13 Jawa Tengah 57,89 15,79 10,53 10,53 5,26 100,00 14 D.I Yogyakarta 37,50 25,00 12,50 12,50 12,50 100,00 15 Jawa Timur 71,43 7,14 21,43 - - 100,00 16 Banten 100,00 - - - - 100,00 17 Bali 88,89 11,11 - - - 100,00
18 Nusa Tenggara Barat 50,00 50,00 - - - 100,00
19 Nusa Tenggara Timur 70,00 - 30,00 - - 100,00
20 Kalimantan Barat 63,64 9,09 - 18,18 9,09 100,00 21 Kalimantan Tengah 63,64 27,27 9,09 - - 100,00 22 Kalimantan Selatan - 25,00 75,00 - - 100,00 23 Kalimantan Timur 42,86 28,57 19,05 9,52 - 100,00 24 Kalimantan Utara 33,33 33,33 33,33 - - 100,00 25 Sulawesi Utara 100,00 - - - - 100,00 26 Sulawesi Tengah 33,33 16,67 16,67 16,67 16,67 100,00 27 Sulawesi Selatan 33,33 33,33 33,33 - - 100,00 28 Sulawesi Tenggara 100,00 - - - - 100,00 29 Gorontalo 50,00 50,00 - - - 100,00 30 Sulawesi Barat … … … ... 31 Maluku 33,33 50,00 16,67 - - 100,00 32 Maluku Utara … … … ... 33 Papua Barat 40,00 60,00 - - - 100,00 34 Papua 40,00 30,00 10,00 20,00 - 100,00 49,52 27,33 12,54 6,75 3,86 100,00 Provinsi/ Province (2) INDONESIA 6.4
http://www.bps.go.id
32 Statistik Captive Power/ Captive Power Statistics
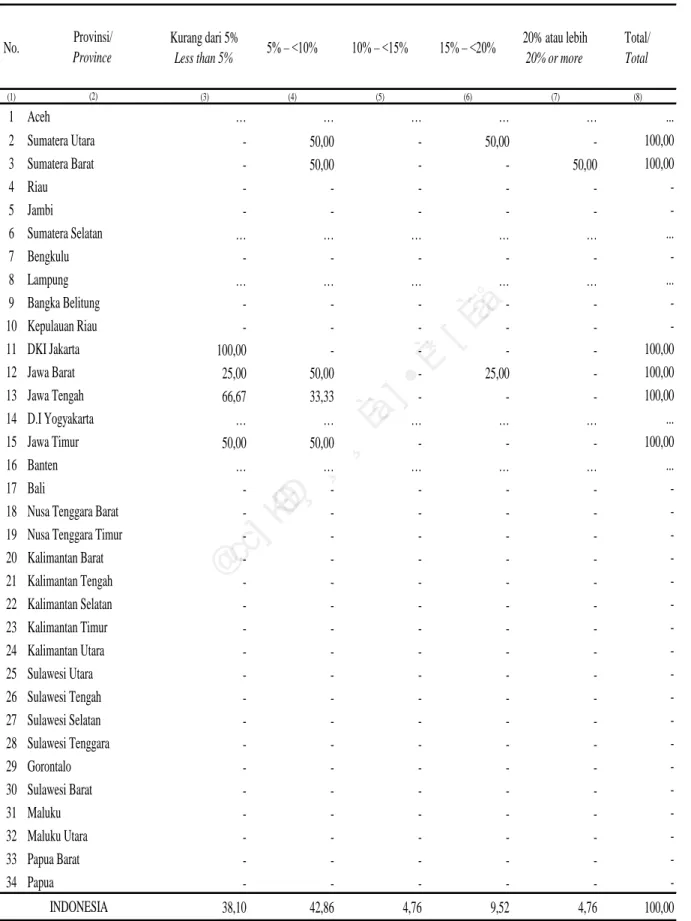
Tabel
Table Percentage of Railways Transport Establishments by Province and Percentage of Electricity Cost to Total Operating Cost
No. Kurang dari 5%
Less than 5% 5% – <10% 10% – <15% 15% – <20% 20% atau lebih 20% or more Total/ Total (1) (3) (4) (5) (6) (7) (8) 1 Aceh … … … ... 2 Sumatera Utara - 50,00 - 50,00 - 100,00 3 Sumatera Barat - 50,00 - - 50,00 100,00 4 Riau - - - -5 Jambi - - - -6 Sumatera Selatan … … … ... 7 Bengkulu - - - -8 Lampung … … … ... 9 Bangka Belitung - - - -10 Kepulauan Riau - - - -11 DKI Jakarta 100,00 - - - - 100,00 12 Jawa Barat 25,00 50,00 - 25,00 - 100,00 13 Jawa Tengah 66,67 33,33 - - - 100,00 14 D.I Yogyakarta … … … ... 15 Jawa Timur 50,00 50,00 - - - 100,00 16 Banten … … … ... 17 Bali - - -
-18 Nusa Tenggara Barat - - -
-19 Nusa Tenggara Timur - - -
-20 Kalimantan Barat - - - -21 Kalimantan Tengah - - - -22 Kalimantan Selatan - - - -23 Kalimantan Timur - - - -24 Kalimantan Utara - - - -25 Sulawesi Utara - - - -26 Sulawesi Tengah - - - -27 Sulawesi Selatan - - - -28 Sulawesi Tenggara - - - -29 Gorontalo - - - -30 Sulawesi Barat - - - -31 Maluku - - - -32 Maluku Utara - - - -33 Papua Barat - - - -34 Papua - - - -38,10 42,86 4,76 9,52 4,76 100,00
Persentase Jumlah Perusahaan Angkutan Kereta Menurut Provinsi dan Persentase Biaya Listrik Terhadap Biaya Operasional
Provinsi/ Province (2) INDONESIA 6.5