Invest in Kenya:
Focus
Kisumu
July 2007
Kisumu
European Business Council for Africa and the Mediterranean
July 2007
Columbia University, New York, 2007
Kenya, along with 189 other countries, adopted the Millennium Declaration in 2000, which set out the millennium development goals (MDG) to be achieved by 2015. The MDG implementation process was initiated by the Government of Kenya in September 2002. The process is spearheaded by the Ministry of Planning and National Development in partnership with UNDP-Kenya and the Government of Finland, through a project titled ‘Mainstreaming MDGs in Kenya’s Development Process’. One component of the project is support to Kisumu city to review its city development strategy and profile investment opportunities to attract private investment from within and outside the country. For more on the MDG project in Kenya, see Box I.1 in Chapter I. This Guide is part of the work supported by the project just described. It was pre-pared by the Millennium Cities Initiative (MCI), which is an initiative of the Earth Institute at Columbia University, undertak-en in cooperation with the MDG Support Team at the United Nations Development Programme and the Columbia Program on International Investment. The MCI is guided by Jeffrey D. Sachs and co-directed by Susan Blaustein and Karl P. Sauvant. Its initial effort focuses on helping seven cities in six African countries attract more foreign direct investment (FDI). The cities are: Kisumu, Kenya; Blantyre, Malawi; Kumasi, Ghana; Akure, Nigeria; Bamako–Segou, Mali; and Louga, Senegal. For more on the MCI, see the MCI website:
http://www.earthinstitute.columbia.edu/mci/. The millennium cities were chosen in part for their proximity to the millennium villages (http://www.earth.columbia.edu/ millenniumvillages/). In the case of Kisumu, the first millennium city to have an investors’ guide prepared for it, the millennium village is Sauri, in the neigh-bouring Siaya district in western Kenya.
The idea behind this Guide is to offer the reader a brief description of investment opportunities in the Kisumu area, supple-mented by a description of the investment climate and of the broader context of Kenya and East Africa. The MCI does not believe that serious investors can be attracted to an area through a purely ‘promotional’ approach, one that pro-motes the positive while hiding the nega-tive. So the Guide is written to be credible. The challenges that potential investors would face are described along with the opportunities they may be missing if they ignore Kisumu.
The Guide is intended to make Kisumu and what Kisumu has to offer better known to investors. Although we have had the foreign investor primarily in mind, we believe that the Guide will be of use to domestic investors in other parts of Kenya as well. While by no means the sole driver of growth and development, foreign direct investment does have a distinctive contri-bution to make. Not only does it bring scarce capital, it also brings know-how, technology and access to foreign markets. Furthermore, it helps improve the competi-tiveness of domesticenterprises, which must be the foundation of all growth. We hope that our investor readers find the Guide a useful practical tool.
This publication is for informational purpos-es only and is meant to be purely educa-tional. While our objective is to provide useful, general information, the Millennium Cities Initiative and other participants to this publication make no representations or assurances as to the accuracy, completeness, or timeliness of the information. The infor-mation is provided without warranty of any
does not constitute an offer, solicitation, or recommendation for the sale or purchase of any security, product, or service. Information, opinions and views contained in this publication should not be treated as investment, tax or legal advice. Before making any decision or taking any action, you should consult a professional advisor who has been informed of all facts relevant This Guide was prepared by the Millennium
Cities Initiative (MCI) of Columbia University (see Preface), under the responsibility of Karl P. Sauvant, Co-Director and Executive Director, Columbia Program on International Investment, and with the support of the Ministry of Planning and National Development of the Government of Kenya, UNDP Kenya, and the Government of Finland. We are grateful to the Kenya Investment Authority, the Municipal Council of Kisumu, the Lake Basin Development Authority, the Kenya Association of Manufacturers (Nyanza/Western Chapter) and the Kenya National Chamber of Commerce and Industry (Kisumu Branch) for their assis-tance to the project. We thank Vishwas P. Govitrikar, the lead consultant for the Guide, and Ashley Hufft, the MCI represen-tative in Kenya, for their role in developing this Guide, including the organization and conduct of a feedback workshop in Kisumu. Our thanks are owed to the companies and government agencies that participated in the workshop in Kisumu, as well as to the government agencies that participated in a feedback meeting in Nairobi hosted by the Kenya Investment Authority. Among those who provided substantial inputs to the Guide or the workshop, we should particu-larly like to thank Jit Bhurji, Susan Blaustein, Calvin Burgess, Leon D’Souza, Munira and Salima Gilani, Heikki Haili, Ghulam Abbas Hirani, Peter Jones, Susan Kikwai, Shirish Limaye, Saida Mäki-Penttilä, Gideon Mailu,
Sheil Malde, Laban Mburu, Umesh Menon, Ben Obera, Elijah Oburu, Simon Ochieng, Ruth Odinga, Nick Ogolla, Lindah Oguttu, Joyce Opondo, Seth Otieno, Fred Outa, Sailesh Shah, Tom Shepherd, Jörg Simon, Rumi Singh, Christine Tatua, Galib Tejpar, Sanjay Thakkar, Margaret Waithaka, Ferdinand Wanyonyi and George Wasonga. In addi-tion, the Business Licensing and Regulatory Reforms Unit in the Ministry of Finance, the Export Processing Zones Authority, the Export Promotion Council and the Kenya Investment Authority were important sources of information for the Guide. The preparation of the Guide was under-taken in parallel with three other related efforts, all focussing on investment opportu-nities in Kisumu and the regulatory frame-work governing it, by KPMG, UNIDO, and Cravath, Swaine & Moore LLP. These are still ongoing. Their results will be available in due course, and will complement and deepen the information provided by the Guide. We thank the Corporate Council on Africa and the European Business Council for Africa and the Mediterranean for their cooperation in this project.
Photographs for the Guide were provided by the Kenya Investment Authority, the Municipal Council of Kisumu and Vishwas P. Govitrikar. Administrative assistance in Kisumu was provided by Susan Siaji. Nelson Vigneault designed the Guide.
disclaimer
Table of contents
iii Preface
iv Acknowledgements
3 Executive summary
4 Maps
5 Kenya and Kisumu in brief
7 I.The broader context
7 1. A sketch of Kenya & East Africa
7 •The country 10 •The region
11 2. The economy
11 •Markets for investors 13 •Exports and imports 15 •Foreign direct investment 15 •Debt, reserves, etc. 17 II.Investing in Kisumu 17 1. Introduction
18 2. Opportunities for investors
18 •Main areas of interest to potential investors 24 •Other areas of interest to potential investors 32 3. Incentives, EPZs and related matters
32 •Incentives in Kenya 33 •Investment and tax treaties 34 4. The business environment
34 •Infrastructure 36 •Human resources
40 • The private sector in Kenya and in Kisumu 40 •Doing business in Kenya
43 5. Kisumu as an investment location: A summary for investors
45 III.Taxes and laws 45 1. Taxation in Kenya
45 •Corporate tax 45 •Personal income tax 45 •Excise tax
45 •Import duties 45 •Other
46 2. Legal framework for investment
46 •Investment law 46 •Incorporation and exit 46 •Priorities and restrictions
49 •Investment protection, investor treatment & dispute settlement 49 •Land
49 •Foreign exchange
51 IV.Investors and investment climate
51 1. Investor assessment of the investment climate
53 2. Foreign investors in Kisumu and in Kenya
56 Appendix
56 Pointers to further information 58 Sources consulted
Investment opportunities are abundant in Kisumu, from
agriculture to construction and manufacturing. The city
also offers an attractive and safe living environment.
Investment in Kenya generally, and in Kisumu particularly,
would grow and thrive even more if governments at all
levels were more proactive in its cause and concentrated
on creating a more enabling environment for investors.
Kisumu is an attractive city in Kenya on the eastern shore of Lake Victoria, one of the Great Lakes of Africa. Established as Port Florence, the lakeside terminus of the Uganda Railway, over a hundred years ago, it grew into a trade and transport hub for East Africa over the following fifty. Its prosperity continued into the first decades after independence, which came to Kenya in 1963. In 1977 occurred the first setback in Kisumu’s fortunes, as the then East African Community (EAC) collapsed and long-established transport and other links were severed. Kenya, and Kisumu with it, then went through a long period of relative decline, caused by poor governance, deteriorating security and neglected infrastructure.
In the new millennium, the trend has changed, as witness the steady increase in Kenya’s GDP growth rate, which was 6.1 per cent in 2006. External conditions have changed as well, with the EAC re-emerg-ing in 2000 and movre-emerg-ing towards both eco-nomic and political integration. Kisumu is thus poised to regain its former status as a regional hub. The present Guide is meant to alert investors to its potential and to provide an overview of the investment conditions it offers.
The principal opportunities in Kisumu are to be found in agriculture and agro-pro-cessing, dairy, and aquaculture. Western Kenya has long been known for some major crops, such as cane, cotton, ground-nuts and rice. There is a domestic market for some of these crops (e.g., rice) and products made from them (e.g., peanut butter) and a regional or overseas market for others (e.g., potable alcohol made from sugarcane). Aquaculture again has both domestic and foreign markets for its products, in particular for tilapia. Other opportunities may be found in service sectors. Kisumu has a serious prospect for conference and leisure tourism from the East African region. Water transport on Lake Victoria, for cargo in particular, also
offers opportunities. There may be oppor-tunities in construction as well, as there is a real shortage of low-cost housing. A number of regional and international trade agreements enhance Kenya’s access to foreign markets. The EAC Customs Union Protocol is already in place in the three founding members of the EAC (Kenya, Tanzania and Uganda) and will soon be extended to the two new mem-bers, Burundi and Rwanda. Kenya is also a member of the Common Market for Eastern and Southern Africa (COMESA) and one of the 11 (out of 20) countries that belong to its free-trade area. Overseas, Kenya was the first country to qualify under the apparel provision of the African Growth and Opportunity Act (AGOA) of the United States. (In 2006, Kenya’s garment exports to the US were worth USD 273 million.) It is also a mem-ber of the ACP agreement with the European Union and is eligible for GSP preferences, which give it preferential access not only to the EU market but also to other rich markets such as Japan. It is only fair to add that the investment climate is not without its challenges. Transport infrastructure linking Kisumu to its customers and suppliers is not all that it should be. Although the road networkin Kenya is more extensive than in its neigh-bours, road conditionsare often very poor. The railway from Mombasa to Kisumu is not in much better shape, although improvement is expected since the conces-sioning of Kenya Railways to a South African firm in 2006. The regulatory frame-work offers its own challenges, in the form of cumbersome licensing and customs procedures, although the licensing system is being cut back and simplified. Against these challenges, however, one needs to put the attractions of Kisumu: its safety, its climate and its workforce. Any investor interested in Africa needs at least to consider this lakeside city in the heart of East Africa.
Kenya in brief
Official name: Republic of Kenya Capital: Nairobi
Form of government: Multi-party democracy Head of state and
of government: President Mwai Kibaki
Location: East Africa (see map), with an Indian Ocean coastline of 536 km. Surface area: 582,646 sq. km, of which water 11,230 sq. km and
national parks 25,334 sq. km.
Climate: Hot and humid on the coast, temperate inland and very dry in the north and northeast. Two periods of rainfall: the long rains between March and June, and the short rains between October and December.
Population: 34 million (estimate)
Religions: Christian (78%), Muslim (10%), indigenous African and other (12%).
Languages: English is the official language and Kiswahili the national language. Many of Kenya's over 40 ethnic groups have their own languages.
GDP: USD 17.4 billion – at purchasing power parity, USD 40.8 billion (2005).
GDP per capita: USD 470 – at purchasing power parity, USD 1,100 (2005). Currency: Kenyan shilling (KSh)
Exchange rate: USD 1 = KSh 67 in mid-2007.
Kisumu in brief
Location: On the eastern shore of Lake Victoria, Nyanza Province, western Kenya.
Notable natural
feature: Lake Victoria, the second largest freshwater lake in the world, with a surface area of 69,000 sq. km2, of which 4,113 sq. km2
belongs to Kenya and the rest roughly equally to Tanzania and Uganda.
Climate: Moderate tropical, 17° to 29° Celsius round the year. Population: Kisumu district 565,000 and Kisumu city 375,000 (estimates)
Religion: Mainly Christian, with a significant Muslim minority
Languages: English, Kiswahili and Dholuo, one of the languages in the Luo family. The main ethnic group in the area is Luo. Economic activity: Sugar, fishery, agriculture, some tourism, large informal
economy
Spectre International is a team effort by Kenyan and Canadian
investors, to revive an industrial plant that politics had made idle
for twenty years. Our aim is two-fold, to do profitable business
and to contribute to Kisumu’s development. We are very pleased
with our progress over the past three years and would like
to see other investors join us in Kisumu.
1. A sketch of Kenya and East Africa
The country
Kenya is a sizable country in East Africa, almost twice the size of Italy. The Indian Ocean provides it with a 536 km coastline on the east. Tanzania shares its border to the south, Uganda to the west, and Sudan, Ethiopia and Somalia to the north. To the southwest lies Lake Victoria, the second largest freshwater lake in the world and the source of the White Nile (which joins the Blue Nile at Khartoum to form the Nile proper). Some six per cent of the lake belongs to Kenya; the rest in roughly equal proportions to Tanzania and Uganda.
The population of Kenya was around 34 million in 2006, nearly 80 per cent of it rural. The three largest cities are Nairobi (about 3 million), Mombasa (about 900,000) and Kisumu (about 375,000), the last the focus of this guide. Although there is some uncertainty about religious affiliations, the overwhelming majority is Christian, with significant minorities of Muslims and practitioners of traditional African faiths. There are said to be over 40 ethnic groups in Kenya but the princi-pal ones are the Kikuyu, the Luhya, the Luo (who predominate in Kisumu), the Kalenjin and the Kamba.
Kenya is the economic hub of East Africa and has been so for a long time, even though, in the 44 years since it became an independent country in 1963, the econ-omy has known some serious ups and downs. The good years were the 60s and the 70s, when import substitution reigned and a diversifying economy grew at an average of 6.5%. Growth faltered in the 80s and per capita incomes actually fell through the 90s. Recovery seemed to begin with the election of a new govern-ment in the new millennium.
Expectations were high when the National Rainbow Coalition (NARC) took power in December 2002 and there were a number of positive signs at first. (Kenya had long been a one-party state, de factoat first and then de jure, until multi-party democ-racy came to stay in 1992.) Corruption, for instance, long a bane of the Kenyan economy, seemed to decline in the first year or two of the new regime. But appar-ently it did not last, according to the Kenya Bribery Index of 2006.1Two other issues of
concern to all investors, whether domestic or foreign, have been infrastructure and security. The difficulties in these areas have eased somewhat, but not dramatically so.
i.
the broader context
1Published by the Kenya Chapter of Transparency International, on the basis of a survey of 2,405 respondents in all eight provinces.
Nonetheless, there area number of positive signs as the NARC government approaches the end of its first mandate. (Elections must be held by December 2007.) The most obviously encouraging of these is the resumption of growth(Figures I.1 and I.2). Another is the steady increase in exports(Figure I.4 below), although imports have gone up as well, as the price of petroleum has risen, and the trade deficit has increased. Beyond these num-bers are the various policy and legal meas-ures taken by the government. A new Investment Actwas passed in 2004 and amended in 2006 to remove some of the obstacles to foreign direct investment (FDI). (See the discussion of the investment framework in Chapter III below.) The Privatization Bill, which had stalled, became law in 2005 and provided for the setting up of a Privatization Commission, expected in 2007. The management of
the Kenya Railways Corporation, along with that of its Ugandan counterpart, was privatized in 2006 through a 25-year con-cession.2 The government sold 30% of
KenGen, the electricity-generating compa-ny, in a hugely successful IPO in 2006 and is planning to sell a further 19% this year. Privatization remains one of the
Government’s priorities. Other economic priorities are embodied in the Economic Recovery Strategy for Wealth and Employment Creation, the Investment Climate Action Plan, the Private Sector Development Strategy (PSDS) and the National Export Strategy. All of these are meant to create a more enabling environ-ment for business and to lead to economic growth and poverty reduction. From them have followed various measures to enhance security, strengthen infrastructure, stream-line procedures and simplify regulations.
Kenya, along with 189 other countries, adopted the Millennium Declaration of the United Nations in 2000, which set out the Millennium Development Goals (MDG) to be achieved by the year 2015. Today, Kenya is one of four African countries implementing the Millennium Project, a United Nations initiative undertaken to sup-port member countries in assessing their investment requirements for the promotion of equity, the reduction of poverty levels, and thus the achievement of the MDG. The MDG process in Kenya is spearheaded by the Ministry of Planning and National Development, in partnership with UNDP Kenya and the Government of Finland, through a project titled ‘Mainstreaming MDGs in Kenya's Development Process’.
The MDG project in Kenya aims to mainstream MDGs into Kenya's national policy formulation though MDG-based planning, budgeting, monitoring and reporting processes. While targeting the poor, the project also involves the Government, Civil Society Organisations (CSOs), and various development partners through such activities as a) building the capacity of key public sectors for MDG mainstreaming in policy formulation and planning processes and of non-state actors to participate in the process; b) undertaking MDG campaigns and awareness-raising; c) developing a National MDG-based Long-term Framework for Action; and d) undertaking comprehensive MDG tracking and reporting.
In addition, the MDG project in Kenya has produced MDG Needs Assessment Reports, launched by the Minister for Planning and National Development, the Honourable Henry Obwocha. These reports highlight the requirements necessary to achieve the MDGs in Kenya by 2015, as well as the cost estimates to fulfill those requirements. In order to achieve the MDGs in Kenya by the year 2015, the Government of Kenya has, through its budget Strategy Papers, shifted the allocation of resources to Kenya's core poverty sectors of agriculture, health, infrastructure and the environment. Finally, another component of the MDG project in Kenya is sup-porting Kisumu's city development strategy and the profiling of investment opportunities in the Kisumu area to attract private investment from within and outside the country.
Source:Millennium Cities Initiative, drawing on information provided by the Ministry of Planning and National Development, UNDP Kenya and the Government of Finland.
Box I.1. Millennium Development Goals in Kenya
2To Rift Valley Railways of South Africa.
2002 2003 2004 2005 2006
7
6
5
4
3
2
1
0
Source:National Bureau of Statistics, Economic Survey 2007, launch presentation.
0.5
2.9
5.1
5.7
6.1
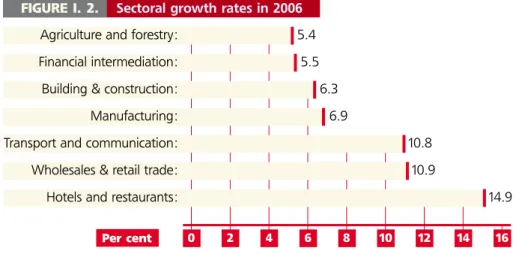
FIGURE I.1. Real GDP growth at market prices, 2002-2006
0 2 4 6 8 10 12 14 16
FIGURE I. 2. Sectoral growth rates in 2006
Agriculture and forestry: 5.4
Financial intermediation: 5.5
Building & construction: 6.3
Manufacturing: 6.9
Transport and communication: 10.8
Wholesales & retail trade: 10.9
Hotels and restaurants: 14.9
Source:National Bureau of Statistics, Economic Survey 2007, launch presentation.
The region
Kenya is one of the three founding mem-bers of the East African Community (EAC), along with Tanzania and Uganda, a region with an area of 1,768,812 sq. km and a population of just over 100 million. In November 2006, the heads-of-state sum-mit of the EAC agreed to adsum-mit two new members, Burundi and Rwanda, with the admission to take effect from 1 July 2007. The new five-member EAC will have a population of about 120 million. The EAC shares its boundaries with seven countries: the Democratic Republic of the Congo (DRC) to the west; Sudan, Ethiopia and Somalia to the north; and Malawi, Mozambique and Zambia to the South. The notable physical features of the EAC area include the two highest mountains in Africa, Kilimanjaro and Kenya, the Great Rift Valley and, of course, Lake Victoria. The EAC also has remarkable natural assets in its diversity of minerals and mammals, both significant attractions for investors, in mining and tourism respectively.
The Community has a long history of regional cooperation3and it actually had
a predecessor that dissolved in 1977. The cultural and economic ties were too strong, however, to let separation last and the EAC began to reconstitute itself in the early 90s. The objectives of the Community, finally established by treaty in 2000, are to widen and deepen inte-gration among the partner states, includ-ing economic integration but goinclud-ing beyond that. In fact, it is of some conse-quence to note that the EAC is not just yet another preferential trade area. It is a relatively compact and homogeneous group – unlike, say, COMESA or ECOWAS – and it has a rather firm grip on where it wants to end up and when. The ultimate objective is political federation and, if the schedule of the EAC’s fast-tracking com-mittee is followed, it would happen by 2013 (Figure I.3 below). Although there have been some inevitable delays in implementing these steps, the schedule as a whole is more or less on track.
FIGURE I.3. EAC integration schedule, as recommended by the Fast-tracking Committee
Implementation of the Customs Union Protocol: January 2005
•
Creation of a single regional air space: August 2005
•
Setting up of a regional Capital Markets Authority: December 2005
•
Setting up of a Common Market: December 2007
•
Adoption of a single regional currency: September 2009
•
Swearing-in of the President of a transitional Federation of East Africa: January 2010
•
Drawing up of regional constituencies and swearing-in of a transitional Federal Parliament: 2010–2012
•
Elections for an East African President and Government: March 2013 Source:As in fn. 3 above.
3See Chapter I of UNCTAD’s An Investment Guide to the East African Community, 2005.
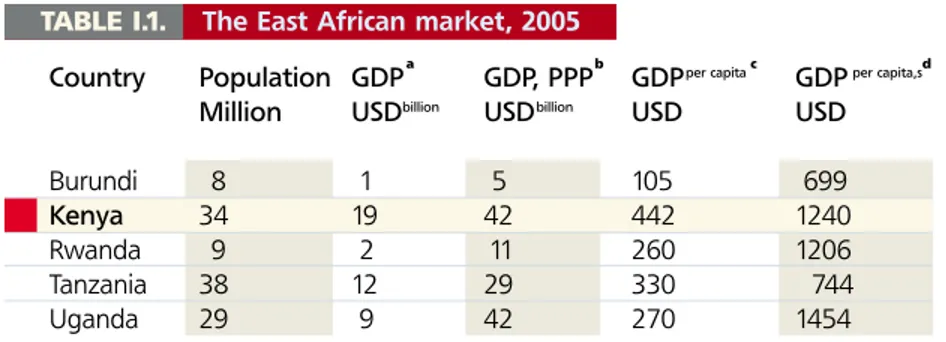
TABLE I.1. The East African market, 2005
Country Population GDPa GDP, PPPb GDPper capitac GDPper capita,sd
Million USDbillion USDbillion USD USD
Burundi 8 1 5 105 699
Kenya 34 19 42 442 1240
Rwanda 9 2 11 260 1206
Tanzania 38 12 29 330 744
Uganda 29 9 42 270 1454
Source:Adapted from the World Bank, World Development Indicators, 2007.
aAt current USD. bAt current international USD. (‘PPP’ is purchasing power parity.) cAt constant 2000 USD. dAt current international USD.
2. The economy
Markets for investors
Despite a poor-to-fair performance in the 80s and 90s, Kenya remains easily the strongest economy in the region, just as it was in the early post-independence years 40 years ago. It is the most diversi-fied, with a small but significant manu-facturing sector, has the best-regarded workforce in the region – perhaps the best between Egypt and South Africa – and the strongest domestic private sector. Nairobi is the air traffic hub of the region, with the privatized Kenya Airways among the top airlines in the continent, and Mombasa is the region’s main seaport. The Kenyan market is relatively small, though not insignificant, but an investor in Kenya has access to other markets as well, the nearest of course being the now five-member EAC, a market of nearly 120 million consumers (Table I.1 below). Beyond the EAC, there is the
Common Market for Eastern and Southern Africa (COMESA), which contains some 400 million consumers in 20 countries. Within COMESA, 11 coun-tries including Kenya have formed a free-trade area (FTA).4At its recent (May
2007) 12th Summit in Nairobi, COMESA members agreed that a customs union would come into effect as of December 2008, with the Common External Tariff (CET) to be set at 0% for raw materials and capital goods, 10% for intermediate goods, and 25% for finished goods, with a provision for flexibility on policy space. The EAC Customs Union Protocol, which came into force in January 2005, has adopted a three-band CET that is almost identical. The EAC protocol further binds the members to institute full free trade within five years, i.e., by 2010. Until then, there will be a declining asymmetri-cal tariff on Kenyan exports to Tanzania and Uganda, in recognition of the fact that EAC trade is mostly one-way, Kenya exporting to its partners but importing relatively little in turn.5
4The other 10 coun-tries are Burundi, Djibouti, Egypt, Madagascar, Malawi, Mauritius, Rwanda, Sudan, Zambia and Zimbabwe. Of the five EAC members, Uganda is a member of COME-SA but not of the FTA, while Tanzania is not a member of COMESA at all but instead of the Southern African Development Community (SADC). These overlapping memberships can create inconsistencies that the EAC needs to address.
5It should be noted that the EAC has a list of ‘sensitive products’ that carry much higher tariffs than the CET specifies. The sensitive products include wheat and maize flour, milk and cream, tobacco, rice, fabrics of various sorts, sacks and bags, etc. For a list, see Appendix 1 to UNCTAD’s 2005 EAC guide; for discussion, see Heinz-Michael Stahl, 2005.
Beyond its neighbourhood, Kenya has access to two key markets: the European Union and the United States. (New mar-kets are being developed in the Middle East and India.) Although Kenya does not qualify for the EU’s ‘Everything But Arms’ initiative – since it is not what the United Nations calls a ‘least developed country’,6
unlike the other members of the EAC – it does qualify under the EU’s agreement with the African, Caribbean and Pacific States (ACP) and also under the Generalised System of Preferences (GSP), which latter gives Kenya preferential access not only to the EU but to many other rich markets (e.g., Japan) as well. As far as the US market is concerned, what is relevant is the African Growth and Opportunity Act (AGOA) – see Box I.2 below.
The African Growth and Opportunity Act (AGOA) was signed into law on 18 May 2000. It is meant to encour-age market forces in African countries by offering them the best access to the US market available outside of free-trade agreements. The Act covers some 6,400 items, including textiles and apparel. The AGOA Acceleration Act, signed into law on 12 July 2004 and known as AGOA III, extends this preferential access until 30 September 2015.
Eligibility for AGOA benefits is determined annually on the basis of a review by a committee chaired by the United States Trade Representative (USTR). The criteria require that the country have established, or be making progress towards establishing, a market economy, the rule of law, policies to reduce poverty, and a system to combat corruption. Currently, 38 sub-Saharan countries qualify as eligible, including Kenya.
Ready-made garments have been of particular interest to Kenya, as the Act provides duty-free and quota-free treatment for eligible apparel articles made in qualifying sub-Saharan African countries through 2015. Kenya's textile exports to the US increased from USD 39.5 million in 1999 to USD 273 million in 2006. Total invest-ment in the sector, mainly in the export-processing zones (EPZs), stood at KSh 10,317 billion in 2006, while employment stood at 31,813. (For restrictions on apparel exports under AGOA, see Box III.6 in UNCTAD’s 2005 Kenya guide.)
Sources:AGOA website: www.agoa.gov/index.html; EPZA sector profile of the apparel and textile industry: http://www.epzak-enya.com/UserFiles/File/ApparelTextile.pdf; and UNCTAD, 2006.
Box I.2. AGOA 6 Broadly speaking, ‘LDCs’ are not only poor but have little economic diversification and low levels of skills. Most countries in sub-Saharan Africa are LDCs. Kenya is among the few that are not. If income were the only criterion, it would be.
Exports and imports
Exports are the great Kenyan success story of recent years. As Figure I.4 shows, the top three export products retain their collective lead, though not their individual positions. Tea yielded the top spot to horti-culture a while ago, and tourism replaced horticulture in 2005. Coffee, in decline for many years because of global competition among other things, also picked up a bit in 2005. These remain Kenya’s principal exports, along with ready-made clothing, which does not appear in Figure I.4 but would rank immediately after tea if it did (see box on AGOA above).
Other exports include fish, plastic goods and pharmaceuticals.
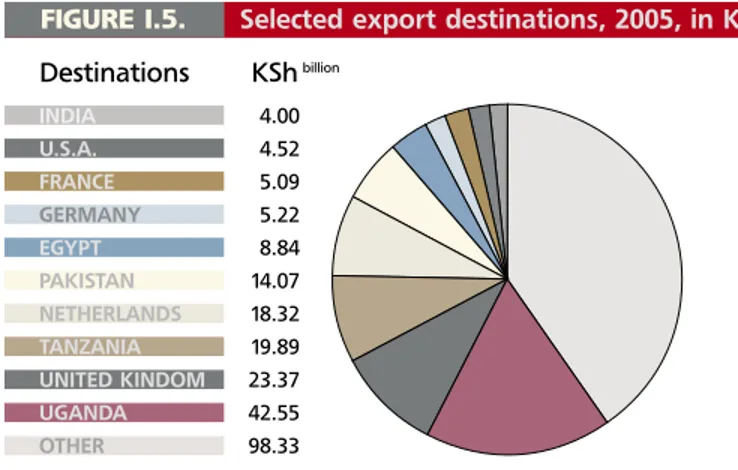
The pie chart below (Figure I.5) shows the chief destinations of Kenya’s exports in 2005. The top five destinations – Uganda, the UK, Tanzania, the Netherlands and Pakistan – have been the top five for a decade, though not always in that order. Between 1998 and 2000, Pakistan took in substantially more of Kenya’s exports than did the Netherlands. The main export to Pakistan has been tea, while to the Netherlands it has been flowers, and floriculture really took off in the new millennium.
FIGURE I.5. Selected export destinations, 2005, in KSh billion
INDIA 4.00 U.S.A. 4.52 FRANCE 5.09 GERMANY 5.22 EGYPT 8.84 PAKISTAN 14.07 NETHERLANDS 18.32 TANZANIA 19.89 UNITED KINDOM 23.37 UGANDA 42.55 OTHER 98.33
Source:Adapted from the Economic Survey 2006by the Export Promotion Council.
Destinations KShbillion
Source:Adapted from the Economic Survey 2006by the Export Promotion Council.
FIGURE I.4. Selected exports by value, 2000-2005, in KSh billion
60 50 40 20 10 0 48.9 TOURISM 44.56 HORTICULTURE 42.29 TEA 9.7 COFFEE
8.85 IRON & STEEL
4.61 FISH & FISH PREPARATION
2000
2001
2002
2003
2004
2005
35.2 21.22 21.55 11.7 2.95 2.61 KShbillionIt is obvious from Figure I.5 that Kenya’s exports to the region, in particular to Uganda and Tanzania, are substantial. Petroleum re-exports are a major part of the exports to Uganda but Kenya exports many other things to the EAC. In fact, most of its merchandise exports other than horti-culture, garments and tea (which go to the EU, the US and a few other countries over-seas) are destined for the region – hence the asymmetrical tariff on them until 2010. Incidentally, it should be noted that not all trade within the EAC shows up in the offi-cial figures, as a good deal of it is informal.
The top ten imports and the top ten sources of imports appear in Table I.2. Petroleum and petroleum products together account for over 20% of Kenya’s import bill. Industrial machinery and motor vehicles follow. It is notewor-thy that no EAC or COMESA member appears among the top ten sources. Indeed, no African country other than South Africa makes the list. Nonetheless, Kenya does have regional imports, including tobacco, beverages and cereals from the EAC and sugar and chemicals from COMESA.7
TABLE I.2. Top 10 import products & import sources in 2005, with values
1 Crude petroleum 51.53 United Arab Emirates 62.13
2 Industrial machinery 48.06 United States 42.49
3 Petroleum products 46.07 South Africa 42.31
4 Road motor vehicles 25.24 Saudi Arabia 27.58
5 Plastics in primary & non-primary forms 17.64 United Kingdom 26.13
6 Animal & vegetable fats 14.01 India 24.24
7 Medicines & pharmaceuticals 12.51 Japan 23.02
8 Chemical fertilizers 10.65 China 19.76
9 Wheat unmilled 7.96 Germany 15.76
10 Organic & inorganic chemicals 7.62 France 13.88
Source:Adapted from the Economic Survey 2006by the Export Promotion Council.
Product KShbillion Country KShbillion
7On sugar from COME-SA, see more in Chapter II below.
Note:The list of products and the list of countries are unrelated to each other. Total imports in 2005 were valued at KSh 430.74 billion.
Country 2003 2004 2005 Burundi .. -2 -1 Kenya 82 46 21 Rwanda 5 8 8 Tanzania 527 470 473 Uganda 202 222 258
Source:UNCTAD, World Investment Report 2006, Annex Table B.1.
Foreign direct investment
Kenya has long been a surprising laggard in East Africa when it comes to foreign direct investment (FDI). Just as FDI flows to developing countries began to surge in the early 90s, Kenya’s inflows began to fall. In the late 90s Kenya was averaging USD 40 million a year when Tanzania and Uganda were averaging over USD 200 million. FDI seemed to pick up a bit in 2003 but has languished again since. However, over the past several years, the government has been pursuing a variety of measures to create a more appealing environment for potential investors. These include the passage of the bills on invest-ment and privatization invest-mentioned earlier, a simplification of licensing and other procedures and a variety of incentives in export-processing zones (EPZs). For further discussion, see Chapters II and III below.
Debt, reserves, etc.8
Kenya’s external debt in February 2007 was USD 5.41 billion, 61% of it owed to multilateral creditors and 35% to bilateral ones. Foreign-exchange reserves were USD 3.57 billion in April 2007, providing 3.7 months’ import cover. The underlying inflation rate was under 5%, while the overall inflation rate was just under 11%. Remittances by Kenyans abroad amount-ed to about USD 1 billion in 2006.
8These figures are mainly from the Central Bank of Kenya’s Monthly Economic Review, April 2007.
Kisumu is Kenya's third biggest city. With its
strategic location, hardworking people and agreeable
climate, it remains an ideal place to invest in today's
Africa. A metropolitan attitude without the hassles of
a big city makes for higher productivity in business.
With good governance and sound investment,
Kisumu can realize its potential for greatness.
1. Introduction
Kisumu, on the eastern shore of Lake Victoria, is Kenya’s third largest city, after Nairobi and Mombasa. It is the capital of Nyanza province and the administrative centre of Kisumu district. The population of Kisumu district was projected to be around 565,000 in 2007, with perhaps two-thirds of that (375,000) being the city population. The climate is warm and humid, moderated somewhat by the ele-vation of over 1,100 metres. The annual rainfall, during the long and short rains in March-June and October-December respectively, is 1,245 mm.
(The reader should note that, in speaking of Kisumu as a location for investment, this guide intends to include both the city proper and the area of which it is the commercial and administrative centre. The map that appears at the beginning of this guide, showing towns and districts within a 60-km radius of Kisumu, is a good approximation of what is intended.) The modern city of Kisumu began life as Port Florence, the lakeside terminus of the Uganda Railway, which reached Kisumu (from Mombasa) in 1901. Further transport to Uganda was provided by ferry. The rail link with Mombasa on the Kenyan coast and the water transport links with Port Bell, Entebbe and Jinja in Uganda and with Bukoba and Mwanza in Tanzania were the foundation of Kisumu’s rise to prominence as an East African trading hub. The railway from Mombasa still reaches Kisumu, viaNairobi, but has suffered greatly from a lack of investment and poor maintenance. Rift Valley Railways (RVR) of South Africa now has a 25-year concession to rehabilitate and run the railway, but the transfer to private management, complet-ed in 2006, is still too new to have made a difference. Kenya Airways offers two daily flights between Nairobi and Kisumu and other airlines offer another half a dozen. There have been some discussions about upgrading Kisumu airport to international status, which would be a substantial attraction to export industries, but this is thought unlikely to happen soon. Economically, the good years in Kisumu were the same as in Kenya generally, the 60s and the 70s. Since then, the economy of the city has tended to stagnate. One explanation sometimes offered is trade lib-eralization, which is said to have damaged the traditional industries of cotton and sugar. Another is that the sugar industry in particular has been dominated by paras-tatals and has suffered from the usual problems of underinvestment and poor
management that characterize the state-owned sector. This has been compounded by the neglect of infrastructure, both with-in the city and with-in its external lwith-inks, thus raising production costs and reducing mar-ket access. A further difficulty has been damage to the enormous natural resources represented by Lake Victoria, through pollution, overfishing and the growth of water hyacinth.
Nonetheless, Kisumu is a vital city. The Municipal Council of Kisumu9has recently
outlined a development strategy that places investment and public-private partnership at its very centre. Kisumu is the headquarters of both the Lake Basin Development Authority (LBDA) of Kenya and the Lake Victoria Basin Commission (LVBC) of the East African Community. (For some investment opportunities iden-tified by the LBDA, see section 2 below.) A number of educational institutions are based in or near Kisumu. These include Maseno University, Kisumu Polytechnic, Tom Mboya Labour College and the Great Lakes University of Kisumu (formerly the Tropical Institute of Community Health and Development). Other related institutions are the Centre for Disease Control and the Kenya Medical Research Institute. The city also offers a well-regarded workforce, both skilled and unskilled.
The development strategy mentioned above has a vision of Kisumu as a leading transport, communication and commercial hub in the Great Lakes10Region, offering
great tourism and agro-investment oppor-tunities. As the closest municipality to the Millennium Village Cluster, the integrated rural development project of the Earth Institute and the World Agroforestry Centre (ICRAF) located in the neighbouring Siaya District, Kisumu is the logical manufactur-ing, processing and marketing centre for the increased and diversified agro-produc-tion expected to issue from the Millennium Villages over the coming months.
2. Opportunities for investors11
Main areas of interest to potential investors
Sugar and ethanol
Sugar has long been the major industry in western Kenya and several million people are thought to be supported directly and indirectly by the industry. There are some 200,000 smallholders who grow cane and seven operating sugar mills, as well as transporters and distributors. The small-holder farms are typically small, of less than 1 ha, and the cane yield per ha is low, 50-60 tonnes per ha, as against nearly 100 tonnes per ha in Tanzania. The variety of cane commonly grown also has a long maturity period and a low sugar yield.
Of the seven sugar mills – Mumias Sugar Company Ltd., West Kenya Sugar Company Ltd., SOIN Sugar Company Ltd., Muhoroni Sugar Company Ltd., Nzoia Sugar Company Ltd., Chemelil Sugar Company Ltd., and South Nyanza Sugar Company Ltd. (SONY) – four are state-owned, along with a fifth that ceased operation in 2001.12Mumias, West Kenya
and SOIN are private enterprises. Mumias is the largest and accounts for nearly half of Kenya’s total production. It is also the most efficient. The state-owned companies are both inefficient and deeply in debt. The chief impending problem for the most-ly uncompetitive sugar industry is that its protection against much cheaper imports from its COMESA partners, mainly Egypt and Swaziland, is set to disappear in early 2008. There is a possibility that the safe-guard agreement that provides this protec-tion could be extended for another two years, until 2010. The agreement currently restricts imports to 200,000 tonnes, which is about a third of the total Kenyan demand. The seven Kenyan sugar factories produce the remaining 500,000 tonnes.
9Kisumu City Development Strategies (2004-2009), no date.
10The largest of the Great Lakes of Africa are all in East Africa: Lake Victoria, Lake Tanganyika and Lake Malawi (also known as Lake Nyasa), in that order.
11A team from Columbia University’s School of International and Public Affairs car-ried out a substantial study of investment opportunities in Kisumu in 2006-2007 for the Millennium Cities Initiative. The present section draws extensive-ly on this study. Although the study had a broader development mandate than simply identifying commercially profitable prospects, its assessments keep com-mercial viability very much at the front and centre, and are thus of direct relevance to investors. See Aguilo, et al., 2007, in Sources consultedat the end.
12The fifth is Miwani, the oldest sugar factory in Kenya, set up in 1922.
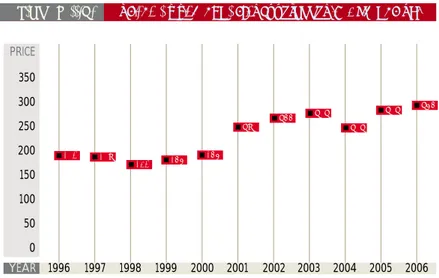
What keeps the domestic firms afloat is the high domestic price. The average retail price for a kilo of mill white domestic sugar in 2006 was KSh 64, while the aver-age ex-factory cost for the industry as a whole was KSh 53.54/kg. At the same time, the average landed price for mill white imported sugar was KSh 29.05/kg. Figure II.1 shows the difference in prices per tonne over a 10-year period. Under these circumstances, many believe that only Mumias could survive the full liberalization of imports.13If the
state-owned enterprises are to survive, they would need to be privatized.
This, then, is one opportunity for investors, to invest in the existing private companies and to invest in the state-owned ones when privatized. Mumias demonstrates that sugar canbe produced competitively in Kenya and there issubstantial domestic demand to be met at competitive prices.
It is unclear how quickly the privatization of the SOEs could occur. The Privatization Bill is now law and a Privatization Commission is to start operating this year. On the other hand, the SOEs would need to go through a restructuring process to deal with their substantial debts. The gov-ernment does regard privatizing these firms as a priority, however, and Muhoroni and Miwani are said to be ready for privatization. The other major opportunity is in using sugarcane to produce ethanol rather than sugar. Ethanol is produced for consump-tion, for industrial purposes such as solvents, and above all for fuel. It can be derived from juice squeezed from sugar-cane, molasses produced as a by-product of sugar production, or sugar crystals. A common strategy is to link an ethanol dis-tillery to a sugar mill, limiting transport and energy costs, and allowing the producer to shift back and forth between sugar and ethanol as their relative prices fluctuate.
13Aguilo, et al., 2007. JANUAR Y 1 9 96 APRIL 1996 JUL Y 1996 OCT OBER 1996 JANUAR Y 1 9 97 APRIL 1 997 JUL Y 1 997 OCT OBER 1 997 JANUAR Y 1 9 98 APRIL 1 998 JUL Y 1 998 OCT OBER 1 998 JANUAR Y 1 9 99 APRIL 1 999 JUL Y 1 999 OCT OBER 1 999 JANUAR Y 2000 APRIL 2000 JUL Y 2000 OCT OBER 2000 JANUAR Y 2001 APRIL 200 1 JUL Y 200 1 OCT OBER 200 1 JANUAR Y 2002 APRIL 2002 JUL Y 2002 OCT OBER 2002 JANUAR Y 2003 APRIL 2003 JUL Y 2003 OCT OBER 2003 JANUAR Y 2004 APRIL 2004 JUL Y 2004 OCT OBER 2004 JANUAR Y 2005 APRIL 2005 JUL Y 2005 OCT OBER 2005 JANUAR Y 2006 APRIL 2006 JUL Y 2006 OCT OBER 2006 70,000 60,000 50,000 40,000 30,000 20,000 10,000
C.I.F MOMBASA EX-FACTORY
FIGURE II.1. Sugar prices, ex-factory Kenya & cif imports, 1996-2006
KSHS / TONNE
There are several distilleries currently in place in and around Kisumu, producing industrial or potable alcohol. One of them belongs to Spectre International, which has rehabilitated the abandoned facility of the Kenya Chemical and Food Corporation (KCFC) on the outskirts of Kisumu – see Box II.1 below.
An investment in fuel ethanol production could take the form of a greenfield opera-tion, with a stand-alone distillery produc-ing ethanol from feedstock drawn from nearby smallholders or from the nucleus estates of SOEs closed in the wake of an import surge. It could also take the form of investment in a distillery attached to an existing sugar mill.
A government mandate requiring the addi-tion of ethanol to fuel oil in a 10:90 ratio, an E10 mandate, is a possibility. Certainly, Kenya would gain from reducing its very large fuel import bill. The availability of feedstock is another incentive, especially if the demand for cane to produce sugar declines substantially in a post-2010 world of liberalized sugar imports. Kenyan ethanol may also have substantial export prospects, given the fuel needs of large and fast-growing economies like those of China and India.
Spectre International is a joint venture by Canadian and Kenyan investors that produces alcohol from molasses. The Canadian investor is Energem Resources Inc., a natural resources company listed on the Toronto Stock Exchange and engaged in 13 African countries in long-term energy and mining projects. Energem owns 55% of Spectre and has thus far invested around USD 12 million. The company has 200 permanent employees and an additional 200 casual or contract employees. Three of the permanent employees are expatriates. Spectre International was set up in 2003, when it acquired the abandoned facility of the Kenya Chemical and Food Corporation (KCFC) on the outskirts of Kisumu. The KCFC began in the mid-1970s as a visionary state project responding to the oil crises of the 70s. The aim was to produce fuel ethanol from molasses. However, after a large investment was made and the plant was built, the project stagnated on account of financial as well as political problems. Spectre's reasons for locating near Kisumu, beyond the presence of the KCFC facility, included the proximity of Lake Victoria as a source of water and the availability of the necessary raw material, molasses, in the area.
The company's intended products fall in three categories: industrial ethanol for blending with liquid fuels (bio-fuels), alcohol for beverages and chemical industries, and yeast. At the moment, it is not producing fuel ethanol. It isproducing various grades of alcohol: neutral spirits for use in the manufacture and blending of products like vodka and brandy, rectified spirit for use as industrial solvent, and methylated spirits for use in a variety of industrial products and processes. It is also producing yeast of different sorts for use in baking. Spectre's markets are both in Kenya and in the region. At the moment, about 70% of the spirits the company produces are exported. Current production is around 60,000 litres a day (or 1.2 million litres a month). This could easily be doubled, with marginal investment, if sufficient feedstock were available.
Ruth Odinga, a director of Spectre, identifies taxation as the major challenge the company has faced. The Kenya Revenue Authority (KRA), according to Ms Odinga, seldom consults with stakeholders before issuing its directives. According to one recent KRA directive, spirit producers are required to pay what amounts to 400% of the product price in taxes up front. The effect of this sort of taxation, motivated by little except the desire to meet pre-set tax revenue targets, is to encourage regional buyers of Kenyan spirits to look for other and cheaper sources.
Nonetheless, Ms Odinga thinks there are opportunities in the Kisumu area which are well worth exploring. There are also tax advantages in locating outside Nairobi. Although the licensing regime is much criticized by investors, it is improving and a number of licenses are being abolished. Spectre itself is committed to Kisumu and would like to see more investors come to the area.
Source:Millennium Cities Initiative, drawing on information provided by Spectre International. Box II.1. Investment story: Spirits and yeast
Groundnuts (peanuts)
Nyanza province produces the majority of Kenya’s groundnuts. Nearly 60% of Kenyan land under groundnuts in 2003 was in Nyanza, producing 7.2 million kg valued at KSh 444 million. This is basically a subsistence crop, so the use of fertilizers and pesticides is minimal, and yields are low. The nuts are sold unprocessed in small quantities by informal vendors. There is some processing in Nairobi, which pro-duces either roasted and seasoned nuts or peanut butter. The processed products are sold to high-end supermarkets or to commercial users such as boarding schools. Peanut oil does not appear to be produced, at least on a large scale, and it is currently too expensive for most Kenyan consumers.
There is a definite opportunity in setting up a groundnut-processing plant in Kisumu, as 30 to 40 per cent of the provincial crop passes through Kisumu markets on its way elsewhere. Such a plant would be able to buy nuts at a lower cost than a plant in Nairobi and to sell its product at a lower cost. An investor in such a plant would also be able to supply inputs to outgrow-ers and to raise yields per ha from between 400 and 480 kgs to anything up to 1,000 kgs or more.
The plant could produce peanut butter or peanut oil. Peanut butter is an established product in Kenya and the market for it is growing at about 18% p.a.14A 300g
con-tainer of peanut butter produced in Kenya sells for about KSh 100; imported brands from South Africa and the U.S. sell for about twice that price. Peanut oil may also be a viable product. Even if it cannot be sold domestically for cooking purposes, it can be sold for use in processed foods, cosmetics, and paints and finishes. The process of oil extraction also produces oil-cake as a byproduct, which can be sold as animal feed or fertilizer. In the long run, peanut oil, widely used in Asian cooking,
may have significant export prospects. (Its import-substitution value is also consid-erable, as animal and vegetable fats are a major import in Kenya, valued at over KSh 14 billion or USD 200 million in 2005 – see Table I.2 in Chapter I above.)
Aquaculture
One would expect the largest Kenyan city on the shores of Lake Victoria to offer seri-ous opportunities for investors in fisheries. Unhappily, this does not seem to be the case. Although Lake Victoria has tradition-ally accounted for well over 90% of the fish landed in Kenya, fish stocks have been in sharp decline in recent years. In 1999, the Lake Victoria fish catch was 200,159 tonnes; in 2005, it was 124,625 tonnes.15
Part of this is due to pollution; part of it the unfortunate consequences of the intro-duction of an alien species, the Nile perch, into the lake in the 50s; and the third damaging element is the spread of water hyacinth, a weed that threatens fish through de-oxygenation, offers a hos-pitable site for malarial mosquitoes, and interferes with water transport. On the other hand, there areserious opportunities in aquaculture. Although aquaculture has thus far played a marginal role in the Kenyan economy (less than 1% of the total catch), it has a long history in the country, having been introduced in the 20s to support sport fishing. Most existing aquaculture is small-scale, with something over 7,000 ponds farmed by nearly 5,000 fish farmers. There is commercial potential to be developed, however, and the Department of Fisheries is taking a number of initiatives to expand and promote it. Kenya’s varied climate makes it suitable for farming a variety of fish including tilapia, African catfish, the common carp and rain-bow trout. Of these, tilapia is the preferred species for cultivation as it does not require sophisticated feeds, can withstand low oxygen levels and poor water quality, and
14 According to Truefoods Ltd, a Kenyan producer of peanut but-ter, as reported in Aguilo et al., 2007.
15 This was actually a recovery from the 2003 figure of 105,866 tonnes. Table 8 in Government of Kenya, Ministry of Environment and Natural Resources, March 2007.
does best in the warm waters found in the Lake Basin region. The rainbow trout is more demanding but fetches higher prices. A number of swamps amenable to aqua-culture have been identified, including Sondu Swamp, Yala Swamp and Nyando Swamp.
An example of commercial aquaculture on a large scale is about to be provided by Dominion Farms – see box below. According to both local observers and the Department of Fisheries, the Dominion model may be replicable, as the demand for fish is substantial and much of the Lake Basin wetlands unutilized.16 Tilapia, catfish
fingerlings, or both (in a process known as polyculture) offer opportunities. As the fish of choice within Kenya and a fish with increasing international demand, tilapia can serve both domestic and foreign markets. Given its proximity to Europe, an investor in Kenya would have an advantage over its Asian competitors in exporting fresh tilapia fillets to the EU.
Catfish production can serve the Kenyan market and provide fingerlings to be used as bait. The availability of fingerlings, immature fish acting as “seedlings” for fish farms or baitfish for long-line fishermen in Lake Victoria, is currently low. As reported in a USAID call for proposals to develop of catfish fingerling production clusters, the Kenyan demand is between 5,000 and 50,000 catfish fingerlings per day, or an annual demand exceeding 15 million fingerlings.17Considering that polyculture
systems combining catfish and tilapia are common, the sale of catfish fingerlings, either as seedlings or baitfish, presents a natural source of supplementary income for an investor interested in a tilapia farm. Another opportunity is represented by fish feeds. About two tonnes of feed are need-ed to produce a tonne of fish. The fact that a major constituent of fish feeds is sunflower seed or cottonseed oil cake underscores the suitability of Nyanza province as a location for a fish feed plant. Production of feeds from other locally produced oil sources such as groundnuts may also be feasible.
Source:Peche Foods, Kisumu, 2007 and EPZA, Fishery Industry in Kenya, 2005 (www.epzakenya.com/userfiles/file/fishkenya.pdf).
aPrices for all years except the year 2000 are from Peche Foods and for Nile Perch. The price for 2000 is from the EPZA
sectoral profile and is mainly for Nile Perch, said to account for more than 80% of Kenya’s fish exports.
16As reported in Aguilo, et al. One should note, however, that the wetlands are ecologically important. The Lake Basin Development Authority’s decision to award 17,000 acres of wetlands in Yala Swamp to Dominion Farms was opposed by local con-servationists. The possi-ble constraints imposed by conservation regula-tions such as the Nile Basin Treaty would also need to be looked into. (The treaty, signed in 1929, in effect guaran-tees that water flow to Egypt would not be reduced by the actions of the other nine signa-tories – most of whom are dissatisfied with the treaty as it stands.)
17Aguilo et al., 2007.
FIGURE II.2. Prices of fish exports, 1996-2006, in KSh per kga
PRICE 350 300 250 200 150 100 50 0 174 173 154 168 168 237 266 272 272 272 286 YEAR 1996 1997 1998 1999 2000 2001 2002 2003 2004 2005 2006
Dominion Farms is part of the Dominion Group of Companies, founded and owned by Calvin Burgess of Guthrie, Oklahoma. The Group's main business in the United States is in land and real estate development. Dominion Farms in Kenya is the Group's first agricultural venture, which began in 2003 and currently has over 400 permanent employees, including 5 expatriates. The company also employs up to 1,000 casual workers when required. The business mission is to produce and sell rice and other cereal grains in the Kenyan and East African markets, and tilapia fish in the Kenyan and European markets.
As of now, the Kenyan operation is still largely in a building stage, although substantial investment has already been made (USD 15 million) and the project's ambitions are considerable. The company expects to produce 100,000 tonnes of rice when fully operational by 2010. Also scheduled for completion in 2008 is an aquacul-ture operation capable of producing 20,000 tonnes of tilapia per annum. The aquaculaquacul-ture farm will be comple-mented by a feed mill and a fish-processing plant.
This was a business project motivated by philanthropy, by a desire to make a difference through an operation that would eventually become self-sustaining, creating employment and reducing poverty, while at the same time earning a reasonable return on the investment. There was no specific reason why Dominion began the project in Kenya, except that an opportunity was presented which looked like a challenge, and at the same time showed a promise of profitability. The company is fully foreign-owned and has no local partner. Mr Burgess, the CEO, assesses the investor's environment as poor, with infrastructure the main culprit. Port and customs services and the regulatory burden of a complicated licensing system have added to the company's difficulties. These are judgments shared by most investors in the area. Dominion Farms has also faced some unique challenges of its own, in the form of opposition by NGOs concerned with the environment, land rights and the like. Over time, the criticisms of the project, which the company sees as misrepresenting its intentions and accomplishments, have been diffused.
The urgent task for the government, in the company's view (again a view shared by the investor community generally), is to repair or replace the inadequate infrastructure, so that producers can get their goods to mar-ket. There have been some improvements in infrastructure (in roads, telecommunications, power supply, etc.) but much more needs to be done. Dominion Farms sees itself as in for the long haul and would like to encour-age other investors to come in with a similar long-term perspective. Without such a perspective, an investor is unlikely to succeed in the Kisumu area, since the area is as rich in difficulties as it is in opportunities. The com-pany plans to expand into other East African countries in due course.
Source:Millennium Cities Initiative, drawing on information provided by Dominion Farms.
Other areas of interest to potential investors
Rice
Rice is a staple food in Kenya, with con-sumption estimated at 250,000 tonnes a year and growth at 12% p.a., and it was once a major agricultural crop in western Kenya. However, it has suffered from a variety of problems, including a lack of seeds and fertilizer, little research support, inadequate irrigation and so forth. These have made it hard for domestic growers to compete with rice imported from Asia, in particular Pakistan, in a liberalized trade environment. So only about a fifth of the total demand is met domestically.
Many of the constraints on rice production could be dealt with by an investor pre-pared to make a significant investment. Kenya has the potential not only to meet its own demand for rice but also to supply the region. Nyanza Province’s proximity to Lake Victoria and its wetland composition make it an ideal site for irrigated rice pro-duction in Kenya. Dominion Farms again offers an example. It expects to have 5,600 ha under rice, producing twice as much rice as currently produced in the country as a whole.18
The Lake Basin Development Authority (LBDA) has built a rice mill at Kibos, in Kisumu district, capable of milling and packaging 3.5 tonnes an hour and storing 17,000 tonnes in six godowns. In 2005, the LBDA listed the Kibos mill, one of the largest in East and Central Africa, as a joint-venture opportunity in need of partners to run it on a commercial basis. As of March 2007, three potential partners had been identified: Uchumi supermar-kets, United Millers, and an unidentified American firm.
Figure II.3 Rice production in Nyanza province, in metric tonnes & KSh
18Note that the con-cerns about conserva-tion and the Nile Basin Treaty mentioned in fn. 16 above might be rele-vant here as well. There may also be land issues. On land generally, see Chapter III below.
6,855 29,460,977 62,140,000 3,250 Production Value (metric tonnes) (KSh) 8,000 80,000,000 7,000 70,000,000 6,000 60,000,000 5,000 50,000,000 4,000 40,000,000 3,000 30,000,000 2,000 20,000,000 1,000 10,000,000 2002 2003 2002 2003
Horticulture
As noted earlier (in Chapter I), horticulture exports are one of the great success stories of the Kenyan economy in recent years. They have earned foreign exchange, created employment and increased the incomes of outgrowers. A number of fruits and vegetables are produced in and around Kisumu (Table II.1 below) and many of them are sold else-where in Kenya in significant quantities. (The Millennium Village farmers in neigh-boring Siaya District have begun to diver-sify from their staple maize crop into readily grown onions, tissue culture bananas, soy and fruit trees, with domes-tic, regional and international markets in mind.) Some Kisumu area produce is also exported; for example, passion fruit is exported by East African Growers in Nairobi. A number of large companies, foreign and domestic, have expressed an interest in horticultural products from the area. Unilever is interested in sunflowers as a source of oil and is interested also in sourcing unrefined sunflower oil, chillies, fennel and rosemary from the area. Tetra Pak, a Swiss/Swedish processing, packaging and distributing multinational, has expressed an interest in the process-ing of tomatoes.
A constraint to note, when it comes to exporting, is transport and cold storage facilities. See section on Air transport in 4. The business environmentbelow.
Table II.1. Horticultural production, Nyanza province, 2005
Area planted(ha) Quantity produced(tonnes) Value(KSh million)
bananas 22,334 504,336 5,262 sweet potato … 271,514 2,000 tomatoes 6,132 120,283 2,569 onions 1,931 20,439 553 avocadoes 1,485 21,061 245 passion fruits 1,109 4,127 190 sunflower 708 434 7 soy 241 1,405 bags 5 chillies 32.5 238.5 17
Dairy
Little formal dairy production currently occurs in the greater Kisumu area. Most processed milk and other dairy products are produced in central Kenya. (But see Box II.4 below for a new milk-processing venture in Kericho.) In 2006, demand for milk in Kisumu district was 40 million litres, while production was just over 14 million litres. The province as a whole also has a large deficit in milk production.
On the other hand, dairy farms in the area appear to be doing well. Mukumu Farm near Kakamega, one of the largest in the area, operates on 65 acres with 50 mature milk cows and 40 young cows. It sells all of its milk locally and unprocessed for KSh 35 per litre, compared to a price of over KSh 50 for processed milk. The manager
of the farm believes that he would have no trouble selling more milk if he had additional production capacity and that his profits would be higher if he were using Friesian cows, which produce 50% more milk than Guernseys.19The demand for
high-quality dairy cows with well-kept records is very high, according to those interviewed by the Columbia University team. Such cows are not available in the area and can cost KSh 50,000-120,000 in central Kenya. Large numbers of cows would have to be bought abroad. Opportunities thus exist for large-scale pro-ducers and processors in this field, as well as for cattle breeders. The demand for milk is growing, and the red clay soil and rain conditions in the area are thought to be good for cattle-raising and cattle feed production.
19 As reported in Aguilo et al., 2007.
Tourism
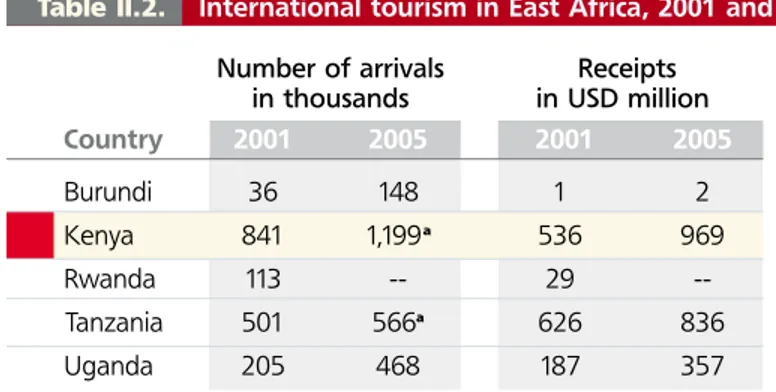
Kenya has long been the leading interna-tional tourist destination in East Africa, as is clear from Table II. 2 below.20This does
not, however, seem to have helped Kisumu. The tourists go to Mombasa for the beaches and to Masai Mara for wildlife. Although Kisumu is somewhat closer to the Masai Mara than Nairobi, the roads are not the easiest to drive on, especially when it rains. The chief local attraction, Lake Victoria, is less of a draw than it might be because of pollution and water hyacinth.
However, the government of Kenya has prioritized the western circuit in its current national development strategy and the LBDA is working on a plan for the western circuit that markets eco-tourism to
American tourists. UN Habitat is also developing a plan involving the creation of a tourist information office and the inclu-sion of Kisumu in the Kenyan tourist cir-cuit. The city has several tourist sites close by, such as the Ruma National Park (four hours from Kisumu) to the south, Ndere Island (one hour from Kisumu) to the north and Kakamega forest (one and a half hours from Kisumu) to the east. These are all relatively small sites and are more abundant in birds than in large mammals. (The wildlife draw in East Africa is the big five: lion, leopard, elephant, rhino and buffalo.)
The majority of current tourists are business people from other parts of Kenya, employees of international bodies and NGOs, and people with family links in or around Kisumu. There are currently eight
Table II.2. International tourism in East Africa, 2001 and 2005
Number of arrivals Receipts
in thousands in USD million
Country 2001 2005 2001 2005 Burundi 36 148 1 2 Kenya 841 1,199a 536 969 Rwanda 113 -- 29 --Tanzania 501 566a 626 836 Uganda 205 468 187 357
Source:Adapted from the World Bank, World Development Indicators, 2007.
aFigure for 2004.
20It does better, how-ever, on arrivals than on receipts, especially as compared to Tanzania. This is mainly because much of the tourism in Kenya is relatively inex-pensive beach tourism, as against Tanzania’s mostly high-end safari tourism.
to ten daily flights to Kisumu from Nairobi, and one opportunity for investors lies in low to mid-range hotels, of which there is a clear shortage. There may also be an opportunity in creating a conference cen-tre, with associated facilities. The LBDA is building a new headquarters complex, in which it invites investment partners. The complex is to be a 12-storey multi-use office block, shopping and conference centre, and restaurant, located on 9.3 ha of land about 6 km from the city centre. The ground floor and basement were built a few years ago but the project stalled for want of funds. Office space is in short supply in Kisumu and conference facilities could be particularly useful, given Kisumu’s central location in the East African
Community. The estimated cost of com-pleting the project is KSh 500-600 million.
At this point, domestic and regional tourism probably offers the best prospects. The increasing importance of the EAC can be expected to contribute to this.
Mayfair Holdings is a locally owned business in Kisumu. The Gilani family has been in East Africa since the early 1900s, like a number of other business families of Indian origins. The main business activities are baking, fish-processing and hospitality. The oldest operation is the Mayfair Bakery, set up by S. M. Gilani in 1966. The bak-ery was upgraded to an automated plant in 1986. Just a year earlier, in 1985, the firm had begun to diversify by building the Imperial Hotel, which remains to this day the most highly regarded hotel in Kisumu. The most recent Gilani venture (1994) is Peche Foods, a fish-processing plant that exports both frozen and fresh Nile Perch, Lake Victoria's best-known export product, to Europe, Japan, the Middle East and the United States. The reason for this last investment was the proximity of Lake Victoria. Although several other towns in Kenya's neighbours, Tanzania and Uganda, are also on the lake shore, there were no fish-processing factories outside Kenya in the mid-1990s. Today, there are 7 in Tanzania and 15 in Uganda. Of the four Kisumu facories, Peche foods is the smallest, exporting about 1,000 tonnes a year.
Mayfair is a fully family-owned business with 280 employees, 200 of them core employees and the remainder part-time and casual. The company has no expatriates working for it.
Munira Gilani, who runs Peche Foods, assesses the investor's environment as tough, especially for newcomers, but full of opportunities. There is a shortage of hotel rooms in Kisumu, for example. (Mrs Gilani is not particu-larly worried about competition for the Imperial Hotel.) The progressive integration of the East African Community is something the family sees as highly desirable. The free flow of goods and services in the region would be helpful for all the companies in the Mayfair group.
The main problems for investors in Kisumu are the poor infrastructure, especially the road to Nairobi; an excess of bureaucracy, as witness the number of licenses businesses need to operate; and corruption. For Peche Foods, there has also been another problem: the security of transport. Periodically, a truck carrying fish to Nairobi gets hijacked. (Other investors in Kisumu have also experienced this problem, although its severity varies according to the goods being transported.)
Mrs Gilani believes that what the government needs most urgently to attend to are the twin problems of infra-structure and bureaucracy. If these were addressed, there are plenty of opportunities to be exploited. Mayfair Holdings is committed to Kisumu and plans to stay, to improve and to expand. The people and the climate of Kisumu are major assets for all investors.
Source:Millennium Cities Initiative, drawing on information provided by Mayfair Holdings.