Voice Conversion Application (VOCAL)
Liliana, Resmana Lim, Elizabeth Kwan
Informatics Department, Industrial Technology FacultyPetra Christian University Surabaya, Indonesia
[email protected], [email protected]
Abstract—Recently, a lot of works has been done in speech technology. Text-to-Speech and Automatic Speech Recognition have been the priorities in research efforts to improve the human-machine interaction. The ways to improve naturalness in human-machine interaction is becoming an inportant matter of concern. Voice conversion can be served as a useful tools to provide new insights related to personification of speech enabled systems.
In this research, there are two main parameters are considered vocal tract structure and pitch. For conversion process speech is resolved in two components, excitation component and filtered component using Linear Predictive Coding (LPC). Ptich is determined by autocorrelation.
After obtained the acoustic components from source speaker and target speaker, then the acoustic components will be mapped one-to-one to replaced the the acoustic feature from source speaker to target speaker. At least, signal is modified by resynthesis so the resulted speech would perceive as if spoken by target speaker.
Keywords-Speech Processing, Audio Signal Processing, Voice Conversion, Linear Predictive Coding, Autocorrelation, PSOLA.
I. INTRODUCTION
The last few years there has been a rapid development in speech technology. The study was conducted to improve the quality of human-computer interaction. These studies have proven bringing benefits to the wider community, such as technology, Text-To-Speech (TTS), which continues to be refined, speech-to-text, for the speech recognition. Using TTS for example, will help the blind or illiterate to understand the meaning of a text on the system. Currently, speech recognition and TTS is top priority research in the field of speech technology that aimed at improving human-computer interaction. Improving the natural communication in human-computer interaction has become an important issue to be addressed. Voice conversion technology is expected to answer these problems, due to the ability associated with the personification of the speech system provided by voice conversion.
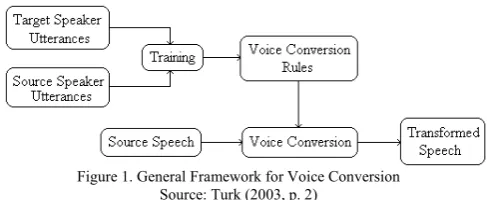
Voice conversion is a method that aims to modify someone's speech (source speaker) so as if spoken by another person (target speaker). General basic framework of voice conversion can be seen in figure 1.
Figure 1. General Framework for Voice Conversion Source: Turk (2003, p. 2)
The system gets input from the target speaker and the source speaker. From the input, the system can take some voice characteristics such as pitch, vocal tract parameters, and speed, which then through a process of transformation will be converted into outputs (transformed speech). The ability to change characteristics of a speaker's voice can be applied in many fields, for example, in the field of voiceover (dubbing). Moreover, it can also be used to produce regenerated voice of the actress / actor who had died or who had lost his beautiful or young voice because of age. The other application, it can be used to produce sound actress / actor in certain other languages which are not spoken by actress / actor. In addition to the field of voiceover, voice conversion technology can also be used to develop speech processing technologies, such as Text-To-Speech (TTS), e-mail readers, Interactive Voice Response (IVR), and others.
Generally, a TTS system can only generate the sound of several speakers. This is due to the high costs required to enrich the database of the voice on the TTS system and the time needed to record and process the sound from each speaker. Voice conversion can be used to generate a new voice for TTS system without the need to conduct a long process. Several studies have been developed to overcome the problems of using voice conversion in TTS, some of the researcher are Bob Dunn (2003), A. Cain and M. Macon (1998a), A. Cain and M. Macon (1998b), as well as C.M. Ribeiro and I.M. Trancoso (1997).
to the structure of vocal tract and pitch range owned. Vocal tract and pitch is called static speech parameters, the parameters in which the speaker has limited control (Mecwan, et al., 2009).
II. VOICE CONVERSION
There are many methods that can be used in voice conversion. This raises the difficulty to obtain the optimal method for all possible combinations of characteristics and speakers (Turk, 2003). Different voice conversion system can use different methods, but at least most of the system consists of several components such as methods to represent the specific characteristics of the speakers, method to map the characteristics of the source and target, methods to transform the source characteristics of speech.
A. Digitization of Sound
Sound is wave include the macroscopic and involve air molecules are pressed and expanded under the action of some physical equipment. For example, in an audio speakers vibrating system, wave vibrates back and forth and produce longitudinal pressure which we accept as sound (Li & Drew, 2004). Sound has a continuous value, in contrast to digital sound which has a limited range. So, wanting to use digital versions of sound waves, it takes the form of a digital representation of audio information.
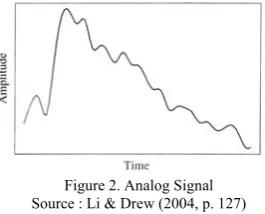
Figure 2. Analog Signal Source : Li & Drew (2004, p. 127)
Figure 2 shows the nature of one-dimensional sound. Change the value from time to time in the amplitude, the pressure increases or decreases over time. Fully digitize the signal samples needed in each dimension in time and in amplitude, sampling and quantization respectively.
Sampling means measuring the quantity, usually at a uniform distance. Sampling is done on the time basis. Sampling rate means the number of sample taken at a distinct time. For audio, the sampling rates range from 8 kHz (8000 samples per second) to 48 kHz. The sample taking based on the amplitude or voltage dimension referred to quantization. Quantization rates generally range between 8-bit to 16-bit, 8-bit quantization divides the vertical axis into 256 levels, and 16-bit divide it into 65,536 levels.
Resampling is a process to change the sampling rate of the signal which aims to improve the efficiency of various signal processing operations. Down-sampling is intended to reduce the sampling rate, while up-sampling is intended to increase the sampling rate (Toivonen, 2009). The algorithm used to improve the precision of the resampling method is sine interpolation (Boersma, 2001). This algorithm assumes that the signal is the sum of sine functions. Because of the limitation of the depth interpolation, the sum will be multiplied by Hanning window. Hanning window can be calculated using equation 1 until 6
( )
s
;
floor
s
l≡
(1)1
+ ≡ l
r s
s (2)
l l
≡
s
−
s
ϕ
(3)l
r
ϕ
ϕ
≡
1
−
(4)( ) ( ( ))( ( ( ) ( )))
( )
( )( ( ( ) ( )))
∑
=∑
+= −
+ − + +
− + +
+ − + +
− + ≈
N
i li r r r
N
i ri l l l
N i
i c y
N i
i c y s
y
... 1
... 1
/ 1 cos
2 / 1 2 / 1 1 sin
/ 1 cos
2 / 1 2 / 1 1 sin
ϕ ϕ
π ϕ
π
ϕ ϕ π ϕ
π (5)
where sine function is defined as :
( )
0
1
;
sin
( )
sin
/
0
sin
c
≡
c
x
≡
x
x
for
x
≠
(6)B. Deconvolution
Speech is a convolution between the source x(t) with input to the filter response h(t). To analyze the signals so that obtained characteristics of the output y(t), it requires a process to separate the signals so that they can be analyzed individually. Separation process is called deconvolution (see Figure 2). In this study, we used Linear Predictive Coding (LPC) to do the deconvolution process.
Figure II. Deconvolution System to Separate a Complex Signal Source : Upperman (2008, p.5)
LPC method is chosen based on computational efficiency (Mecwan, et al., 2009). LPC is a method used to predict samples from the speech signal through several previous samples. LPC coefficients can be used to divide the speech signal into two parts, transfer function and excitation. N-th sample can be predicted from the sequence of samples which represented the weighted sum of p previous samples. :
∑
=
−
=
pk
k
s
n
k
a
s
1
]
[
ˆ
(7)due to the need for error signal e[n], also called LPC residuals, see equation 8
∑
=
−
−
=
−
=
pk
k
s
n
k
a
n
s
n
s
n
s
n
e
1
]
[
]
[
]
[
ˆ
]
[
]
[
(8)The error signale[n] can be proccedusing z-transform, see equation 9.
∑
∑
= =
−
− =
⎥ ⎦ ⎤ ⎢
⎣ ⎡
− = −
= p
k
p
k k k k
kS z z S z a z S z Az
a z S z E
1 1
) ( ) ( 1
) ( ) ( )
( )
( (9)
Thus, we get a representation of error signal E(z) as the product of original signal S(z) with transfer function A(z). The spectrum of error signal E(z) will have a different structure depended on whether the sound sources including voiced or unvoiced.
When LPC coefficients are computed successfully, these coefficients can be used to calculate the error signal e(n). Implementation where s(n) as input and e(n) is called the Speech Analysis results Filter (Park, Sung-won, 2007), as shown in figure 3.
Figure 3. Speech Analysis Filter Source: Park (2007, p. 7)
Where A(z) is defined as:
( )
∑
= − −
= M
i i iz a z
A
1
1 (10)
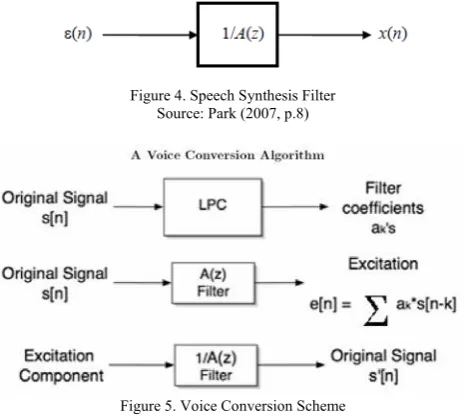
While the implementation which uses error signale(n) as input and s(n) as output is called Speech Synthesis Filter, as shown in figure 4. Figure 5 will illustrate how the LPC applied on the voice conversion system
Figure 4. Speech Synthesis Filter Source: Park (2007, p.8)
Figure 5. Voice Conversion Scheme Source: Upperman (2008, p.16)
A(z) is the transfer function between the original signal S(n) and the excitation component e(n). Transfer function of the speech signal is the part that relates to sound quality, which distinguishes the sound of one person with another person. Meanwhile, the excitation component of speech signal is the part that relates to certain sounds and words produced. As shown in Figure 5, we can put into the original signal filters to obtain excitation component. Leaving the excitation component into the inverse filter (1 / A (z)) allows to get the signal origin.
C. Pitch Period Computation
According to Dunn (2003), pitch detection has always been a complex issue in speech processing. Several algorithms for detecting pitch proposed are context-specific algorithm, can only work well for certain cases. This requires a combination of approaches to detect the pitch of the voice. This method basically uses Autocorrelation of Voiced or unvoiced detection.
Mecwan (2009) stated that the pitch needed to detect the signal with a window for at least two times the length of the period that may arise. At first, do check whether the window is included Voiced or not, this is done by comparing the average energy of the window with a threshold. According to Boersma(2001), there two main processes that need to be obtained to calculate the pitch period. These processes are pitch analysis and glottal pulses calculation.
This pitch analysis algorithm is based on autocorrelation method (Boersma, 1993). The algorithm is describe as following:
Step1. Is a preprocessing step to eliminate the sidelobe of the Fourier transform using a Hanning window on the signal coming close to the Nyquist frequency.
absolute peak of less than 0.05 times the absolute global peak.
Step3.4. Multiplied by the window function, see equation 11
( )
t
x
t
T
t
w
( )
t
a
mid x⎟⎟
⎠
⎞
⎜⎜
⎝
⎛
−
⎟
⎠
⎞
⎜
⎝
⎛
−
+
=
μ
2
1
(11)Step3.5. add ‘0’ (zero) as many as the window length. This process is done because the interpolation needs autocorrelation value at least half of the window length. Step3.6. add ‘0’ (zero) until the number of the sample reaches a power of two multiplication.
Step3.7. do Fast Fourier Transform using equation 12
( )
=
∫
( )
−dt
e
t
a
a
~
ω
iωt(12)
Step3.8. Square the sample on frequency domain.
Step3.9. do Inverse Fast Fourier Transform using equation 13
( )
=
∫
( )
π
ω
ω
τ
ωτ2
~
2d
e
a
r
a i(13)
Step3.10. then divide by autocorrelation from computed window from step 3.5 until 3.9 as shown in equation 14
( )
( )
( )
τ
τ
τ
w a xr
r
r
≈
(14)
Step3.11. find the position and the continue maxima value from
r
x( )
τ
using algorithm brent (Press 1992). Themaxima position is laid between minimum and maximum pitch. While the maximum pitch must be laid between the minimum pitch and Nyquist frequency. Local strength for unvoiced candidate can be written as equation 15
( ) ( ) ( ) ⎟⎟⎠⎞ ⎜⎜ ⎝ ⎛ + − + ≡ eshold VoicingThr eshold SilenceThr peak absolute global peak absolute local eshold VoicingThr R 1 / / 2 . 0 max (15)
And voiced candidate with highest local strength, can be calculated using equation 16.
( )
(
max)
2
max
log
τ
τ
−
⋅
⋅
≡
r
OctaveCost
MinimimPit
ch
R
(16)
OctaveCost parameters intended to produce a better fundamental frequency. From all the periodic signals which have peak with the same height, will be selected the lowest lag. Value for OctaveCost is default by 0.01 for the criterion of 10% (square of 10%).
After repeating the process above, will be taken several pairs of frequency and strength (Fni, Rni), where n is the
index for the frame (from 1 to number of frames) and i is the index for candidate number (from 1 to the number of candidates). The best candidate from each frame (locally best candidate) is the candidate with the highest R value. But there is possibility where there are equally strong candidates in some frames. Therefore, it required a step to select the global path finder (described in step 4). This is intended to minimize the amount of incidental
Voiced-unvoiced decision and a big jump frequency. Step 4. For each frame n, pn is a number from 1 to the
number of frame candidates. Where { pn | 1 ≤ n ≤ number of
frames} defines a path through the candidates: {(Fnpn, Rnpn)|
1 ≤ n ≤ number of frames}. With all the possible paths, cost can be defined using equation 17.
{ }
(
)
∑
(
)
∑
= − =
− =numberOfFrames −
n ames numberOfFr n np np p
n n F n R n
F Cost transition pn t 2 1 , 1 , cos 1 (17)
Where transition cost function is defined as equation 18.
( ) 0 0 0 0 0 0 log 0 , 2 1 2 1 2 1 2 1 2 2 1 ≠ ≠ = = = = ⎪ ⎪ ⎩ ⎪ ⎪ ⎨ ⎧ ⋅ = F and F if F xor F if F and F if F F ost OctaveJumC icedCost VoicedUnvo F F Cost transition (18)
There is a possibility VoicedUnvoicedCost and OctaveJumpCost have same value, 0.2 The globally best path is the path with least cost.
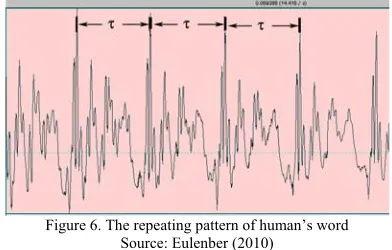
The second process of pitch period computation is glottal pulses calculation. If a human word is represented in time domain, then the perodic pattern of voiced sound, such as voiced obstruents ([b], [d], [g]), sonorant consonants ([n], [m], [l]) and all vowels will be found, as shown in figure 6 (Eulenberg, John, 2010).
Figure 6. The repeating pattern of human’s word Source: Eulenber (2010)
Every pattern identified repeatedly is called cycle. The duration of each cycle called the glottal pulse or the pitch period length (τ in Figure 6). The purpose of this step is to take advantage of the pitch contour information which has been produced before, to put the glottal pulses. Number of points (or glottal pulses) is determined by the following algorithm:
Step1. The first point t1 is ablsolute extremum value of the
amplitude, whose value is between tmid-T0/2 and tmid+T0/2,
where tmid is the midpoint of the interval, and T0 is the
period in tmid, which can be obtained from the pitch contour
interpolation.
Step2. From the first point, search the points ti until reach
left end of the interval. Points must be between ti-1 – 1.2 T0
(ti-1) dan ti-1 – 0.8 T0 (ti-1).
Step3. do the same as Step 2 for the right side of ti, the
eliminated if the correlation value was less than 0.3. However, points can be added at the end of the interval if its correlation value greater than 0.7.
D. Transformation
After going through the processes mentioned above (analysis phase), it will get the parameters of the speaker source. This parameter is mapped so that the combination can produce sound from the speaker's purpose. Some important parameters (speech parameters), among others are Voiced / unvoiced flag, filter coefficient (target), the mean value of gain (target), source pitch, the target pitch. Speech parameters were used to reconstruct the output so that sounds like the target speech.
Pitch-Synchronous Overlap and Add (PSOLA) is a method used to manipulate the pitch of a speech signal so that it matches the pitch of the target speakers. Basic algorithm of PSOLA consists of 3 stages (Upperman, Gina, et al., 2008).
First stage, the speech signal is divided into several smaller signals and overlap each other. This is obtained by windowing around the "pitch mark" or peak amplitude (peak ampitude) from the first signal (original signal). Windowed segments (the part that has been through a process of windowing) usually consist of two to four pitch periods.
The second phase, small signals are repeated or modified in a way removed from the speech segments, depending on the pitch of the target speakers, whether higher or lower than the pitch-source speakers. This resulted in a modified duration of the signals that lead to fundamental changes in frequency.
The last stage, the remaining segments combined by overlapping and re-adding. The result is a signal with the same spectrum with the original but with a different fundamental frequency. Thus, the pitch of his voice changed, but the quality remains the same.
III. PROBLEM ANALYSIS
The complexity of human language is one of the difficult problems faced in making this voice conversion application. When a man speaks, the air exhaled from the lungs and then through the mouth and nasal cavity. Air flows out through the mouth, restricted and manipulated by the tongue and lips. This manipulation process produce contraction and expansion against the airflow released, the acoustic waves called sound.
However, a set of a voice series alone can not form words and sentences. In a speech, it has useful information, such as rhythm, intonation and emphasis that indicate grammatical structure, or also an emphasis on certain words to indicate the level of interest, and others. The information can be different from one person to another. Variations in speech style are not limited to the increasing complexity of
making this application, especially at the voice segmentation process.
In addition there is also the speaker variability (diversity of speakers). Every person has a unique voice. But the sound produced by a single person can also vary. Therefore, variations in sound can be classified based on the actual pronunciation (the same word can be pronounced in different ways; is never exactly the same when viewed from the acoustic wave), speaking style, gender, vocal tract anatomy, speaking rate, dialect, etc.
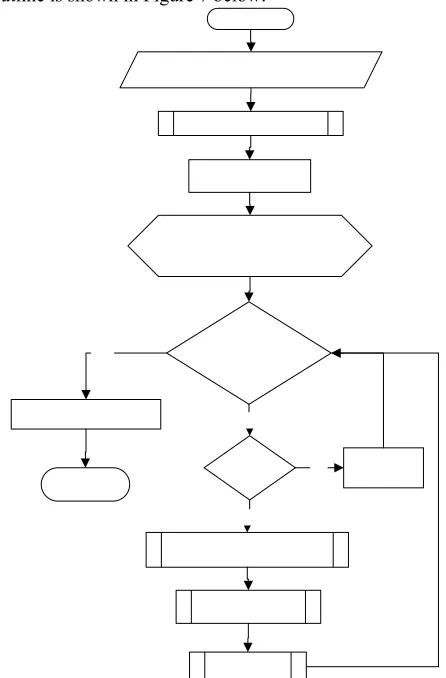
The design of the application of voice conversion system outline is shown in Figure 7 below:
Figure 7.Flowchart of Vocie Conversion System
IV. EXPERIMENT
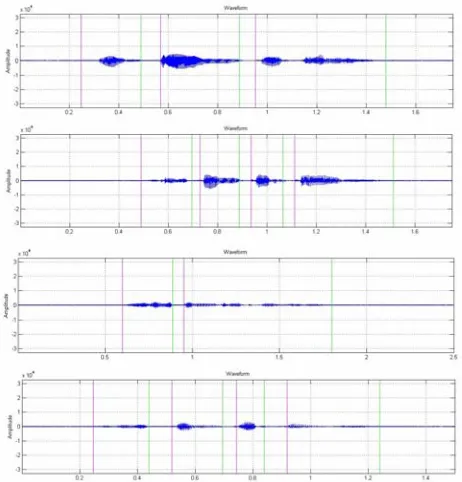
marks the beginning of the segment, and light green line marks the end of the segment.
Figure 8. Segmentation result for word “hai” from four speakers. From above: (a) Kath (b) Liz (c) Will (d) Zefan.
The experimental result for word with one syllable of four speakers, shows the succesfulness of thi application. Then, we also test more complex words, “Sistem Cerdas”. The segmentation result can be seen in figure 9.
Figure 9. Segmentation result for word “Sistem Cerdas” from four speakers, from above: (a) Kath (b) Liz (c) Zefan (d) Will
Results for the pronunciation of more complex words, "Sistem Cerdas" provides different results for different speakers, the success rate of 50% for the experiment above. This is related to the diversity of speakers or so-called speaker variability. Diversity is what causes the speaker system is difficult to segment accurately.
B. Experiment on Pitch Similarity Between Simulated Speaker and Target Spreaker
Here is a test to find out how close the pitch of the sound produced by the application with the sound of the source speaker and target speaker.
Table 1. Comparison of Pitch Calculation
Source Target No word
Speaker Freq
(Hz) Speaker
Freq (Hz)
Converted Freq (Hz)
1 Good Kath 242.0417 Liz 266.9492 263.1579 2 Hai Kath 227.0855 Zefan 176.259 172.4138 3 Saya Liz 259.1069 Will 170.1389 172.4138 4 Hallo Zefan 162.0132 Liz 100.1817 100 5 A Will 151.4423 Zefan 191.5725 188.6792
Table 2. The Percentage of Pitch Calculation
No word Target
Freq (Hz)
Converted Freq (Hz)
1 Good 266,9492 263,1579 2 Hai 176,2590 172,4138 3 Saya 170,1389 172,4138 4 Hallo 100,1817 100,0000
5 A 191,5725 188,6792
Pitch of the sound produced by this application is approximate the pitch of the target speakers, although not exactly the same. From the comparison of the rates can be seen that the pitch modification is quite successful (the average percentage of success of 98.67%).
V. CONCLUTION
Based on the experiments result, we can conclude some of the following:
• The segmentation result is good enough to detect syllable in certain words, depend on the input which can be vary widely.
• Segmentation successfulness is depended on the length of utterance. The longer the utterance, the lower the success rate will be.
• The result of segmentation will affect the whole process of voice conversion. A good segmentation will produce good result.
• Modify the pitch gives good results. This is proven by the average percentage, 98.67% as shown on table 2.
REFERENCES
Boersma, Paul. (1993). Accurate Short-Term Analysis of Fundamental Frequency and the Harmonic-to-Noise Ratio of Sampled Sound. Proceedings of the Institue of Phonetics Sciences 17: 97-110. University of Amsterdam.
Boersma, Paul. (2001). Praat, a system for doing phonetics by computer. Glot International.
Dunn, Bob. (2003). Speech Signal Processing and Speech Recognition.
IEEE Signal Processing Society.
Eulenberg, John. (2010). Fundamental Frequency and the Glottal Pulse. Retrieved May 22, 2010, from
https://www.msu.edu/course/asc/232/study_guides/F0_and_Glotta l_Pulse_Period.html
Jyh-Shing Roger Jang. (2009). Audio signal processing and recognition. Retrieved February 11, 2010, from
http://neural.cs.nthu.edu.tw/jang/books/audioSignalProcessing/. Jyh-Shing Roger Jang. Speech and audio processing toolbox. Retrieved
February 11, 2010, from http://mirlab.org/jang.
Kain, A. dan Macon M. (1998a). Spectral Voice Conversion for Text-To-Speech Synthesis. IEEE ICASSP 1998.
Kain, A. dan Macon M. (1998b). Text-To-Speech Voice Adaptation from Sparse Training Data. ICSLP 1998.
McClellan, James, dkk. (1998). DSP First: A Multimedia Approach. Prentice-Hall, Inc., New Jersey.
Mecwan, Akash, dkk. (2009). Voice Conversion Algorithm. International Conference on Advances in Computing, Communication and Control 2009.
Milosevic, Branislava. Multimedia Training Kit: Introduction to Digital Audio Handout. Retrieved January 13, 2010, from
http://www.itrainonline.org/itrainonline/mmtk/audio.shtml.
Park, Sung-won. (2007). Chapter 7 Linear Predictive Speech Processing. Retrieved January 16, 2010, from
http://www.engineer.tamuk.edu/spark/chap7.pdf.
Patton, Joshua. (2007). Pitch Synchronous Overlap and Add (with Formant Preservation). Retrieved May 11, 2010, from
http://www.ece.uvic.ca/~jpatton/yeshua1984/Elec484/Elec484.htm l
Pelton, Gordon E. (1993) Voice processing. McGraw-Hill, Inc. Press, William H., dkk. (1992). Numerical Recipes in C. Cambridge
University Press.
Rabiner, Lawrence dan Biing-hwang Juang (1993). Fundamentals of Speech Recognition. Prentice Hall, Inc., New Jersey. Ratana, Dhany Surya. (2009). Komparasi Kompresi Audio AAC dengan
MP3. ITT TELKOM. Retrieved January 11, 2010, from
http://www.ittelkom.ac.id/library/index.php?view=article&catid=1
8:multimedia&id=492:audio-extension-wav-mp3-aac&option=com_content&Itemid=15.
Ribeiro, C.M. dan I. M. Trancoso. (1997). Phonetic Vocoding with Speaker Adaptation. Eurospeech 1997, Rhodes, Greece.
Turk, Oytun. (2003). New Methods for Voice Conversion. M.S Thesis. Toivonen, Hannu T., (2009). Chapter 2. Multirate Digital Signal
Processing. Retrieved May 25, 2010, from
http://users.abo.fi/~htoivone/courses/sbappl/asp_chapter2.pdf. Upperman, Gina, dkk. (2008). Methods for Voice Conversion. Retrieved
May 20, 2009, from http://cnx.org/content/col10252/1.2/ .
Wikipedia the Free Encyclopedia. (2009). Mean Opinion Score. Retrieved October 17, 2009, fro
http://en.wikipedia.org/wiki/Mean_opinion_score
Wilson, Scott. (2003). WAVE PCM File Format. Retrieved January 11, 2010, from
https://ccrma.stanford.edu/courses/422/projects/WaveFormat/. Ze-Nian Li dan Mark S. Drew. (2004). Fundamentals of multimedia. Upper