The 23
rdInternational Conference on Production Research
Product Quality as Competitive Priority: Its Relationship
with Total Quality Management Implementation in
Indonesia
Didik Wahjudi
a,b*, Moses L. Singgih
a, Patdono Suwignjo
a, Imam Baihaqi
aaSepuluh Nopember Institute of Technology, Kampus ITS Keputih Sukolilo, Surabaya 60111, Indonesia bPetra Christian University, Jl. Siwalankerto 121-131, Surabaya 60236, Indonesia
Abstract
Literature has widely reported the increase of firms’ competitive advantage resulted from better product quality. However, in some industries product quality does not escalate competitive advantage significantly. Competitive priority stemmed from product quality is presumed to be the driving factor of Total Quality Management (TQM) implementation. This study investigates how product quality as competitive priority influences the implementation of TQM. The results explain the divergence of TQM implementation among manufacturing firms. Empirical data from 152 manufacturing firms in Indonesia are analyzed using structural equation modeling (SEM). The results indicate that product quality as competitive priority affects TQM implementation positively. In addition, the structural model shows that the relationship between product quality as competitive priority and firm performance is fully mediated by Total Quality Management. The contribution of this study is providing explanation why some firms are more receptive toward Total Quality Management than the others. The strong positive relationship between Total Quality Management and firm performance suggests that, whether the manufacturing firms have product quality as their competitive priority or not, they need to recognize the impact of Total Quality Management on firm performance.
Keywords: product quality as competitive priority, total quality management, firm performance, structural equation modeling, manufacturing, Indonesia, empirical study
1.Introduction
Many authors have identified the role of product quality as competitive advantage [1-4]. Calingo [1] argues that product quality has stronger impact on market share compared to price. Kroll, et al. [2] identify that product quality indirectly improves returns and at the same time it reduces variance in returns. Lakhal [3] claims that higher product quality has direct impact on competitive advantage, which in turn results in better organizational performance. Shetty [4] reports that product quality
improves profitability by reducing costs, boosting sales, and elevating firms’ competitiveness. However, Porter [5] identifies some situations where product quality does not have much impact on competitive advantage. Therefore, the incentive of implementing TQM is abolished. While many manufacturing firms implement TQM in order to obtain better competitive advantage, little is known about the impact of product quality as competitive priority on TQM implementation. This study aims to confirm the relationship between product quality as competitive priority and the TQM implementation. This knowledge is important to explain the differences in level of TQM implementation among
Indonesia’s manufacturing firms. A survey on 152 managers and directors of manufacturing firms in Indonesia is conducted to explore this relationship. A two-step structural equation modeling proposed by Anderson and Gerbing [6] was utilized. The remaining of this paper is structured as follows. In the next section we provide literature review on total quality management, product quality as competitive priority, firm performance and the relationship among them that leads to the development of our
research hypotheses. The third section describes the research design in this study. The data analysis and discussions of results are presented in the fourth section. Finally, conclusions, limitations, implications, and recommendation for future research are provided in the last section.
2.Literature Review
2.1.Total Quality Management
The history of TQM in US is triggered by the flood of Japanese automotive and electronics products in US market [7]. Japan's economic revival, caused by their industries’ ability to offer high quality products at cheaper price [8], gives a serious challenge to the dominance of US firms [9]. TQM implementation by Japanese companies is claimed to generate this competitive advantage [10]. To reclaim its economic dominance that is captured by Japanese firms, US companies start to adopt TQM [9, 11]. Since then, TQM has been considered as a part of strategy implementation [12], a competitive advantage-providing management model [13], and one of the most renowned and most frequently recommended efficiency and competitiveness-improving approaches [14]. In addition, TQM is identified to improve various performance measures such as operational performance [15, 16], quality performance [17, 18], financial performance [16, 19], sales performance, customer satisfaction [16, 19], employee satisfaction [16, 20], R&D performance [18, 21], innovation performance [22, 23], and overall business performance [18, 24]. Not only that TQM creates competitive advantage but it also generates sustainability [25].
Many authors offer definitions for TQM. TQM is described as a set of systematic activities [26], management philosophy [27, 28], and strategy [12, 29]. Thus, it can be summarized that TQM is a management philosophy and systematic continuous improvement activities across the organization to provide quality products and services that satisfy customers. However, there is still disagreement in what TQM constitutes of. Some authors argue that TQM is unidimensional [30-33], while most authors consider it to be multidimensional [34-37]. Several studies to develop TQM constructs come up with different number of constructs. Flynn, et al. [38] and Grandzol and Gershon [39] propose seven constructs. Powell [10] come up with eight constructs, while Black and Porter [40], Zhang, et al. [41], and Saraph, et al. [42] identify ten, eleven, and twelve constructs, respectively.
TQM framework developed by Samson and Terziovski [43] are adopted in this study. It has six constructs as in the MBNQA, i.e. leadership, strategic planning, customer focus, information and analysis, people management, and process management. However, supplier relationship is augmented to this framework because these seven practices are the most widely studied along with continuous improvement [44]. These seven constructs satisfy the following criteria recommended by Arumugam, et al. [45]:
Have been identified as the core practices in manufacturing and service sectors
Include both hard and soft quality management practices
Incorporate reputable quality award criteria such as MBNQA and European Quality Award.
However, continuous improvement is not measured separately in this study because it is the spirit of TQM and should be demonstrated by all practices as stated by Black and Porter [40], Flynn, et al. [38], Powell [10], and Saraph, et al. [42]. The seven constructs in our study are leadership, strategic planning, customer focus, information and analysis, supplier relationship, people management, and process management. The description of each construct is given as follows.
Leadership measures the clarity of vision [46], establishment of quality objectives [42], allocation of resources for quality improvement [47], commitment and creation of continuous learning culture [46], management evaluation based on quality performance [42], and creation of trusting, involving, and committing culture to achieve best practice [43].
Strategic planning evaluates how companies develop and communicate mission statement, develop quality-oriented long term and short term plans, measure their progress toward those objectives, and incorporate needs of stakeholders in developing plans, policies and objectives [43].
Customer focus emphasizes on utilization of customer requirements to develop new products, effective dissemination and understanding of customer requirements by all employees, development of effective procedure to solve customer complaints, utilization of customer complaints to improve current process, systematically and regularly measure external customer satisfaction, and commitment to improve customer satisfaction [43].
information display of quality performance for employees [38], information display of productivity for employees [38], and calculation of quality costs to support improvement priority [40, 47].
Supplier relationship examines the establishment of long term partnerships with suppliers [38], emphasis on quality in supplier selection rather than price or schedule [38, 42], provision of training and technical assistance to suppliers [42, 47], regular evaluation of suppliers [47], and supplier involvement in new product design [38].
People management focuses on provision of training on quality for supervisors and managers [42], provision of problem-solving skills and basic statistical techniques to all employees [10, 42], provision of incentives for quality improvement ideas [38], recognition and reward for superior quality performance [42], team formation to solve problems [38], ability to work in a team as a criterion in employee selection [38], regular measurement of employee satisfaction [43], and
effective ‘top–down’ and ‘bottom–up’ communication processes [43].
Process management evaluates design and management of process to provide quality product [46], attention to producibility during product development [42], employees’ responsibility to inspect their own work [42], development of attitude that prevents defective products [42], site-wide standardized and documented operating procedures [43], and emphasis on continuous improvement on product, service, and process [10].
2.2.Product quality as competitive priority
As market becomes more global, the need for competitive advantage is increasingly critical. Competitive advantage is defined as the ability of an organization to create a sustainable defensible position over its competitors through value creation for its customers [35, 48]. Reed, et al. [25] identify two competitive advantage model, the market-based model and the resource-based model. In the market-based model, by choosing either the cost leadership or differentiations strategy, firms excel in the competition because they are efficient or able to offer products for which consumers are willing to pay at a higher price. The second model emphasizes on the firm's unique resources that give operational excellence or allow the firms to be in the prime market position.
Many companies improve the quality of their products and services in order to gain competitive advantage and to enhance their organizational performance. In addition to product quality, firms rely on innovation, distribution, price, flexibility, product variety, and delivery to increase their competitive advantage [3, 49, 50]. Product quality is widely reported as the direct outcome of Total Quality Management (TQM) implementation, which in turn generates superior firm performance [18]. However, there are situations in which high product quality does not provide competitive advantage. Porter [5] argues that product quality loses its competitive advantage when the product is undifferentiated. This applies to both industrial customers and individual consumers. Industrial customers will be very price sensitive if the product they purchase does not affect the quality of their own product [5]. Similarly, if it deals with commodity products, individual customers make their decisions based solely on price [51]. They consider product quality has little impact on its usage. Moreover, Hill [51] claims that this situation occurs not only to commodity products but also to high added value products.
2.3.Research hypotheses
From the above conflicting situations we define product quality as competitive priority to be the leveraging effect of product quality on the competitive advantage of an enterprise. While literature identifies firms implementing TQM to improve product quality and other organizational performance measures [3], we argue that product quality as competitive priority (PQCP) plays as the driving factor of TQM implementation. In other words, if the level of product quality as competitive priority is high, then firms will implement TQM more intensively. In this case, there are three hypotheses that we want to examine. The three hypotheses are described as follows.
H1: Product quality as competitive priority is positively correlated with TQM implementation.
H2: Product quality as competitive priority is positively correlated with firm performance.
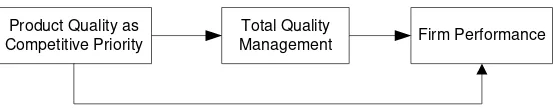
H3: TQM implementation mediates the relationship between product quality as competitive priority
and firm performance.
Firm Performance Product Quality as
Competitive Priority
Total Quality Management
Fig. 1 Theoretical framework of relationship among product quality as competitive priority, TQM, and firm performance
Previous studies link product quality as competitive priority to market position/market share [1, 2, 4, 52], price [52], profitability [2, 4, 53], and market value [53]. In this study we measured product quality as competitive priority by its ability to improve market share, price, profitability, and market value.
Several studies report the use of perceptual data as their research limitation especially on firm performance. To cope with this problem we followed the recommendation from Agus et al. [54] and Tari et al. [16] that suggests the use of relative company's performance compared to its competitors. Realizing that only financial performance and sales performance are available for public use, we utilized return on assets (RoA), earnings before interest, taxes, depreciation, and amortization (EBITDA), sales growth, and market share as firm performance indicators in this study.
3.Methodology
3.1.Sample and Procedures
Our survey was conducted on managers and directors of manufacturing firms in Indonesia. Lack of access to Indonesian manufacturing database prompted us to adopt purposive sampling. We invited prospective respondents to participate via emails. Google Docs application was used to administer the online survey. Every email was monitored to ensure one company was represented by only one respondent. Managerial level staffs were selected to ensure they were knowledgeable about the subject. Unit of analysis was at strategic business level, in which a firm with more than one location would be considered as one unit.
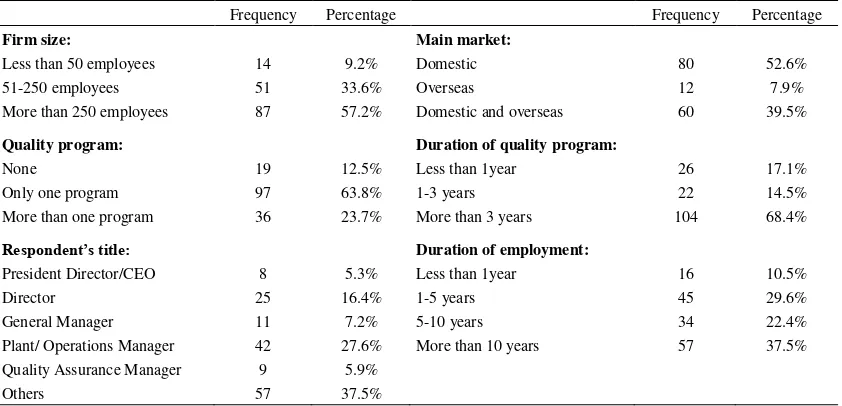
505 prospective respondents were invited, but only 152 respondents completed the survey, resulting in a response rate of 30%. Out of 20 standard industrial classification (SIC) classes assigned to manufacturing industry [55], all classes were represented in the survey. The top four represented classes were food industry (19.1%), chemicals industry (17.8%), rubber & plastic industry (11.8%), and fabricated metal industry (10.5%). Demography of participating firms and their respective respondents is given in Table 1. More than 90% of respondents represented medium–sized (51-250 employees) and large-sized firms (more than 250 employees). A little over 50% of the surveyed firms served only domestic market, while the remaining firms supplied overseas and both overseas and domestic markets. Almost 90% of firms had at least one quality program in place. Nearly 70% of them had applied quality programs for 3 years or longer. About 50% of respondents were president directors, directors, general managers, or plant managers. The remaining served as QA managers, finance managers, production managers, or PPIC managers. Around 60% of respondents worked in the company at least 5 years. Only 10% of respondents just joined the company in less than one year. This lack of long service was compensated by high position they served, which required quick adaptation to the new work environment.
3.2.The questionnaire
constructs, firm performance, and product quality as competitive priority, where 1 = strongly disagree and 5 = strongly agree.
Table 1 Demography of the surveyed firms and respondents
Frequency Percentage Frequency Percentage
Firm size: Main market:
Less than 50 employees 14 9.2% Domestic 80 52.6%
51-250 employees 51 33.6% Overseas 12 7.9%
More than 250 employees 87 57.2% Domestic and overseas 60 39.5%
Quality program: Duration of quality program:
None 19 12.5% Less than 1year 26 17.1%
Only one program 97 63.8% 1-3 years 22 14.5%
More than one program 36 23.7% More than 3 years 104 68.4%
Respondent’s title: Duration of employment:
President Director/CEO 8 5.3% Less than 1year 16 10.5%
Director 25 16.4% 1-5 years 45 29.6%
General Manager 11 7.2% 5-10 years 34 22.4%
Plant/ Operations Manager 42 27.6% More than 10 years 57 37.5%
Quality Assurance Manager 9 5.9%
Others 57 37.5%
4.Results and Discussions
Analysis began with conducting screening for missing data. Screening on the raw data revealed there was no missing data. In the next step, we conducted outlier detection. In this case, only univariate and multivariate outliers screening were conducted because the large number of variables made it cumbersome to perform bivariate outlier detection [56]. For a sample size greater than 80, Hair, et al. [56] recommend cases with z value of more than 4.0 to be considered outliers. Following this recommendation, cases #72 and 139 were identified as univariate outliers. During the confirmatory factor analysis (CFA), multivariate outliers were assessed using Mahalanobis distance (D2) divided by the number of variables. We adopted a conservative p-value of 0.001 as recommended by [56] to identify multivariate outliers. This assessment detected four cases (#47, 81, 124, and 132) to be multivariate outliers and removed from further analysis.
Two-step approach recommended by Anderson and Gerbing [6] were used in this study. In the first step, we developed measurement models, i.e. product quality as competitive priority, firm performance, first-order model of TQM, and second-order model of TQM. Second-order model of TQM was developed by using factor scores obtained from the first-order TQM model. In the second step, we developed structural models to examine the relationship among product quality as competitive priority, TQM, and firm performance.
4.1.Measurement model
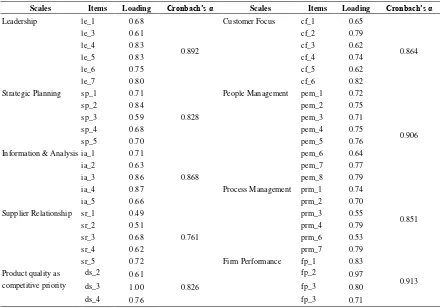
Table 2 Scale validity and reliability for TQM constructs, firm performance, and product quality as competitive priority
Scales Items Loading Cronbach’s α Scales Items Loading Cronbach’s α
Leadership le_1 0.68
0.892
Customer Focus cf_1 0.65
0.864
le_3 0.61 cf_2 0.79
le_4 0.83 cf_3 0.62
le_5 0.83 cf_4 0.74
le_6 0.75 cf_5 0.62
le_7 0.80 cf_6 0.82
Strategic Planning sp_1 0.71
0.828
People Management pem_1 0.72
0.906
sp_2 0.84 pem_2 0.75
sp_3 0.59 pem_3 0.71
sp_4 0.68 pem_4 0.75
sp_5 0.70 pem_5 0.76
Information & Analysisia_1 0.71
0.868
pem_6 0.64
ia_2 0.63 pem_7 0.77
ia_3 0.86 pem_8 0.79
ia_4 0.87 Process Management prm_1 0.74
0.851
ia_5 0.66 prm_2 0.70
Supplier Relationship sr_1 0.49
0.761
prm_3 0.55
sr_2 0.51 prm_4 0.79
sr_3 0.68 prm_6 0.53
sr_4 0.62 prm_7 0.79
sr_5 0.72 Firm Performance fp_1 0.83
0.913 Product quality as
competitive priority
ds_2 0.61
0.826
fp_2 0.97
ds_3 1.00 fp_3 0.80
ds_4 0.76 fp_3 0.71
CMIN/DF = 1.665, CFI = 0.989, RMSEA = 0.068 Fig. 2 Second-order measurement model for TQM
4.2.Structural Model
weight between PQCP and TQM was 0.42. Thus, the first hypothesis that claimed the existence of positive correlation between product quality as competitive priority and TQM was verified. The final structural model is shown in Fig. 3. (a).
The second structural model was developed to test the second hypothesis, i.e. the existence of positive correlation between product quality as competitive priority and firm performance. First-order measurement models of PQCP and firm performance were utilized to develop the structural model. The inclusion of firm size, main market, and quality program as control variables did not influence to model significantly. These control variables were removed from the structural model. The final structural model is shown in Fig. 3. (b). The positive correlation between product quality as competitive priority and firm performance was confirmed at p < 0.05 with standardized regression weight of 0.20. Therefore, the second hypothesis was verified.
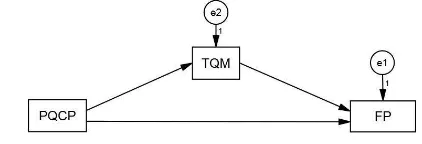
The third structural model was developed to test the third hypothesis, the mediating effect of TQM on the relationship between PQCP and firm performance. To test the mediating effect of TQM we followed the strategy recommended by Kim, et al. [57]. Before testing the mediating effect, it was required that PQCP was significantly correlated with TQM and with firm performance. In addition, TQM should be significantly correlated with firm performance [57]. The earlier hypothesis tests confirmed the existence of significant correlation between PQCP and TQM and between PQCP and firm performance. Additional test on the relationship between TQM and firm performance showed that the relationship was significant at p < 0.001 with standardized regression weight of 0.51.
Analysis of the influence of TQM as the mediating factor on the relationship between PQCP and firm performance was conducted by using the path diagram as shown in Fig. 4. A direct relationship between PQCP and firm performance was done by removing the TQM variable. This relationship resulted in standardized regression weights 0.178 with p = 0.03. Subsequently, the influence of TQM as the mediating factor on the relationship between PQCP and firm performance was tested using complete models as in Fig. 4. In order to perform the significance test on parameter estimation, bootstrapping method was used in this analysis [56]. Summary of structural relationship analysis among PQCP, TQM, and firm performance is shown in Table 3. The direct relationship between PQCP and firm performance that was initially significant became insignificant in the presence of TQM. Meanwhile, the indirect relationship of PQCP and firm performance through TQM was significant with
p < 0.01. Table 3 shows that the relationship of PQCP and firm performance is fully mediated by TQM. Therefore, the third hypothesis was confirmed.
CMIN/DF = 1.393, CFI = 0.982, RMSEA = 0.052 CMIN/DF = 1.391, CFI = 0.993, RMSEA = 0.052 * = significant at p < 0.05, ** = significant at p < 0.01, *** = significant at p < 0.001
Fig. 3 (a) Structural model between PQCP and TQM; (b) Structural model between PCQP and firm performance
Table 3 Summary of structural relationship analysis among PQCP, TQM, and firm performance
Path Direct without mediator Direct with mediator Indirect effect Conclusion
PQCP → TQM → FP 0.178* 0.033 (ns) 0.144** Fully mediated
* = significant at p < 0.05, ** = significant at p < 0.01, *** = significant at p < 0.001
4.3.Discussions of findings
This study aims to examine the impact of TQM as the mediating factor on the relationship between product quality as competitive priority and firm performance. To the best of our knowledge, this is the first work that links product quality as competitive priority to TQM implementation. The first finding identifies that product quality as competitive priority (PQCP) is positively correlated with TQM implementation. In other words, PQCP becomes the driving factor of TQM implementation. The higher the level of product quality as competitive priority is, the more intensive is the TQM implementation. Previous studies argue that product quality is the outcome of TQM implementation, which subsequently improves business performance [3]. However, when the product is undifferentiated, improvement in product quality will not turn into better competitive advantage [5]. In this case, firms may lack of motivation to implement TQM. The finding that TQM implementation is driven by product quality as competitive priority complements the existing theory that believes TQM implementation improves competitive advantage. Inclusion of quality program as control variable depicted in Fig. 3(a), not only intensifies the regression weight (from 0.42 to 0.43), but also most importantly increases the variance explained of TQM (from 0.18 to 0.23). This means that the existence of quality program strengthens the impact of product quality as competitive priority on TQM implementation.
The second finding verifies the positive correlation between product quality as competitive priority and firm performance. It means lack of attention on product quality causes mediocre performance [3]. On the contrary, if the level of product quality as competitive priority is high, firms will seek strategies to improve their product quality, which in turn will improve their business performance.
The last and main finding of this study confirms that TQM fully mediates the relationship between product quality as competitive priority and firm performance. Firms that compete in market focusing on product quality as competitive priority obtain more motivation to implement TQM. They believe TQM improves their business performance. On the contrary, if the leveraging effect of product quality on competitive advantage is low, firms may lose their motivation to implement TQM, especially when they are confronted with the reality that TQM cannot deliver short-term financial improvement. So, do they need to implement TQM? Prajogo and Sohal [58] offer good reasoning why they still need TQM. They distinguish cost leadership as strategy from cost leadership as competitive advantage. When product quality is not high competitive priority, firms do not need to adopt cost leadership strategy, in which they reduce cost by sacrificing product quality. On the contrary, they need to accomplish cost leadership as their competitive advantage. Literature argues that cost leadership as competitive advantage can be achieved through TQM implementation [4, 8, 10, 18]. In addition, TQM does not only improve product quality but also escalate internal resources such as managerial competence, staff capacity, external cooperation, reputation, and flexibility [59]. In the light of resource-based model, sustainable competitive advantage comes from resources that cannot be imitated by competitors [25]. This provides good motivation to implement TQM fervently. The managerial implication of the study is that TQM implementation can provide competitive advantage, either when the leveraging effect of product quality as competitive priority is high or low.
5.Conclusions, Limitations, and Recommendation
identify in our study. First, this study utilizes perceptual measures that is claimed to be less objective [37]. However, we have tried to reduce this problem by using comparative measures on firm performance construct. Second, we were unable to obtain multiple respondents from the same firm to alleviate self-reporting bias. The third limitation is the cross-sectional nature of our study, in which we cannot confirm the causal relationship among variables. The fourth limitation is due to the use of purposive sampling to select our respondents. We recommend future research to confirm findings of this study by conducting case studies. Thus, the causal relationship can be explored.
References
[1] L. M. R. Calingo, "The evolution of strategic quality management," International Journal of Quality & Reliability Management, Vol. 13,No. 9, 1996, pp. 19-37.
[2] M. Kroll, P. Wright, and R. A. Heiens, "The contribution of product quality to competitive advantage: Impacts on systematic variance and unexplained variance in returns," Strategic Management Journal, Vol. 20,No. 4, 1999, pp. 375-84. [3] L. Lakhal, "Impact of quality on competitive advantage and organizational performance," Journal of the Operational
Research Society, Vol. 60,No. 5, 2009, pp. 637-45.
[4] Y. K. Shetty, "Product quality and competitive strategy," Busziness Horizons, Vol. 30,No. 3, 1987, pp. 46-52.
[5] M. E. Porter, "The Five Competitive Forces That Shape Strategy," Harvard Business Review, Vol. 86,No. 1, 2008, pp. 78-93.
[6] J. C. Anderson and D. W. Gerbing, "Structural Equation Modeling in Practice: A Review and Recommended Two-Step Approach," Psychological Bulletin, Vol. 103,No. 3, 1988, pp. 411-23.
[7] American Society for Quality. (2012, 17 June). History of Quality.
[8] B. B. Flynn, "Managing for quality in the US and in Japan," Interfaces, Vol. 22,No. 5, 1992, pp. 69-80. [9] S. L. Ahire, M. A. Waller, and D. Y. Golhar, "Quality management in TQM versus non-TQM firms: an empirical
investigation," International Journal of Quality & Reliability Management, Vol. 13,No. 8, 1996, pp. 8-27.
[10] T. C. Powell, "Total quality management as competitive advantage: a review and empirical study," Strategic Management Journal, Vol. 16,No. 1, 1995, pp. 15-37.
[11] T. Y. Choi and K. Eboch, "The TQM Paradox: Relations among TQM practices, plant performance, and customer satisfaction," Journal of Operations Management, Vol. 17,No. 1, 1998, pp. 59-75.
[12] J. W. Dean, Jr. and D. E. Bowen, "Management theory and total quality: Improving research and practice through theory development," Academy of Management Review, Vol. 19,No. 3, 1994, pp. 392-418.
[13] D. I. Prajogo and A. S. Sohal, "Transitioning from total quality management to total innovation management-An Australian case," International Journal of Quality & Reliability Management, Vol. 21,No. 8, 2004, pp. 861-75.
[14] V. Kumar, F. Choisne, D. d. Grosbois, and U. Kumar, "Impact of TQM on company’s performance," International Journal of Quality & Reliability Management, Vol. 26,No. 1, 2009, pp. 23-37.
[15] S. I. Salaheldin, "Critical success factors for TQM implementation and their impact on performance of SMEs," International Journal of Productivity and Performance Management Vol. 58,No. 3, 2009, pp. 215-37.
[16] J. J. Tari, E. Claver-Cortes, J. Pereira-Moliner, and J. F. Molina-Azorın, "Levels of quality and environmental management in the hotel industry: Their joint influence on firm performance," International Journal of Hospitality Management, Vol. 29, 2010, pp. 500-10.
[17] H. Kaynak and J. L. Hartley, "A replication and extension of quality management into the supply chain," Journal of Operations Management, Vol. 26,No. 4, 2008, pp. 468–89.
[18] Q. Su, Z. Li, S.-X. Zhang, Y.-Y. Liu, and J.-X. Dang, "The impacts of quality management practices on business performance: an empirical investigation from China," International Journal of Quality & Reliability Management, Vol. 25, No. 8, 2008, pp. 809-23.
[19] C.-H. Wang, K.-Y. Chen, and Shiu-ChunChen, "Total quality management, market orientation and hotel performance: The moderating effects of external environmental factors," International Journal of Hospitality Management, Vol. 31,No. 1, 2012, pp. 119-29.
[20] M. Jun, S. Cai, and H. Shin, "TQM practice in maquiladora: Antecedents of employee satisfaction and loyalty," Journal of Operations Management, Vol. 24,No. 6, 2006, pp. 791-812.
[21] D. I. Prajogo and S. W. Hong, "The effect of TQM on performance in R&D environments: A perspective from South Korean firms," Technovation, Vol. 28,No. 12, 2008, pp. 855-63.
[22] R. Y. Y. Hung, B.-H. Lien, B. Yang, C.-M. Wu, and Y.-M. Kuo, "Impact of TQM and organizational learning on innovation performance in the high-tech industry," International Business Review, Vol. 20,No. 2, 2010, pp. 213-25.
[23] M. Martınez-Costa and A. R. Martınez-Lorente, "Does quality management foster or hinder innovation? An empirical study of Spanish companies," Total Quality Management, Vol. 19,No. 3, 2008, pp. 209-21.
[24] B. Sharma and D. Gadenne, "An Empirical Investigation of the Relationship between Quality Management Factors and Customer Satisfaction, Improved Competitive Position and Overall Business Performance," Journal of Strategic Marketing, Vol. 16,No. 4, 2008, pp. 301-14.
[25] R. Reed, D. J. Lemak, and N. P. Mero, "Total quality management and sustainable competitive advantage," Journal of Quality Management, Vol. 5,No. 1, 2000, pp. 5-26.
[26] Deming Prize, "Guide for Overseas Companies," Union of Japanese Scientists and Engineers, Tokyo, 2011.
[27] S. L. Ahire, "Management science-total quality management interfaces: an integrative framework," Interfaces, Vol. 27,No. 6, 1997, pp. 91-105.
[29] D. C. Montgomery, Introduction to Statistical Quality Control, 6th edition ed. Hoboken, NJ: John Wiley & Sons, Inc., 2009. [30] A. R. Davidson and L. W. Stern, "A quality self-assessment model," Managerial Auditing Journal, Vol. 19,No. 7, 2004, pp.
859-68.
[31] T. A. Joiner, "Total quality management and performance--The role of organization support and co-worker support," International Journal of Quality & Reliability Management, Vol. 24,No. 6, 2007, pp. 617-27.
[32] T. J. Kull and J. G. Wacker, "Quality management effectiveness in Asia: The influence of culture," Journal of Operations Management, Vol. 28,No. 3, 2010, pp. 223-39.
[33] A. C. L. Yeung, "Strategic supply management, quality initiatives, and organizational performance," Journal of Operations Management, Vol. 26,No. 4, 2008, pp. 490-502.
[34] S. L. Ahire, R. Landeros, and D. Y. Golhar, "Total Quality Management: A Literature Review And An Agenda for Future Research," Production And Operations Management, Vol. 4,No. 3, 1995, pp. 277-306.
[35] B. B. Flynn, R. G. Schroeder, and S. Sakakibara, "The impact of quality management practices on performance and competitive advantage," Decision Sciences, Vol. 26,No. 5, 1995, pp. 659-91.
[36] C. N. Madu, C.-H. Kuei, and R. A. Jacob, "An empirical assessment of the influence of quality dimensions on organizational performance," International Journal of Production Research, Vol. 34,No. 7, 1996, pp. 1943-62. [37] A. C. Phan, A. B. Abdallah, and Y. Matsui, "Quality management practices and competitive performance: empirical
evidence from Japanese manufacturing companies," International Journal of Production Economics, Vol. 133,No. 2, 2011, pp. 518-29.
[38] B. B. Flynn, R. G. Schroeder, and S. Sakakibara, "A framework for quality management research and an associated measurement instrument," Journal of Operations Management, Vol. 11,No. 4, 1994, pp. 339–66.
[39] J. R. Grandzol and M. Gershon, "A survey instrument for standardizing TQM modeling research," International Journal of Quality Science, Vol. 3,No. 1, 1998, pp. 80-105.
[40] S. A. Black and L. J. Porter, "Identification of the critical factors of TQM," Decision Sciences, Vol. 27,No. 1, 1996, pp. 1-21.
[41] Z. Zhang, A. Waszink, and J. Wijngaard, "An instrument for measuring TQM implementation for Chinese manufacturing companies," International Journal of Quality & Reliability Management, Vol. 17,No. 7, 2000, pp. 730-55.
[42] J. V. Saraph, P. G. Benson, and R. G. Schroeder, "An Instrument for Measuring The Critical Factors of Quality," Decision Sciences, Vol. 20,No. 4, 1989, pp. 810-29.
[43] D. Samson and M. Terziovski, "The relationship between total quality management practices and operational performance," Journal of Operations Management, Vol. 17,No. 4, 1999, pp. 393-409.
[44] D. Wahjudi, M. L. Singgih, and P. Suwignjo, "Impact of Quality Management Practices on Firm Performance: The Research Evolution," presented at the International Conference on Industrial Engineering and Service Science (IESS) 2011, Surakarta, 2011.
[45] V. Arumugam, K.-B. Ooi, and T.-C. Fong, "TQM practices and quality management performance: An investigation of their relationship using data from ISO 9001:2000 firms in Malaysia," The TQM Magazine, Vol. 20,No. 6, 2008, pp. 636-50. [46] National Institute of Standards and Technology, "2011–2012 Criteria for Performance Excellence," National Institute of
Standards and Technology, Gaithersburg, MD, 2011.
[47] S. L. Ahire, D. Y. Golhar, and M. A. Waller, "Development and validation of TQM implementation constructs," Decision Sciences, Vol. 27,No. 1, 1996, pp. 23-56.
[48] M. E. Porter, Competitive Advantage: Creating and Sustaining Superior Performance. New York, NY: The Free Press, 1985.
[49] U. Golob and K. Podnar, "Competitive advantage in the marketing of products within the enlarged European Union," European Journal of Marketing, Vol. 41,No. 3/4, 2007, pp. 245-56.
[50] M. Tracey, M. A. Vonderembse, and J.-S. Lim, "Manufacturing technology and strategy formulation: keys to enhancing competitiveness and improving performance," Journal of Operations Management, Vol. 17,No. 4, 1999, pp. 411-28. [51] N. Hill. (2009, 12 May 2015). Commodity products: is there an alernative to selling on price? Stakeholder Satisfaction6(2),
23-5. Available: http://www.customer-insight.co.uk/issue/795
[52] L. W. Phillips, D. R. Chang, and R. D. Buzzell, "Product Quality, Cost Position and Business Performance: A Test of Some Key Hypotheses," Journal of Marketing, Vol. 47,No. 2, 1983, pp. 26-43.
[53] H.-J. Cho and V. Pucik, "Relationship between Innovativeness, Quality, Growth, Profitability, and Market Value," Strategic Management Journal, Vol. 26,No. 6, 2005, pp. 555-75.
[54] A. Agus, S. K. Krishnan, and S. L. S. A. Kadir, "The structural impact of total quality management on financial performance relative to competitors through customer satisfaction: a study of Malaysian manufacturing companies," Total Quality Management, Vol. 11,No. 4-6, 2000, pp. S808-S19.
[55] North American Industry Classification System Association. (2012, 26 July). SIC Codes and Counts by Division. Available: http://www.naics.com/free-code-search/sictwodigit2.html?minsic=20&maxsic=39
[56] J. F. Hair, Jr., W. C. Black, B. J. Babin, and R. E. Anderson, Multivariate Data Analysis, 7th ed. Upper Saddle River, NJ: Pearson Prentice Hall, 2010.
[57] J.-S. Kim, J. Kaye, and L. K. Wright, "Moderating and Mediating Effects in Causal Model," Issues in Mental Health Nursing, Vol. 22,No. 1, 2001, pp. 63-75.
[58] D. I. Prajogo and A. S. Sohal, "The relationship between organization strategy, total quality management (TQM), and organization performance––the mediating role of TQM," European Journal of Operational Research, Vol. 168,No. 1, 2006, pp. 35-50.