4th ICRIEMS Proceedings
Published by The Faculty Of Mathematics And Natural Sciences Yogyakarta State University, ISBN 978-602-74529-2-3
B-57
Performance and Tolerance of Green Bean to Shade
Ai Komariah
1,a), Elly Roosma Ria
2,b)and Restu Gunadi
3,c)1,2,3(Departement of Agrotechnology, Faculty of Agriculture , Winaya Mukti University)
a)
Abstract. The purpose of the research was to know performance and tolerance of green bean variety to shade. A research was done in experiment garden of Winaya Mukti University with 850 m ground sea level and rainfall type C, from June until September 2016. Experiment design was used Split Plot Design with 12 treatments and 3 replications. The treatments consists of two level which were main plot level shade (P) as : p0 = Without Shade, p1 = 50% of shade, p2 = 65% of shade, p3 = 75% of shade, and sub plot varieties (V) as : v1 = Vima-1 variety , v2 = Sriti variety, and v3 = Murai variety. The result of the experiment showed that interaction affects the level of shade and varieties to branch number per plant. Level of shade had an effect to plant height, leaf number, branch number, plant dry weight, filled number per plant and dry seed weight per plant. Between variety Vima-1, Sriti and Murai had different of plant weight, leaf number, branch number, and plant dry weight. Vima-1, Sriti and Murai varieties were tolerant to 50% shade, moderate to shade 65% and sensitive to shade 75%.
INTRODUCTION
Green beans can be grown in diverse environments with full sun to shade conditions by cropping pattern, or in the shaded area of annual crops. The utilization of vacant land under plantation crops stand/ forestry is often problematic due to the reduced intensity of light reaching the ground surface. This affects plant physiological processes including the process of opening and closing of stomata, transpiration, and photosynthesis (Rajapakse, Young, McMahon, and Oi, 1999).
Shade on soybean plants resulting in a decrease in the rate of photosynthesis and light saturation point, this has an impact on the decline in yield and yield components of soybean (Kurosaki and Yumoto, 2003). The decline in grain yield than specified by the intensity of light, is also determined by the level of shade (Jiang and Egli, 1995).
According to Kurosaki and Yumoto (2003), lack of light resulting in a reduced number of pods formed and the resulting decrease in yield of up to 75%, depending on the varieties grown. Light intensity reduction from 100% to 90% are not significantly reduced grain yield, total dry weight, dry weight of leaf and flowering age of green beans, but reducing the number of pods and root dry weight, and increased plant height. However, a decrease in light intensity of up to 50% of full radiation causes a decrease in yield of 37% -74% (Laosuwan, Saengpratoom, Kalawong and Thongsomsri, 1991). Varieties suitable for intercropping pattern characterized by physiological adaptation ability to compete in getting light, water and nutrients. Soepandi, Chozin, Sastrosumajo, Juhaeti, and Suhardi (2003), reported that shade tolerant genotypes characterized by leaves wider and thinner, higher content of chlorophyll b and the ratio of chlorophyll a/b lower than the sensitive genotype. Changes in morphological and physiological character is a form of plant adaptation mechanisms to stress the auspices (Evans and Poorter 2001; Kim et al., 2005 and Muhuria, 2007). In low light plant photosynthesis seeks to keep the fixed place in conditions of low light intensity. This situation can be achieved when respiration was also efficient (Soepandi, Chozin, S.Sastrosumajo, Juhaeti, and Suhardi, 2003).
B-58
per hectare. This variety can be harvested in 60-65 days after planting. The characteristics of Sriti varieties are a drooping pods position, dull green seed color, with a weight of 100 seeds about 6 grams. The special nature Sriti varieties are tolerant to powdery mildew disease. Murai varieties can produce an average of 1.5 t ha-1 seed. Murai varieties can be harvested 63 days after planting. Murai is the hallmark of the varieties have a drooping pods position, with a dull seed color, weight of 100 seeds up to 6 grams. The special nature Murai varieties are resistant to leaf spot disease.
The study aims to obtain information about the performance and tolerance varieties of green beans Vima-1, Sriti and Murai at various levels of shade
.
EXPERIMENTAL
Research conducted at the experiment station Faculty of Agriculture, Winaya Mukti University, Tanjungsari, Sumedang with the altitude of 850 m above sea level, from June to September 2016. Precipitation type is C classification according to Schmidt and Ferguson (1951). Materials used varieties of green beans Vima-1, Sriti and Murai varieties, chicken manure, Urea (45% N), TSP (46% P2O5), KCl (60% K20, and polybag size 30 cm X 30 cm, pesticide active ingredients Profenofos 500 grams of L-1 and fungicide active ingredient Mancozeb, paranet 50%, paranet 65%, paranet 75%. The tools used in these experiments is the ruler, hoes, scales, bucket, handsprayer, thermometer, sieve land size of 2 mm, hose, analytical balance, calipers, stationery and a camera.
The design environment was used Split Plot Design consists of 12 treatments and 3 replications. The treatments are various levels of shade that is without shade, 50% of shade, 65% of shade, and 75% of shade. The varieties tested Vima-1, Sriti, and Murai. Responses were observed include plant height age 14 Days After Plant (DAP), 28 DAP, 42 DAP, and 56 DAP; number of leaves per plant age 28 DAP, 42 DAP and 56 DAP; number of branches per plant age 28 DAP, 42 DAP and 56 DAP; weights dry plant, number of pods per plant, weight of seeds dried per plant (g), weight of 100 grains seeds (g), STI (Stress Tolerance Index) varieties in the shade 50%, 65% and 75% of STI. According to Fernandez (1992), STI = [(Yp) (Ys)] / ((YP) 2, according to Komariah et al (2003), tolerant genotype determination based on the value of the STI and the standard deviation is susceptible varieties when x ≤ (x -½ Sd ), moderate varieties when x ≤ (x -½ Sd) <x <(x + ½ Sd) and tolerant varieties : x> (x + ½ Sd). The data were tested variance (F test) at the level of α 0.05. if there is a real diversity that is Ftest ≥ Ftable, then to know the difference between each treatment, followed by analysis using Least Significant Different (LSD), α 0.05 (Gomez and Gomez, 1995)
RESULTS AND DISCUSSION
PLANT HEIGHT
Statistical analysis of the results showed that no interaction between the level of shade and varieties of green beans for all ages observations. Independent influence is presented in Table 1.
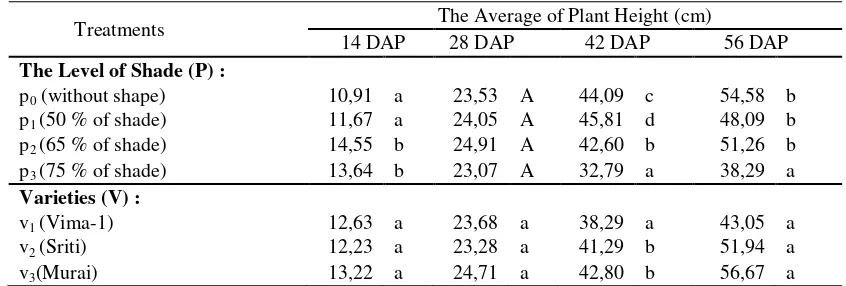
Table 1. Effect of The Level of Shade and Varieties to Plant Height Age 14 DAP, 28 DAP, 42 DAP and 56 DAP
Treatments The Average of Plant Height (cm)
14 DAP 28 DAP 42 DAP 56 DAP The Level of Shade (P) :
p0 (without shape) 10,91 a 23,53 A 44,09 c 54,58 b p1 (50 % of shade) 11,67 a 24,05 A 45,81 d 48,09 b p2 (65 % of shade) 14,55 b 24,91 A 42,60 b 51,26 b p3 (75 % of shade) 13,64 b 23,07 A 32,79 a 38,29 a Varieties (V) :
v1 (Vima-1) 12,63 a 23,68 a 38,29 a 43,05 a
v2 (Sriti) 12,23 a 23,28 a 41,29 b 51,94 a
v3(Murai) 13,22 a 24,71 a 42,80 b 56,67 a
B-59 Least Significant Different at 5% significance level.
Based on Table 1 showed that the high level of shade effect on green bean plants at 14 DAP, 42 DAP and 56 DAP. The level of shade about 65% and 75% have a higher crop than 50% of shade and without shade. At the age of 28 DAP, the shade has no effect on plant height. Plant height between varieties Vima-1, Sriti and Murai did not significant at 14 DAP, 28 DAP, and 56 DAP. The significant only at the age 42 DAP, Vima-1 is shorter than Sriti and Murai varieties. This is in accordance with the opinion of Kurosaki and Yumoto (2003) that the lack of light on green bean plants will increase plant height.
The Number of Leaves per Plant
Statistical analysis showed that no interaction between level of shade and varieties for the number of leaves per plant at 28 DAP, 42 DAP and 56 DAP. The results of the analysis is presented in Table 2.
Table 2. Effect of Level of Shade and Varieties to the Number of Leaves per Plants Age 28 DAP, 42 DAP and 56 DAP.
Treatments The Average of The Number of Leaves per Plant 28 DAP 42 DAP 56 DAP Level of Shade (P) :
p0 (without shade) 4,94 d 7,08 c 8,39 a
p1 (50 % of shade) 4,58 c 6,94 c 9,06 a
p2 (65 % of shade) 4,22 b 6,47 b 7,61 a
p3 (75 % of shade) 3,97 a 5,69 a 6,67 a
Varieties (V) :
v1 (Vima-1) 4,44 A 6,46 a 7,29 a
v2 (Sriti) 4,42 A 6,69 b 8,00 b
v3 (Murai) 4,44 A 6,50 a 8,50 c
Description: The average number accompanied with the same letters show no significant difference according to The Least Significant Different at 5% significance level.
Based on Table 2 showed that the level of shade effect on the number of leaves at 28 DAP and 42 DAP. At the age of 56 DAP the level of shade has no effect on the number of leaves. The number of leaves between varieties Vima-1, Sriti, and Murai did not significant at 28 DAP, but significant at age of 42 DAP and 52 DAP that Sriti variety has the number of leaves more than the Vima-1 and Murai varieties.
Number of Branches per Plant
Statistical analysis showed that no interaction between the level of shade and the varieties for the number of branches per plan of green pea at age 28 DAP and 56 DAP is presented in Table 3.
Table 3. Effect of Level of Shade and Varieties on the Number of Branches per Plant Age 28 DAP and 56 DAP
Treatments The Average of Number of Branches 28 DAP 56 DAP Level of Shade (P) :
p0 (without shade) 2,86 c 8,67 a
p1 (50 % of shade) 2,44 b 9,40 a
p2 (65 % of shade) 2,11 a 7,93 a
p3 (75 % of shade) 2,00 a 7,17 a
Varieties (V)
v1 (Vima-1) 2,38 a 7,61 a
B-60
v3 (Murai) 2,34 a 8,91 c
Description: The average number accompanied with the same letters show no significant difference according to The Least Significant Different at 5% significance level.
Based on Table 3 showed that the level of shade effect on the number of branches at 28 DAP. The level of shade 50%, 65% and 75% resulted in a number of branches of green bean plants less than without shade. The number of branches between Vima-1, Sriti, and Murai have not significant. At the age of 56 DAP, the level of shade have no effect on the number of branches among the varieties while there are differences in the number of branches. There is an interaction between the level of shade and varieties to the number of branches at the age of 42 DAP as shown in Table 4.
Table 4. Effect of Level of Shade and Varities on the Number of Branches per Plant Age 42 DAP
Treatments
v
1(Vima-1)
v
2(Sriti)
v
3(Murai)
p
0(without shade)
15.50 d
16.00 d
16.50 d
A
B
C
p
1(50 % of shade)
14.63 c
14.50 c
13.63 c
B
B
A
p
2(65 % of shade)
12.00 b
12.88 b
12.50 b
A
C
B
p
3(75 % of shade)
9.88 A
10.88 a
11.63 a
A
B
C
Description: The average number of treatments that are marked lowercase (the vertical direction) and capitals (the horizontal direction) of the same showed no significant difference according to The Least Significant Different at 5% significance level.
Plants Dry Weight
Statistical analysis showed that there is no interaction between the level of shade and varieties of green beans to dry weight of plants . Data analysis result is presented in Table 5.
Table 5. Effect of Level of Shade and Varities to Plants Dry Weight
Treatments The Average of Dry Weight of Plants (g) Level of Shade (P) :
p0 (without shade) 17,79 c
p1 (50 % of shade) 17,09 c
p2 (65 % of shade) 14,38 b
p3 (75 % of shade) 5,03 a
Varieties (V) :
v1 (Vima-1) 8,37 a
v2 (Sriti) 16,65 b
v3 (Murai) 15,70 b
Description: The average number accompanied with the same letters show no significant difference according to The Least Significant Different at 5% significance level.
Number of Pods per Plant
B-61
Table 6. Effect of Level of Shade and Varities to Number of Pods per Plant
Treatments The Average of Number of Pods per Plant Level of Shade (P) :
p0 (without shade) 15,28 c
p1 (50 % of shade) 13,11 c
p2 (65 % of shade) 9,11 b
p3 (75 % of shade) 4,50 a
Varieties (V) :
v1 (Vima-1) 9,38 a
v2 (Sriti) 11,58 a
v3 (Murai) 10,54 a
Description: The average number accompanied with the same letters show no significant difference according to The Least Significant Different at 5% significance level.
Dry Grain Weight per Plant
Results of the analysis showed no interaction between the level of shade and varieties of green beans to dry grain weight per plant. The results of the analysis is presented in Table 7.
Table 7. Effect of Level of Shade and Varities to Dry Grain Weight per Plant
Treatments The Average of Dry Grain Weight per Plant (g) Level of Shade (P) :
p0 (without shade ) 6,89 c
p1 (50 % of shade) 7,40 c
p2 (65 % of shade) 3,75 b
p3 (75 % of shade) 2,09 a
Varieties (V) :
v1 (Vima-1) 4,97 a
v2 (Sriti) 5,44 a
v3 (Murai) 4,68 a
Description: The average number accompanied with the same letters show no significant difference according to The Least Significant Different at 5% significance level.
Based on Table 7 showed that the level of shade effect on dry grain weight per plant of green beans. Dry grain weight per plant at 50% of shade and without shade are greater than 65% and 75% of shade. Dry grain weight per plant between varieites showed not significant.
The Weight of 100 Grains of Seeds
Statistical analysis showed that no interaction between the level of shade and varieties of green beans to the weight of 100 grains of seeds. The results of the analysis is presented in Table 8.
Table 8. Effect of Level of Shade and Varieties to The Weight of 100 Grains Seeds. Treatments The Average of The Weight of 100 Grains Seeds (g) Leevel of Shade (P) :
p0 (wthout shade) 6,28 a
p1 (50 % of shade) 6,64 a
p2 (65 % of shade) 5,95 a
p3 (75 % of shade) 6,28 a
Varietas (V) :
v1 (Vima-1) 6,02 a
v2 (Sriti) 6,44 a
v3 (Murai) 6,40 a
B-62 beans to the number of branches per plant at the age of 42 DAP. The level of shade effect on plant height, leaf number, branch number, plant dry weight, a number of pods cropping and dry grain weight per plant. The difference of green beans plant response to shade conditions due to plant growth and development is influenced by genetic factors and environmental plants covering the soil and climate, as well as cultivation techniques. The plants will give a different response if the condition of these factors differently. According to Sri Setyati Harjadi et al, (2000), the growth and development of plants are strongly associated with the processing of influencing factors such as the soil, the climate around the plants and cultivation.
Different light intensities and duration of exposure will affect the process of photosynthesis for maximum photosynthesis require full light. Sunlight is a source of energy in the process of photosynthesis, which can affect the growth of vegetative and generative (Cahyono, 2002). Shortage of light intensity would interfere with the process of photosynthesis and growth. Besides a shortage of sunlight cause faster plant growth will be weak but the stem leaves are small and pale.
Shade treatment on green bean plants will affect the nature of plant morphology. Green bean plant morphology can be influenced by the shade is not sturdy stem, because the stem is smaller so that the plant becomes easy to fall down. That condition does not apply to plant shade-tolerant because they tend to be more efficient in the utilization of light. In particular shade limit physiological processes in plants are not unduly influenced tolerant shade, so the plants grow normally, does not occur etiolation and of lodging that would not affect the results (Hakim, L. Sutjihno. 1992). According to Herdiana et al. (2008), a high level of shade is too dense for the types of plants that require light (intolerant) will cause etiolation.
According to Sri Setyati Harjadi (1991) when the initial growth of the plant is good, then the result will be good too, if a crop is initially stunted growth, then the final result of the plant it is going downhill. On the red bean plants, photosintat as the net result of photosynthesis is the result of energy production with energy reduction as a result of breathing, and the energy from photosynthesis form of pods containing seeds. The resulting increases in both the number and the weight is directly proportional to the relative growth and the net of photosynthesis. So more photosintat shaped the more number of pods produced as well as the weight of 100 grain. Increased seed yield per plant will be increasing the yield per plant, so if the weight of seeds per plant increases, it will directly increase grain yield per plant. Accoring to Arif Irawan and Jafred E. Halawane (2016) research suggests that the dose of fertilizer and shade influence on the height and diameter growth of seedlings, seedling dry weight and seedling quality index, both individually and interaction. Individually best treatment NPK fertilizer produced by the use of a dose of 0.5 g/seedlings, while the best shade treatment resulted in moderate shade. In interactions, treatment gives the best effect on all parameters measured were treatment dosages of 0.5 g/seeds combined with moderate shade.
B-63
soluble proteins and content of malondialdehyde (MDA), slowing the initiation of flowering, extend the life of flowering, flower fresh weight and flower diameter.
Research by Mustofa Khoiri (2010), that the provision of shade in plants red peppers Capsicum annuum L of aspects of morphological effect on plant height and average dry weight significantly, but the width of the leaves, many leaves, and leaf length influences the shade does not affect significantly with controls. By reviewing the rate of photosynthesis in plants chilli shade influence on the value of quantum yield, photochemical quenching, and non-photochemical quenching but on the value of Q maximum showed no real influence. Chilli plants are plants that are relatively more susceptible to the effects of shade. Ecophysiological aspects of the review of the provision of shade treatment has triggered the production of proline and ascorbic acid significantly.
There are differences in plant height, number of leaves, number of branches, and the dry weight of the varieties tested. The discrepancies caused by genetic factors which include varieties have different genetic backgrounds. Phenotype diversity is determined by three factors: genotype diversity, the environment and the interaction of environment and genotype (Rasamivelona et al., 1995). Varieties Vima-1, Sriti and Murai tolerant of shade level of 50%, Moderate to shade level of 65% and sensitive to shade of level 75%. Research Qingsong Shao et al. (2014), showed that Anoectochilus roxburghii under the auspices of different normal irradiation namely 50%, 30%, 20% and 5%, the rate of photosynthesis clean and conductivity of stomata was higher in conditions of irradiation 30% compared to 5%, 20% and 50%. Soluble sugar and malondialdehyde levels positively correlated with the level of irradiation. Chloroplast development associated with an increased number of thylakoid and grana containing photosynthetic pigments and this is an important mechanism of tolerance to shade.
CONCLUSION
The result of the experiment showed that an interaction affects between level of shade and varieties to branch number per plant. Level of shade had an effect to plant height, leaf number, branch number, plant dry weight, filled number per plant and dry seed weight per plant. Between variety Vima-1, Sriti, and Murai had an affects of plant weight, leaf number, branch number, and plant dry weight. Vima-1, Sriti, and Murai varieties were tolerant to 50% of shade, moderate to 65% of shade, and sensitive to 75% of shade.
REFERENCES
1.
Arif Irawan and Jafred E. Halawane. 2016.
Effect of NPK And Shade on Growth of Shorea
Assamica Dyer n nurseries. Journal of Forest Plant Germination 4 (2): 81-93.
2.
Cahyono, B. 2002.
Wortel Cultivation Techniques and Business Analysis
.Kanisius.Yogyakarta
3.
Daqiu Zhao
,
Zhaojun Hao
, and
Jun Tao
,.2012.
Effects of shade on plant growth and flower
quality in the herbaceous peony (Paeonia lactiflora Pall.)
.
Plant physiologyand biochemistry v
61 : 187-196
.
http://dx.doi.org/10.1016/j.plaphy.2012.10.005
4.
Evans, J.R., and H. Poorter 2001.
Photosynthetic acclimation of plant to growth irradiance: The
relative importance of specific leaf area and nitrogen partitioning in maximizing carbon gain.
Plant Cell Environ. 24:755-767
5.
Fernandez, G.C.J. 1992.
Effective selection criteria for assessing plant stress tolerance.
p.257-270. In: C.G.
6.
Kuo (ed.). Adaptation of Food Crops to Temperatur and Water Stress. Proceeding of an
International Symposium. Asian Vegetable Research and Development Center, Taiwan.
7.
Gomez, K.A. and A.A. Gomez. (1995).
Statistical Procedures for Agricultural Research.
B-64
8.
Hakim, L., Sutjihno. 1992.
Selection of varieties of green beans for intercropping system with
maize. Agricultural Research. 12 (1): 41-45
. Quoted on Titik Sundari
et al
, Thesis. 2005.
Critical Level Five Genotypes Relative Light Intensity Green Beans (Vigna radiatus L.)
Oline
At :http://repository.unhas.ac.id:4001/digilib/files/disk1/165/--kikireskyn-8224-1-14 -kiki-6.pdf
Downloaded May 2016.
9.
Herdiana N, H Siahaan, Rahman TS.2008. E
ffect of Charcoal Compost and Light Intensity on
the Growth Bawang Seed Wood. Journal of Agriforestry Plants, 5 (3): 1-7
.
10.
Jiang, H. dan D. B. Egli. 1995.
Soybean seed number and crop growth rate during flowering.
Agronomy Journal 87: 264-267.
11.
Kurosaki, H., and S. Yumoto. 2003.
Effects of Low Temperature and Shading during Flowering
on the Yield Components in Soybeans. Plant Production Science. Vol. 6(1): 17-23
. Online At:
http:// www.jstage.jst.go.jp/article/pps/6/1/6_17/_article. Download March, 2016
12.
Kim Gyung-Tae, S. Yano, T. Kozuka, and H, Tsukaya. 2005.
Photomorphogenesis of leaves:
Shade .avoidance and differentiation of sun and shade leaves. Photochem. Photobiol.
Sci.4:170-174.
13.
Komariah, A., A Baihaki. R. Setiamihardja. and S, Djakasutani. 2003.
Inheritance Pattern of
nitrate reductase activity in leaves and roots. and total N content of plants as a character
identifier soybean tolerance to inundation. Zuriat, 18 (11): 46-55
14.
Laosuwan, P., S. Saengpratoom, S. Kalawong and A. Thongsomsri. 1991.
Breeding mungbean
for shade tolerance. p. 95-100. In: C. Thavarasook et
15.
Muhuria, L. 2007.
The physiological mechanism and inheritance of tolerance of soybean
(Glycine max L.
16.
Merrill) to the light intensity is low. (Dissertation). Graduate School, Institut Pertanian Bogor.
Bogor. 163 p. Not published.
17.
Mustofa Khoiri. 2010.
Effect of Shade on Growth and Photosynthesis rate CabeMerah Plants
(Capsicumnnuum L)
. Portalgaruda.org/article.php?article=391925&val=7292&title
18.
Nevy Diana Hanafi, Roeswandy and Hasan Fuad Nasution. 2005.
The Effect of Various Levels
of the Shades
from Some Mixed Pasture towards the Production of Suitables). Journal of
Agribusiness 1 (2): 67-72.
19.
Qingsong Shao, Hongzhen Wang, Haipeng Guo, Aicun Zhou, Yuqiu Huang, Yulu Sun, and
Mingyan Li. 2014.
Effects of Shade Treatments on Photosynthetic Characteristics, Chloroplast
Ultrastructure,
and
Physiology
of Anoectochilus
roxburghii.
http://dx.doi.org/10.1016/j.plaphy.2012.10.005
20.
Rajapakse, N.C., R.E. Young, M.J. McMahon, and R. Oi. 1999.
Plant height control by
photoselective filters: Current status and future prospects. Hort. Technology 9:618-624.
21.
Rasamivelona A. Gravois KA, and Dilday RH. 1995.
Heritability and genotipe x environment
B-65