THE RELATIONSHIPBETWEEN CEO COMPENSATION AND COMPANY PERFORMANCES
Segaf
Fakultas Ekonomi,Universitas Islam Negeri Maulana Malik Ibrahim Malang Jl. Gajayana 50 Malang Telp. 0341-551354 Faks. 0341-572533
Email: No Telepon: 0819826919
Abstrak
Akhir-akhir ini gaji CEO (Chief Executive Officers) telah menyita perhatian investor, masyarakat, bahkan media terkait dengan kinerja perusahaan. Artikel ini mengkaji dan menganalisa keterkaitan antara gaji CEO dengan kinerja perusahaan. Walaupun pertanyaan ini telah dikaji oleh peneliti terdahulu namun kebanyakan dilakukan di negara maju seperti Amerika dan Inggris. Pengumpulan data melalui laporan keuangan tahunan, program Data Stream Thompson dan Laporan Rapat Umum Pemegang Saham. Tiga puluh perusahaan digunakan sebagai sample dari lebih 500 perusahaan terdaftar di KLSE (Kuala Lumpur Stock Exchange). Pengambilan sample menggunakan metode simple random sampling dengan tujuan untuk memberikan kesempatan yang sama pada penelitian ini. Pada penelitian ini pengukuran kinerja perusahaan melalui ROE (Return on Equity), ROA (Return on Asset), EPS (Earning per Share) dan NPM (Net Profit Margin) selama enam tahun (2003-2008) berdasar perhitungan tahunan. Kemudian data dianalisa melalui analisis deskriptif dan analisa regresi Anova. Hasil penelitian ini bahwa gaji tertinggi perusahaan oleh Genting Berhad, selama tahun 2008 merupakan tahun terbaik berinvestasi bagi tipe investor penghindar resiko, selama tahun 2003-2007 terdapat pengaruh yang signifikan antara gaji CEO dan kinerja perusahaan sedangkan pada tahun 2008 tidak terdapat pengaruh yang signifikan antara gaji CEO dan kinerja perusahaan.
Kata kunci : Gaji CEO, kinerja perusahaan
INTRODUCTION
understanding of the CEO compensation is due to the performance measure and compensation structure.
This issue has created impacts which are far more complex because of good corporate governance should constrain excessive payments being made to directors and remuneration should be largely determined by the firm’s performance. This has resulted in the analysis of rationales, strategies and mechanism that’s respond to the changes in the CEO compensation. Unlike in the U.S or U.K, According to Thillainathan (1999), the concentration of shareholdings through cross holding and pyramid are very common ownership patterns in Malaysia. These companies are being run and dominated by large shareholders who could lead to insiders maximizing their private benefits at the expense of the minority shareholders through director’s compensation packages (Thillainathan, 1999). The previous studies have focused mainly on the return on equity (ROE) for the related companies and evaluate the actual cash payments to the CEO.
PROBLEM STATEMENT
In Malaysia few studies have analyzed the relationship between Chief Executive Officers’ (CEO) compensation and firm performance. According to Jensen and Meckling (1976), scholars hold that executive compensation is mostly tied to company performance. However, Bebchuk and Fried (2004) argued that pay is not related to company performance since managers have substantial bargaining power over their boards. Thus, CEOs may have the ability to influence the structure, level, and performance of their compensation payment. Furthermore, the previous studies which is conducted by Veliyath and Bishop (1995), Akhigbe, Madura and Tucker (1995), they found a strong relationship between CEO compensation and company performance. This study is important in order to recognize what parameters that can be used in order to evaluate CEO performance. Almost all studies are done in developed countries such as U.K and U.S but there is lack of researchers about the CEO compensation in Malaysian companies. Therefore, in this study we analyzed the factors that related in order to analyze the relationship.
OBJECTIVES
LIMITATION
This study only stress on several variables that related with the relationship between CEOs compensation and company performance. These variable are adapted from previous studies by Attaway (2000), Akhigbe, Madura, and Tucker (1995), Madura, Martin and Jessel (1996); and Hall and Liebman (1998). These studyers have applied similar model to their studies. However, we made a few modifications of this model and come up with the study model or theoretical frame work presented in Figure 1.
Another limitation on this study is related to sample whereby our sample is gain from the secondary data which is data stream, KLSE site, and from the companies annual report its self. However, this will reduce the risk of bias because of all this annual report already audits by accredited accountants before they publish to the publics.
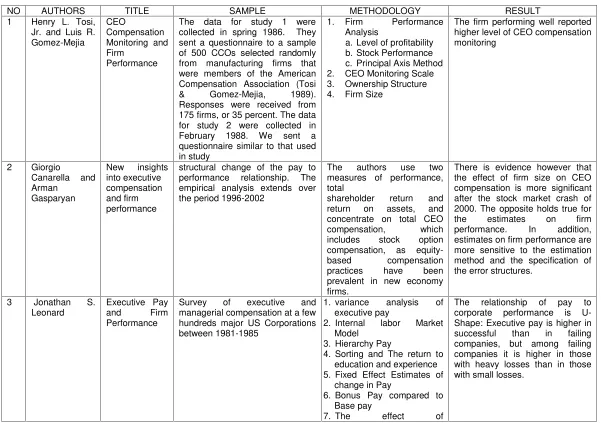
LITERATURE REVIEW
Table 1: Liteature Review
NO AUTHORS TITLE SAMPLE METHODOLOGY RESULT
1 Henry L. Tosi, collected in spring 1986. They sent a questionnaire to a sample of 500 CCOs selected randomly from manufacturing firms that were members of the American Compensation Association (Tosi & Gomez-Mejia, 1989). Responses were received from 175 firms, or 35 percent. The data for study 2 were collected in February 1988. We sent a questionnaire similar to that used in study
The firm performing well reported higher level of CEO compensation monitoring performance relationship. The empirical analysis extends over the period 1996-2002
The authors use two measures of performance, total
shareholder return and return on assets, and concentrate on total CEO compensation, which includes stock option compensation, as equity-based compensation practices have been prevalent in new economy firms.
There is evidence however that the effect of firm size on CEO compensation is more significant after the stock market crash of 2000. The opposite holds true for the estimates on firm performance. In addition, estimates on firm performance are more sensitive to the estimation method and the specification of the error structures. managerial compensation at a few hundreds major US Corporations between 1981-1985
1. variance analysis of executive pay
compensational system data collected during 1982, 1983, and 1984.
The sample includes the top executive for the total firm, group, subgroup, division, and plant. The sample consists of 303 large publicly traded U.S. corporations which span many sectors of the and corporate and business unit size
3. Executive compensation and size in percentage changes
The level of corporate CEO compensation exhibits a positive and statistically significant cross sectional association with the level of firm size.
The adjusted R2 for these regressions is considerably smaller than that from the regressions using measures expressed as levels. This result suggests that changes in size, whether measured at the corporate or business unit level, do not exhibit a high correlation
The initial sample consisted of all utilities in Standard Industrial Classification (SIC).
Compensation data were obtained for 1992- 95 from Standard and Poor’s Compustat Execu Comp. Final sample of firm- years contains 225 observations.
Canonical Correlation Analysis (CCA) used to predicts multiple dependent variables (criterion variables) from multiple independent variables (predictor variables)
There is evidence that CEO compensation and firm performance are associated when the overall relationship between individual components of compensation and firm performance measures is considered simultaneously. There is a positive association between changes in short- term incentive compensation (CHBON) and changes in market returns (CHMKRT).
6 Lawrence S.
The data include annual financial statement and CEO compensation information from the MBNQA winning public companies from 1988 to 2003.
Causal relationship (synchronous) between CEO pay and firm performance as follows: (1) CEO pay affects firm performance, (2) firm performance affects CEO pay or (3) both (1) and (2). Causal relationship (lagged) between CEO pay and firm t_1 and t_2 affects CEO pay in time t and (3) both (1) and (2).
The findings of this study indicate that there is a synchronous and lagged relationship between pay and performance. However, the direction of causality is mainly from pay to performance, and not vice versa. Standard and Poor’s ExecuComp data for the
year 2001 and 2002. The sample consisted of 2,601 CEO-year observations from 1,446 firms of 25 industries.
Regression analysis for cash compensation and total compensation. performance. Additionally, firms’ performance is a significant determinant of cash compensation for CEOs during the first three years of their work as CEOs and not significant for those with 15 years or more as the company’s
CEO. Both market-based and accounting-based performance measures are negatively correlated with CEOs’ total compensation regardless of length of experience. Largest industrial Companies in 1985-1986.
Capital Asset Pricing Model (Company Indicator Performance).
Descriptive statistic of top executive pay by Size (Sales, Assets and Number
Vol. 12, No. 3 (Jun., 1991), pp. 219-229
of Employees)
Regression of top executive pay by size and indicator
The sample for this study includes 16 firms with complete time series (i.e., 1948-90), for a total of 688 firm-years.
Bivariate near-VAR (vector auto- regression) of compensation and firm returns, which allows for the relationship of firm performance and CEO compensation. followed by larger subsequent responses, may explain the popular view that executives continue to be rewarded, even for poor performance
25 industries, and covers the period 1996-2002.
This study uses the ExecuComp database as the information
source. Regression analysis is used to test hypotheses that focus on firm size in terms of sales, market and accounting returns, and the number of firm employees.
METHODOLOGY Introduction
As state in the before, the purpose in this study is to examine and analyzed the relationship between Chief Executive Officer’s (CEO) and company performance. For this chapter, it describes the methodology that will used to conduct the study. In this chapter also provided the measurement scale on return on equity (ROE), return on assets (ROA), earning per share (EPS), net profit margin (NPM). Besides that, it’s also including the measurement of CEO compensation like salaries, bonus and others emoluments. The hypothesis, sampling method and data analysis will also be explained in this chapter.
Theoretical Framework
Previous studies have suggested that the CEO compensation differ according to the company, industry and compensation structure of the company. In addition, a range of economic and related variables that affected adjustment has also been identified in the previous study such as CEO related variable i.e. CEO age, job tenure etc. Although, previous studies have approached the study of the CEO compensation and company performance through the measurement of one or a limited number of variables, but our study are trying to examine and analyzed a range of variables that seem to affect the CEO compensation.
As mentioned earlier ROE is the measurement used in the previous studies performed. Attaway (2000) notes that ROE as a measurement of company measurement can be criticized as it may not indicate the true underlying performance of the CEO, since this figure can be easily manipulated to make the CEO look goods. Therefore, we have used the model that including return on asset (ROA), earning per share (EPS) and net profit margin (NPM). This model has been applied in previous studies by Murthy and Salter (1975), Akhigbe, Madura, and Tucker (1995); Hall and Liebman (1998). Earlier studies performed by Murthy and Salter (1975); Aupperle, Figler and Lutz (1991) and Madura, Martin and Jessel (1996) found no significant relationship between CEO compensation and changes in ROE. However, Veliyath and Bishop (1995) were able to distinguish that companies with high ROE reward their CEOs with higher compensation. Thus, these results encourage us to see whether other additional variables such as ROA, EPS and NPM had some significant role in the cash compensation for CEOs.
Hypothesis
Based on the above explanation, there are some hypotheses formulated in this study. They are:
H0 : There is no relationship between companies performances significantly related to CEO Compensation
H1 : There is relationship between companies performances significantly related to CEO Compensation.
Data Sampling
The sample of this study is consisting of companies listed on the KLSE. There are many listed companies in the KLSE with number exceeds 500 companies. Based on the population there are 30 companies were selected as a sample in order to study about the relationship between CEO compensation and company performance. The data applicable for our studies was found in the annual reports for each selected companies and it were used primarily to collect the CEO specific variables whereas all variable data during six years is calculated on an annual basis. The sampling is using the simple random sampling which the companies have an equal chance to being selected to participate in this study.
Chosen Variables
Company Performance Variables
The primary focus of this study is on the relationship between CEO compensation and company performance, although other factors are included in the model as independent variables. In this study, the company performance measures ROE, ROA, EPS and NPM are applied. Even though these are very commonly used performance measures.
CEO’s Compensation Variables
The CEO’s may be dependent on each individual’s characteristics as well as the specific factors of each company. In this study, we use two compensation measures
Independent Variable Dependent Variable
Earning per Share
Return on Equity
CEO Compensation Return on Asset
which are the compensation include the cash compensation taken from the base salary and from bonus and other emoluments.
Data analysis
The data collected will be analyzed using the statistical package for the social science (SPSS) 12.0. The data were summarizing using the appropriate descriptive and inferential statistic and the data collected were analyzed based on the hypotheses that develop in the first chapter. The analysis of each hypothesis as below:
1. Descriptive statistic
Descriptive statistics are used to explore the data collected and to summarise and describe those data. It may be particularly useful if the users want to make some general observations about the data collected. In addition, other statistics such as the minimum, maximum and mean will give more information about the distribution of each variable.
2. Regression ANOVA
Analysis of the effect of one treatment variable on an interval-sacled or ration-scaled dependent variable; a technique to determine if statistically significance differences in means occur between two or more group variables.
DISCUSSION
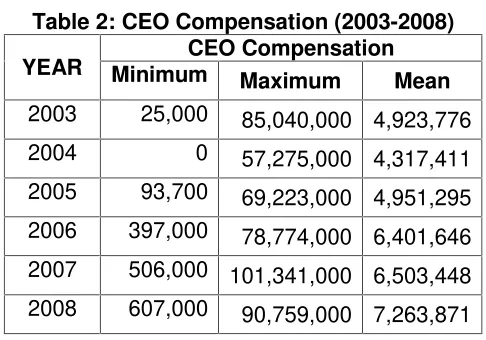
Analysis Statistic Descriptive
Table 2: CEO Compensation (2003-2008) YEAR MinimumCEO Compensation
Maximum Mean
2003 25,000 85,040,000 4,923,776
2004 0 57,275,000 4,317,411
2005 93,700 69,223,000 4,951,295
2006 397,000 78,774,000 6,401,646
2007 506,000 101,341,000 6,503,448
2008 607,000 90,759,000 7,263,871
Table 3: Earning Per Share (2003-2008)
YEAR Earning Per Share
Minimum Maximum Mean
2003 -44.57 108.00 19.57
2004 0.37 101.34 25.98
2005 -92.00 131.76 22.02
2006 -177.00 176.95 22.97
2007 -107.30 212.87 26.31
2008 0.06 80.40 26.98
The lowest minimum EPS for the last 6 years at amount -177 cent/share by BIMB in 2006. The highest maximum value for EPS given by Genting Berhad in 2007 at amount 212.87 cent/share. Even for 2008 provide the lowest maximum value, but the data above shown the highest mean at 26.98 cent/share. Its mean for Risk Averse Investor this is a good alternative to invest at 2008 in Malaysia.
Table 4: Return on Asset 2003-2008 YEAR Return on Asset (ROA)
Minimum Maximum Mean
2003 -0.08 0.92 0.12
2004 -0.18 0.11 0.04
2005 -0.10 0.13 0.04
2006 -0.07 0.57 0.08
2007 -0.08 0.93 0.09
2008 -0.07 0.17 0.06
The lowest minimum ratio ROA at -0.18 in 2004 by APEX. Its mean at loss-income situation, APEX has a large Total Asset. The highest maximum ratio at 0.93 at 2007, that’s mean there is a company that could maximized every single RM of Asset to get RM. 0.93 of return. And the trend is increase from 2004-2007 but decrease again in 2008.
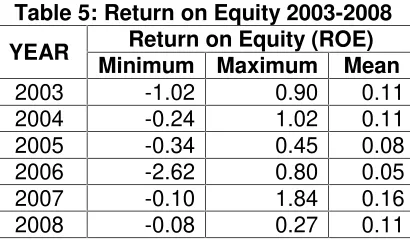
Table 5: Return on Equity 2003-2008 YEAR Return on Equity (ROE)
Minimum Maximum Mean
2003 -1.02 0.90 0.11
2004 -0.24 1.02 0.11
2005 -0.34 0.45 0.08
2006 -2.62 0.80 0.05
2007 -0.10 1.84 0.16
2008 -0.08 0.27 0.11
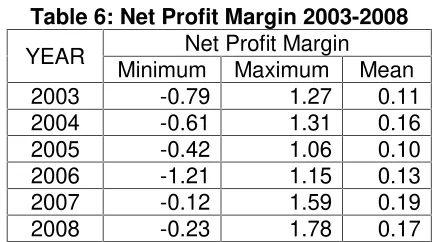
Table 6: Net Profit Margin 2003-2008
YEAR Net Profit Margin
Minimum Maximum Mean
2003 -0.79 1.27 0.11
2004 -0.61 1.31 0.16
2005 -0.42 1.06 0.10
2006 -1.21 1.15 0.13
2007 -0.12 1.59 0.19
2008 -0.23 1.78 0.17
The same phenomena in Net Profit Margin Ratio, the lowest minimum value at -1.21 in 2006. The positive trend for maximum value, even decrease in 2005 but keep increase until 2008. Its mean that the companies have a good trend to maximized their profit for sales they made. And the highest mean value at 2007 that affected by the best minimum value and the 2ndhighest maximum value in same year.
Regression Anova
An Analysis of Variance (ANOVA) use to examine the significant mean differences among more than two groups on an interval or ratio scaled dependent variable. The result of Anova show whether or not the means of various group are significantly different from one another, as indicated by f-statistic. The R2 is the amount of variance explained in the dependent variable by the predictors (Independent Variables). When the R2 , f statistic and significant level are known then we can interpret the result.
Regression Anova 2003
Analysis statistic for 2003 shows that there are 55% of the variance (dependent variable) has been significantly explained by the set of predictor (independent variable) since the sig value = 0.000 (less than 0.05). The statistic formula would be F(4,25) = 7.637; p< 0.05.
Regression Anova 2004
Analysis statistic for 2004 shows that there are 35.4% of the variance (dependent variable) has been significantly explained by the set of predictor (independent variable) since the sig value = 0.023 (less than 0.05). The statistic formula would be F(4,25) = 3.429; p< 0.05.
Regression Anova 2005
Analysis statistic for 2005 shows that there are 48.9% of the variance (dependent variable) has been significantly explained by the set of predictor (independent variable) since the sig value = 0.002 (less than 0.05). The statistic formula would be F(4,25) = 5.987; p< 0.05.
Analysis statistic for 2006 shows that there are 55.3% of the variance (dependent variable) has been significantly explained by the set of predictor (independent variable) since the sig value = 0.000 (less than 0.05). The statistic formula would be F(4,25) = 7.430; p< 0.05.
Regression Anova 2007
Analysis statistic for 2007 shows that there are 60.2% of the variance (dependent variable) has been significantly explained by the set of predictor (independent variable) since the sig value = 0.000 (less than 0.05). The statistic formula would be F(4,25) = 9.467; p< 0.05.
Regression Anova 2008
Analysis statistic for 2008 shows that the variance (dependent variable) has not been significantly explained by the set of predictor (independent variable) since the sig value = 0.716 (more than 0.05). The statistic formula would be F(4,25)=0.528; p> 0.05.
CONCLUSION
Maximum Value for CEO Compensation for the last 6 years given by Genting Berhad. Year 2008 is a good alternative for Risk Averse Investor to invest in Malaysia (mean eps). Analysis statistic by Regression Anova for 2003-2007 shows that the variance (dependent variable) has been significantly explained by the set of predictor (independent variable) since the significant value less than 0.05. Therefore the null hypothesis rejected. Analysis statistic by Regression Anova for 2008 shows that the variance (dependent variable) has not been significantly explained by the set of predictor (independent variable) since the significant value more than 0.05. Therefore the null hypothesis accepted.
Reference
Akhigbe, S., Madura, J., and Tucker, A.L., (1995), ”Reexamining the link between executive compensation and corporate performance: A note.” American Business Review, 13, 2-83.
Alistair W. Kerr, Howard K. Hall; Stephen A. Kozub; Doing Statistics With SPSS, 2002, SAGE Publications.
Attaway, M.C., (2000),“A study of the relationship between company performance and CEO compensation.”American Business Review, January: 77-85.
Augustine I. Duru and Raghavan J. Iyengar “Linking CEO Pay to Firm Performance: Empirical Evidence from the Electric Utility Industry” Managerial Finance Journal, Volume 25 Number 9 1999
Bebchuk, L. and J. Fried (2004). Pay without Performance. Cambridge, MA and London, England: Harvard University Press.
Brian G. M. Main, “Top Executive Pay and Performance”, Managerial and Decision Economics, Vol. 12, No. 3 (Jun., 1991), pp. 219-229
Giorgio Canarella, Arman Gasparyan, (2008) "New insights into executive compensation and firm performance: Evidence from a panel of “new economy” firms, 1996-2002",
Managerial Finance, Vol. 34 Iss: 8, pp.537 – 554
Hall, B.J. and Liebman, J.B., (1998), “Are CEOs really paid like bureaucrats?”Quarterly Journal of Economics, August: 653+
Henry L. Tosi, Jr. and Luis R. Gomez-Mejia, “CEO Compensation Monitoring and Firm Performance”, Organization Science, Vol. 15, No. 6 (Nov. - Dec., 2004), pp. 657-670 Holmstrom, B.: "Moral Hazard and Observability," Bell Journal of Economics, 10(1979),
74-91.
Ivan E. Brick, Oded Palmon and John K. Wald, “CEO Compensation, Director Compensation, and Firm Performance: Evidence of Cronyism?” JCF Special Issue on Corporate Governance, May 2005
Jensen, M. C. & Meckling, W. H. 1976. Theory of the firm: Managerial behavior, agency costs and ownership structure.Journal of Financial Economics,3,305-360
Jeremy J. Foster,Data Analysis Using SPSS for Windows: A Beginners Guide.1998, SAGE Publications.
John F. Boschen, Augustine Duru, Lawrence A. Gordon, Kimberly J. Smith,“Accounting and Stock Price Performance in dynamic CEO Compensation Arrangement”, The Accounting Review, Vol. 78, No. 1 (Jan., 2003), pp. 143-168
John F. Boschen and Kimberly J. Smith,“You Can Pay Me Now and You Can Pay Me Later: The Dynamic Response of Executive Compensation to Firm Performance” The Journal of Business, Vol. 68, No. 4 (Oct., 1995), pp. 577-608
Jonathan S. Leonard, “Executive Pay and Firm Performance”, Industrial and Labour Relations Review, Vol.43, No.3, Special Issue (Feb 1990).
Lawrence S. Tai, “Synchronous and lagged relationships between CEO pay and performance of quality companies” Managerial Finance Vol. 34 No. 8, 2008 pp. 555-561©Emerald Group Publishing Limited
Madura, J., Martin, A.D., and Jessel, K.A., (1996), “Determinants of CEO compensation in small publicly-traded businesses.”American Business Review, 14, 80-88.
Mahmoud M. Nourayi and Frank P. Daroca “CEO compensation, firm performance and operational characteristics” Managerial Finance Vol. 34 No. 8, 2008 pp. 562-584©
Emerald Group Publishing Limited
Mahmoud M. Nourayi and Steven M. Mintz “Tenure, firm’s performance, and CEO’s compensation” Managerial Finance Vol. 34 No. 8, 2008 pp. 524-536© Emerald Group Publishing Limited
R Thillainathan, A Review of Corporate Governance in Malaysia, (March 1999) Banker’s Journal,Kuala Lumpur 23, 44
Richard A. Lambert, David F. Larcker, Keith Weigelt, “How Sensitive is Executive Compensation to Organizational Size?”, Strategic Management Journal, Vol. 12, No. 5 (Jul., 1991), pp. 395-402