© The Author 2015. Published by Oxford University Press on behalf of the American Association for Public Opinion Research. All rights reserved. For permissions, please e-mail: [email protected]
DO ATTEMPTS TO IMPROVE RESPONDENT
ATTENTION INCREASE SOCIAL DESIRABILITY BIAS?
SCOTT CLIFFORD* JENNIFER JERIT
Abstract In this research note, we investigate the effectiveness of warnings as a method for increasing respondent motivation and decreas-ing survey satisficdecreas-ing. Four different styles of warndecreas-ing messages are examined in data from a randomized survey experiment conducted on the Internet. The analysis shows that three of the four warnings sig-nificantly improve respondent engagement. There is some evidence, however, that warning messages increase socially desirable respond-ing (SDR) for certain types of people. We conclude that warnrespond-ings can be a useful method for increasing attention, but that researchers should first establish that these protocol do not have unintended consequences, either for the entire sample or for theoretically relevant subgroups.
Social scientists increasingly collect data online through self-administered ques-tionnaires. However, these data can suffer from a variety of problems—e.g., no opinion responding, non-differentiation, acquiescence—in part because respond-ents may not pay attention as they answer a questionnaire (Krosnick 1991; Berinsky, Margolis, and Sances 2014). This study examines the effectiveness of warnings as a method for improving data quality in self-administered surveys. Generally speaking, warnings encourage respondents to follow instructions or to think carefully (Krosnick 2000). There is evidence that such messages can be effective (Huang et al. 2012), but warnings may increase social desirability pres-sures. Moreover, this effect may be concentrated among particular respondents, such as the highly educated, because of their greater overall tendency to offer socially desirable responses (Silver, Anderson, and Abramson 1986).
Scott Clifford is an assistant professor in the Department of Political Science at the University of Houston, Houston, TX, USA. Jennifer Jerit is an associate professor in the Department of Political Science at Stony Brook University, Stony Brook, NY, USA. The authors thank Jason Barabas, Adam Berinsky, John Bullock, Rosmery Cruz, Cindy Kam, Yanna Krupnikov, Thomas Leeper, Adam Seth Levine, Spencer Piston, Kathleen Searles, and Nick Valentino for helpful comments on earlier ver-sions of this paper. They also thank Bob Blaemire at Catalist for assistance with the validated data. *Address correspondence to Scott Clifford, University of Houston, Department of Political Science,
4800 Calhoun Rd., Houston, TX 77204, USA; e-mail: [email protected].
doi:10.1093/poq/nfv027
at SerialsCentralLibrary on December 8, 2015
http://poq.oxfordjournals.org/
Warning Messages and the Question-Answering Process
Satisficing occurs when respondents do “just enough to satisfy the survey request, but no more” (Krosnick 2000, 4). Warning messages seek to reduce the likelihood of satisficing by increasing respondent motivation to generate an optimal answer to survey questions.
Warnings have been adopted in recent studies (e.g., Press, Sagan, and Valentino 2013), but these protocols can have unintended consequences. In particular, warn-ings may heighten respondents’ sense of surveillance, increasing concern with self-presentation. People are less likely to report socially unacceptable behaviors when a third party (e.g., the interviewer) is present (Aquilino 1992; Tourangeau and Smith 1996). Even subtle cues—such as an image of “watching eyes”— can induce reputation-management concerns that manifest themselves in more socially desirable attitudes and behavior (e.g., Haley and Fessler 2005).
In addition, warnings may make socially desirable responding (SDR) more likely by increasing a person’s level of cognitive engagement with the ques-tionnaire. SDR is an effortful process (Tourangeau and Rasinski 1988), with individuals reaching a judgment but then “editing” their answer in response to social desirability concerns (Holtgraves 2004). Indeed, subjects who are also engaged in other tasks are less likely to engage in SDR (Riemer and Shavitt 2011). In this way, warnings may precipitate SDR through increased cognitive engagement. Based on the existing literature, we hypothesize that warning messages will boost respondent engagement (H1), but that they may inadvert-ently increase the likelihood of socially desirable responding (H2).
Some scholars view socially desirable responding as a “response strategy reflect-ing the sensitivity of specific items for specific individuals” (Tourangeau and Yan 2007, 860, emphasis added). Numerous studies have shown that the highly edu-cated are more likely to be aware of socially acceptable behavior and feel greater pressure to appear in conformity with social norms (e.g., Karp and Brockington 2005), especially on questions relating to political participation (Silver, Anderson, and Abramson 1986; Fullerton, Dixon, and Borch 2007; Ansolabehere and Hersh 2012). Thus, we expect that the effect of warnings on socially desirable respond-ing will be greatest for respondents with high levels of education (H3).
Experimental Design
We tested our hypotheses with a randomized experiment administered online through the Time-Sharing Experiments for the Social Sciences (TESS) plat-form (N = 1,168). The study was a between-subjects design with four warning conditions and a control group.1 In the first treatment condition (“Audit”), the message implicitly invokes the researcher:
1. Knowledge Networks (KN) conducted the survey November 8–22, 2012. The recruitment rate (RECR) was 14.7 percent, the profile rate (PROR) was 65.1 percent, and the study-specific com-pletion rate (COMR) was 67.7 percent, for a cumulative response rate of 6.1 percent (RECR x PROR x COMR; Callegaro and DiSogra [2008]).
at SerialsCentralLibrary on December 8, 2015
http://poq.oxfordjournals.org/
We check responses carefully in order to make sure that people have read the instructions for the task and responded carefully. We try to only use data from participants who clearly demonstrate that they have read and understood the survey. Again, there will be some very simple questions in what follows that test whether you are reading the instructions. If you get these wrong, we may not be able to use your data. Do you understand?
The second condition (“Anonymity”) is identical to the first, but the warning includes a reminder that responses will remain anonymous (see the appen-dix for complete wording). There is evidence that such assurances can boost response rates and reduce misreporting on sensitive items (e.g., Singer, Von Thurn, and Miller 1995; Tourangeau and Yan 2007). Thus, the second treat-ment has all the satisficing-reducing properties of the original warning along with language intended to alleviate social desirability concerns (but see Lelkes et al. [2012]).
The third treatment (“Commitment”) builds on research showing that peo-ple seek to be consistent with their previous commitments (Cialdini et al. 1978; Cannell, Miller, and Oskenbeurg 1981). In this condition, the stimulus reads “It is important to us that participants in our survey pay close attention to the materials. Are you willing to carefully read the materials and answer all of the questions to the best of your ability?” and provides “Yes” or “No” responses. The fourth treatment (“Feedback”) appeals to respondents’ desire for self-insight by providing feedback on their performance at the end of the questionnaire (Gosling et al. 2004). The stimulus states: “Many of our partici-pants have expressed interest in the results of our surveys. In order to provide you with this information, at the end of the survey you will be shown how your opinions on various topics compare to the nation as a whole.” Opt-in online surveys that motivate participation through the promise of feedback have become common in psychology, but there has been little analysis of whether such promises affect responses. The fifth condition is a control group in which respondents do not view any message. The outcome measures consist of ques-tions designed to capture SDR and attention (figure A1 of the supplementary data online shows a schematic of the design).
To identify SDR, we used questions previously identified as being sensitive to social desirability bias (e.g., Presser and Stinson 1998; Chen, Lee-Chai, and Bargh 2001; Holbrook, Green, and Krosnick 2003; Streb et al. 2008). The question wording is shown in the appendix, but in brief, we included items in which there was a strong expectation of socially desirable responding (e.g., the racial resentment scale) along with questions where the effects may be more muted (e.g., texting while driving), as well as instances where SDR was expected to result in overreporting (e.g., religious attendance) and under-reporting (e.g., receiving government assistance). These design features help establish the range of effects that might occur in studies utilizing warnings. A frequently noted limitation of research on socially desirable responding is
at SerialsCentralLibrary on December 8, 2015
http://poq.oxfordjournals.org/
the lack of validation data (i.e., the researcher assumes that any shift toward the desirable attitude is evidence of SDR). Working with a commercial ven-dor (Catalist), we obtained behavioral data for two of our outcomes (registra-tion status and 2010 vote). The validated data provide a benchmark against which we can assess the accuracy of the self-reported measures, allowing us to more firmly establish whether socially desirable responding is taking place (Kreuter, Presser, and Tourangeau 2008).
We measure attention with two instructional manipulation checks (IMCs), located in the middle and end of the questionnaire (Oppenheimer, Meyvis, and Davidenko 2009; Berinsky, Margolis, and Sances 2014). IMCs look similar to other survey items, but the question instructs respondents to ignore the standard response format and to select a particular option(s). A respondent “fails” an IMC when he or she answers the question sincerely, which happens if a person has skimmed or ignored the question stem. In addition to the IMCs, we examined the frequency of item nonresponse and time spent on the survey as indicators of respondent engagement. Item nonresponse was operationalized as the number of items a person skipped. Length of time was operationalized as the log of the aver-age for each question (excluding warnings and both IMCs), with outliers recoded to three standard deviations above the mean prior to creating the index. Insofar as warnings increase motivation, they should reduce item nonresponse, but increase the time spent answering questions and the passage rate on the IMCs.2
Results
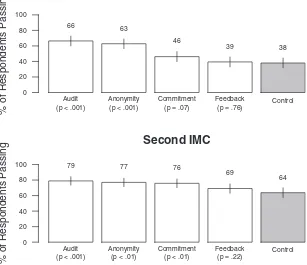
Figure 1 shows the percentage of people passing the first and second IMCs across experimental conditions. Beginning with the gray bar, only 38 percent of respondents in the control group passed the first IMC. Three of the four warnings result in a statistically significant increase in passage rates, with effect sizes ranging from 8 percentage points (Commitment) to approximately 27 percentage points (Audit, Anonymity). Chi-square tests indicate that Audit and Anonymity both have larger effects than Feedback and Commitment (p < .01; all tests two-tailed unless indicated otherwise).
On the second IMC (bottom panel), a similar pattern emerges, with the same three warnings resulting in a statistically significant increase in passage relative to the control condition (all ps < .01). Effect sizes range from 12 to 15 percentage points.
Summarizing across the indicators of attention, Audit had the most con-sistent effect: it increased IMC passage (p < .01) and time spent on the survey (p < .05), and decreased item nonresponse (p = .05).3 Anonymity had similar but slightly smaller effects. That message type increased IMC
2. IMC passage is associated with longer survey time and lower item nonresponse (both ps < .001).
3. The results for the model predicting IMC passage and for the analyses of item nonresponse and time spent taking the survey are shown in the supplementary data online (table A1).
at SerialsCentralLibrary on December 8, 2015
http://poq.oxfordjournals.org/
passage and decreased item nonresponse (p < .01 and p < .05, respectively), but it had no effect on time spent on the survey. Commitment improved performance on the IMC (p = .07), but had null effects for time spent on the survey and item nonresponse. Finally, the promise of feedback had no effects on any of our indicators of attention. As we elaborate below, the Feedback warning had other unintended consequences that recommend against its use.
Three of the four warnings improve performance on IMCs, and one warn-ing in particular (Audit) increased engagement on all three measures of atten-tion. The next series of analyses investigates whether these messages have any adverse effects. Our indicator of SDR is whether the respondent provided the socially desirable response (coded 1; 0 otherwise) on the seven items in our questionnaire (e.g., saying that one voted in the 2010 election or expressing racially liberal attitudes).
Figure 1. Performance on Instructional Manipulation Checks. Figure shows percentage of respondents “passing” each instructional manipulation check by experimental condition. Reported p-values (two-tailed) come from a chi-square test comparing each treatment condition to the control.
at SerialsCentralLibrary on December 8, 2015
http://poq.oxfordjournals.org/
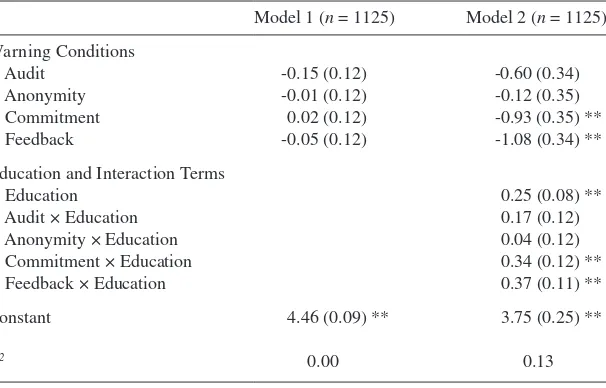
In analyses in which each outcome is analyzed separately, none of the warn-ings consistently increase average levels of SDR (see table A2 in the supple-mentary data online). We then created a summary measure representing the number of socially desirable answers given by a respondent. Table 1 shows the results of a regression model predicting this summary measure as a function of treatment condition.
Focusing on the first column of results (model 1), the top portion of table 1 shows the coefficients on the treatment indicators. Contrary to H2, there are no significant main effects for any of the warning messages on SDR.
Our third hypothesis predicts that the effects of warnings on SDR will be concentrated among the highly educated, which we test with an interaction between the treatment indicators and a four-point ordinal measure of edu-cation (1 = did not finish high school; 4 = bachelor’s degree or higher). As expected, there are statistically significant interactions between education and the Commitment and Feedback warnings (ps < .01). In both cases, the warn-ings led highly educated respondents to report .4 additional SDR responses (ps = .02).4 Table 1 also shows that three of the four warnings decreased socially desirable responding among the least educated, a pattern that may
4. Alternative models (e.g., repeated measures, count models) yielded similar results. For some of our questions, the socially desirable response is also the acquiescent response. We find a similar
pattern of results with an item for which the acquiescent response is the undesirable response
(Text Messaging in table A2).
Table 1. OLS Model Predicting Number of Socially Desirable Responses
Model 1 (n = 1125) Model 2 (n = 1125)
Warning Conditions
Audit -0.15 (0.12) -0.60 (0.34)
Anonymity -0.01 (0.12) -0.12 (0.35)
Commitment 0.02 (0.12) -0.93 (0.35) **
Feedback -0.05 (0.12) -1.08 (0.34) **
Education and Interaction Terms
Education 0.25 (0.08) **
Audit × Education 0.17 (0.12)
Anonymity × Education 0.04 (0.12)
Commitment × Education 0.34 (0.12) **
Feedback × Education 0.37 (0.11) **
Constant 4.46 (0.09) ** 3.75 (0.25) **
R2
0.00
0.13
Note.—Dependent variable is the number of socially desirable attitudes reported across the seven outcome measures. Education ranges from 1 (did not finish high school) to 4 (bachelor's degree or higher).
** p < .01 two-tailed. Standard errors in parentheses.
at SerialsCentralLibrary on December 8, 2015
http://poq.oxfordjournals.org/
indicate more accurate reporting among this subgroup. We return to this find-ing in our discussion of the behavioral data.
While the warnings may have increased socially desirable respond-ing among the educated, an alternative explanation is that the treatment increases accuracy among all respondents, since a person’s level of edu-cation is associated with holding the socially desirable attitude. The vali-dated data will help determine whether warning messages are causing the well educated to give more accurate, as opposed to more socially desirable, opinions. We focus on overreporting, which occurred if someone reported being registered/voting in the KN survey but was validated to be unregis-tered or to have not voted.
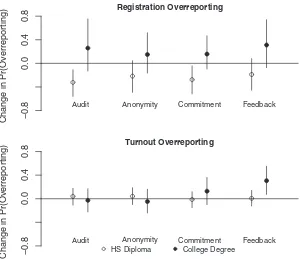
We predict overreporting on registration status and 2010 vote with a probit model. Because people who have engaged in either activity cannot overreport, we limit our attention to respondents who were unregistered or who did not vote in the 2010 general election according to administrative records (n = 163 and 565, respectively). The dependent variable takes on a value of “1” if some-one overreports being registered/voting, and a value of “0” if a respondent accurately reports not being registered/not having voted. In our sample, 39 percent of those who are not registered to vote reported being registered, while 34 percent of those who did not vote reported voting. Once again, we pre-dict overreporting with the treatment indicators and the treatment X education interactions. Consistent with table 1, there is a statistically significant interac-tion for three of the four warnings in the registrainterac-tion model and a statistically significant interaction for the Feedback warning in the vote model (all p < .05; see the supplementary data online for model estimates). The marginal effects from the model appear in figure 2 (shown separately for respondents with a high school diploma and a college degree).
The estimates represent the marginal effect of the warnings on the likeli-hood of overreporting, relative to the control condition. The error bars are large because of the small number of respondents, but the pattern is consistent with earlier results. Warning messages have a disproportionate effect on the highly educated, and this pattern is most dramatic in the Feedback condition (31-point increases in overreporting registration and voting; p = .11 and p < .05, respectively).5 Additionally, we find some evidence that the treatments decreased overreporting of registration among the less educated. Consistent with table 1, warnings seem to have increased accuracy among the least edu-cated. The result was unexpected, but it may reflect increased attention among a subgroup unlikely to exhibit socially desirable responding.
Warnings have two contrasting effects: increased overreporting among the well educated as well as decreased overreporting among the less educated. The net result is an inflation of the correlation between education and turnout.
5. We observe null effects in models predicting underreporting at all levels of education, lending
further support to the social desirability interpretation (see supplementary data online).
at SerialsCentralLibrary on December 8, 2015
http://poq.oxfordjournals.org/
According to the validated data, the “true” correlation between registration status and education is .15 (p < .001). Looking at the self-reported data, the analogous correlation is .12 in the control group and ranges from .25 to .36 in the treatment conditions. Likewise, the correlation between the validated measure of 2010 vote and education is .22 (p < .001). By contrast, in the KN data, the correlation between 2010 vote and education is .13 in the control group and ranges from .17 to .42 in the treatment conditions. Even if warn-ings do not affect mean levels of a dependent variable, they may artificially strengthen or weaken its association with key independent variables.
Conclusion
Warnings are a useful tool because they seek to improve motivation at the outset of a survey, as opposed to the post hoc exclusion of people who pay
Registration Overreporting
Change in Pr(Ov
errepor
ting)
−0.8
0.0
0.4
0.8
Audit Anonymity Commitment Feedback
Turnout Overreporting
Change in Pr(Ov
errepo
rt
ing)
−0.8
0.
00
.4
0.8
Audit Anonymity Commitment Feedback
HS Diploma College Degree
Figure 2. Analysis of Overreporting on Vote and Registration. Estimates from models predicting overreporting on vote and registration questions among respondents who did not vote/were not registered to vote. The figure displays the estimated marginal effect of each warning condition relative to the control condition. Open circles represent effects for those earning only a high school diploma, and filled circles represent effects for those earning a college degree. Bars represent 95 percent confidence intervals. See text for model details.
at SerialsCentralLibrary on December 8, 2015
http://poq.oxfordjournals.org/
insufficient attention (e.g., Maniaci and Rogge 2014). At the same time, warn-ing messages increase socially desirable respondwarn-ing for certain people, so researchers should first establish that these protocols do not have unintended consequences for theoretically relevant subgroups.
Our analysis illustrates that researchers must also consider how attention is manipulated. The Audit message had the most consistent effect across the var-ious indicators of attention. Given recent evidence that anonymity messages may decrease the accuracy of people’s responses (Lelkes et al. 2012) and gen-erally smaller effects for the Commitment warning, the Audit message appears to be most effective at increasing respondent motivation. The Feedback mes-sage did little to increase respondent engagement, and it also had some of the strongest effects on the overreporting of socially desirable behaviors. Psychologists have collected data from hundreds of thousands of people using variants of the feedback message (e.g., at websites like Project Implicit and YourMorals.org), yet it was the most reactive of the warnings we studied. The promise of feedback may be an effective way to recruit subjects, but the source of motivation (desire for self-insight) may compromise the accuracy of the measures by heightening respondents’ sensitivity to their own responses.
Appendix
Question Wording
[Respondents randomly assigned into one of five conditions: an untreated con-trol group or one of the four experimental groups shown below.]
Treatment Condition 1: Audit6
We check responses carefully in order to make sure that people have read the instructions for the task and responded carefully. We will only accept par-ticipants who clearly demonstrate that they have read and understood the survey. Again, there will be some very simple questions in what follows that test whether you are reading the instructions. If you get these wrong, we may not be able to use your data. Do you understand?
Yes, I understand; No, I do not understand.
Treatment Condition 2: Anonymity
We check responses carefully in order to make sure that people have read the instructions for the task and responded carefully. Your responses are anonymous,
6. The inspiration for the Audit warning language comes from an earlier version of the Berinsky, Margolis, and Sances (2014) paper and personal communication with the lead author. Three of the treatments included a question as part of the warning. In the Audit condition, three people (1 percent) responded “don’t understand” and one skipped the question. In the Anonymity group, four people (2 percent) said “don’t understand” and one skipped. In the Commitment condition, three people (1 percent) said “No” and none refused.
at SerialsCentralLibrary on December 8, 2015
http://poq.oxfordjournals.org/
but we will only accept participants who clearly demonstrate that they have read and understood the survey. Again, there will be some very simple ques-tions in what follows that test whether you are reading the instrucques-tions. If you get these wrong, we may not be able to use your data. Do you understand?
Yes, I understand; No, I do not understand.
Treatment Condition 3: Commitment
It is important to us that participants in our survey pay close attention to the materials. Are you willing to carefully read the materials and answer all of the questions to the best of your ability?
Yes; No
Treatment Condition 4: Feedback
Many of our participants have expressed interest in the results of our surveys. In order to provide you with this information, at the end of the survey you will be shown how your opinions on various topics compare to the nation as a whole.
[Subjects in Condition 4 will receive an additional message regarding their feedback at the end of the study. Their responses were compared to a national average on select items from the survey (i.e., the treatment was administered without deception).]
Condition 5: Control
No text
1. Are you currently registered to vote?
Yes, I am registered to vote at my present address; Yes, I am registered to vote at a different address; No, I am not registered to vote; I am not sure.
2. Did you happen to vote in the 2010 Congressional election?
Yes; No
3. If your party nominated a generally well-qualified person for president who happened to be a homosexual, would you vote for that person?
Yes, would; No, would not
[A random half of the respondents receive question 4 before the Racial Resentment battery (questions 5a–5c); the other half receive question 4 after the Racial Resentment battery.]
at SerialsCentralLibrary on December 8, 2015
http://poq.oxfordjournals.org/
4. Instructional Manipulation Check #1
We are also interested in what sections people like to read in the newspaper. What people read in the paper might affect their opinions on current events. We also want to see if people are reading the questions carefully. To show that you’ve read this much, please mark both the “Classified” and “None of the above” boxes below. That’s right, just select these two options only.
Regardless of how frequently you read the newspaper, what would you say are your favorite newspaper sections to read? Please check all that apply.
National; Local; Classified; Sports; Business; Science and Technology; Opinion; None of the above
5. To what extent do you agree or disagree with the following statement (Strongly agree; Agree; Slightly agree; Neither agree nor disagree; Slightly disagree; Disagree; Strongly disagree):
a. The Irish, Italians, Jews, Vietnamese, and other minorities overcame prejudice and worked their way up. Blacks should do the same with-out any special favors.
b. It’s really a matter of some people not trying hard enough; if blacks would only try harder they could be just as well off as whites. c. Generations of slavery and discrimination have created conditions that
make it difficult for blacks to work their way out of the lower class.
6. And now just a few questions about you…In the past seven days, have you sent or read a text message while driving?
Yes; No
7. Have you or members of your immediate family ever received any of the following forms of governmental assistance? Please check all that apply.
Unemployment insurance; Medicare; Medicaid; Government-subsidized housing; Welfare; Food stamps; None of the above
8. How often do you attend religious services?
More than once a week; Once a week; A few times a year; Once a year or less; Never
9. Questions sometimes have different effects on people. We’d like your opin-ions about the questopin-ions in this survey. How likely is it that any of the ques-tions might make people feel as if they are being watched or monitored?
Extremely likely; Very likely; Moderately likely; Not too likely; Not at all likely
at SerialsCentralLibrary on December 8, 2015
http://poq.oxfordjournals.org/
10. Instructional Manipulation Check #2
Most modern theories of decision-making recognize the fact that decisions do not take place in a vacuum. Individual preferences and knowledge, along with situational variables, can greatly impact the decision process. In order to facilitate our research on decision-making, we are interested in whether you actually take the time to read the directions. So, rather than answering the fol-lowing question accurately, please check only “Mauritania” and “None of the above” and then continue. This will demonstrate to us that you have taken the time to read and follow the instructions.
Which of the following countries have you heard mentioned in the news in the last week?
(Please check all that apply.)
France; Germany; Switzerland; Mauritania; Syria; Iran; Canada; Mexico; None of the above
Supplementary Data
Supplementary data are freely available online at http://poq.oxfordjournals.org/.
References
Ansolabehere, Stephen, and Eitan Hersh. 2012. “Validation: What Big Data Reveal about Survey
Misreporting and the Real Electorate.” Political Analysis 20:437–59.
Aquilino, William S. 1992. “Telephone Versus Face-to-Face Interviewing for Household Drug
Use Surveys.” International Journal of the Addictions 27:71–91.
Berinsky, Adam J., Michele Margolis, and Michael Sances. 2014. “Separating the Shirkers from
the Workers? Making Sure Respondents Pay Attention on Internet Surveys.” American Journal
of Political Science 58:739–53.
Callegaro, Mario, and Charles DiSogra. 2008. “Computing Response Metrics for Online Panels.”
Public Opinion Quarterly 72:1008–1032.
Cannell, Charles F., Peter V. Miller, and Lois Oskenbeurg. 1981. “Research on Interviewing
Techniques.” Sociological Methodology 12:389–437.
Chen, Serena, Annette Y. Lee-Chai, and John A. Bargh. 2001. “Relationship Orientation as a
Moderator of the Effects of Social Power.” Journal of Personality and Social Psychology
80:173–87.
Cialdini, Robert B., John T. Cacioppo, Rodney Bassett, and John A. Miller. 1978. “Low-Ball
Procedure for Producing Compliance: Commitment Then Cost.” Journal of Personality and
Social Psychology 36:463–76.
Fullerton, Andrew W., Jeffrey C. Dixon, and Casey Borch. 2007. “Bringing Registration into
Models of Vote Overreporting.” Public Opinion Quarterly 71:649–60.
Gosling, Samuel D., Simine Vazire, Sanjay Srivastava, and Oliver P. John. 2004. “Should We Trust Web-Based Studies? A Comparative Analysis of Six Preconceptions about Internet
Questionnaires.” American Psychologist 59:93–104.
Haley, Kevin J., and Daniel M. T. Fessler. 2005. “Nobody’s Watching? Subtle Cues Affect
Generosity in an Anonymous Dictator Game.” Evolution and Human Behavior 26:245–56.
at SerialsCentralLibrary on December 8, 2015
http://poq.oxfordjournals.org/
Holbrook, Allyson L., Melanie C. Green, and Jon A. Krosnick. 2003. “Telephone vs. Face-to-Face Interviewing of National Probability Samples with Long Questionnaires: Comparisons of
Respondent Satisficing and Social Desirability Bias.” Public Opinion Quarterly 67:79–125.
Holtgraves, Thomas. 2004. “Social Desirability and Self-Reports: Testing Models of Socially
Desirable Responding.” Personality and Social Psychology Bulletin 30:161–72.
Huang, Jason L., Paul G. Curran, Jessica Keeney, Elizabeth M. Poposki, and Richard P. DeShon.
2012. “Detecting and Deterring Insufficient Effort Responding to Surveys.” Journal of Business
and Psychology 27:99–114.
Karp, Jeffrey A., and David Brockington. 2005. “Social Desirability and Response Validity:
A Comparative Analysis of Overreporting Turnout.” Journal of Politics 67:825–40.
Kreuter, Frauke, Stanley Presser, and Roger Tourangeau. 2008. “Social Desirability Bias in CATI,
IVR, and Web Surveys.” Public Opinion Quarterly 72:874–65.
Krosnick, Jon A. 1991. “Response Strategies for Coping with the Cognitive Demands of Attitude
Measures in Surveys.” Applied Cognitive Psychology 5:213–36.
———. 2000. “The Threat of Satisficing in Surveys: The Shortcuts Respondents Take in
Answering Questions.” Survey Methods Newsletter 20:4–8.
Lelkes, Yphtach, Jon A. Krosnick, David M. Marx, Charles N. Judd, and Bernadette Park. 2012.
“Complete Anonymity Compromises the Accuracy of Self-Reports.” Journal of Experimental
Social Psychology 48:1291–1299.
Maniaci, Michael R., and Ronald D. Rogge. 2014. “Caring about Carelessness: Participant
Inattention and Its Effects on Research.” Journal of Research in Personality 48:61–83.
Oppenheimer, Daniel, Tom Meyvis, and Nicolas Davidenko. 2009. “Instructional Manipulation
Checks: Detecting Satisficing to Increase Statistical Power.” Journal of Experimental Social
Psychology 45:867–72.
Press, Daryl G., Scott D. Sagan, and Benjamin A. Valentino. 2013. “Atomic Aversion: Experimental
Evidence on Taboos, Traditions, and the Non-Use of Nuclear Weapons.” American Political
Science Review 107:188–206.
Presser, Stanley, and Linda Stinson. 1998. “Data Collection Mode and Social Desirability Bias in
Self-Reported Religious Attendance.” American Sociological Review 63:137–45.
Riemer, Hila, and Sharon Shavitt. 2011. “Impression Management in Survey Responding: Easier
for Collectivists or Individualists?” Journal of Consumer Psychology 21:157–68.
Silver, Brian D., Barbara A. Anderson, and Paul A. Abramson. 1986. “Who Overreports Voting?”
American Political Science Review 80:613–24.
Singer, Eleanor, Dawn R. Von Thurn, and Esther R. Miller. 1995. “Confidentiality Assurances and
Response: A Quantitative Review of the Experimental Literature.” Public Opinion Quarterly
59:66–77.
Streb, Matthew J., Barbara Burrell, Brian Frederick, and Michael A. Genovese. 2008. “Social
Desirability Effects and Support for a Female American President.” Public Opinion Quarterly
72:76–89.
Tourangeau, Roger, and Kenneth A. Rasinski. 1988. “Cognitive Processes Underlying Context
Effects in Attitude Measurement.” Psychological Bulletin 103:299–314.
Tourangeau Roger, and Tom W. Smith. 1996. “Asking Sensitive Questions: The Impact of
Data Collection Mode, Question Format, and Question Context.” Public Opinion Quarterly
60:275–304.
Tourangeau, Roger, and Ting Yan. 2007. “Sensitive Survey Questions.” Psychological Bulletin
133:859–83.
at SerialsCentralLibrary on December 8, 2015
http://poq.oxfordjournals.org/