CHAPTER III RESEARCH METHOD
This chapter explained research design, research type, population and
sample, data collection, research instrument, and data analysis.
A. Research design
The research design used correlation design, this design afforded to
measuring the degree of interdependence between two variable correlation studies
related to the correlation scoring between two or more variable. This study
involved the measurement of the correlation degree.1 In this study, The research
design used correlation design, this design afforded to measuring the degree of
interdependence between two variable correlation studies. There are synonym
context clues (X) and Reading Comprehension (Y).
B. Type of the study
The research used quantitative method that the design purposed to explain
and to know about the correlation between synonym context clue and reading
comprehension of English study program students of IAIN Palangka Raya.
C. Population and Sample 1. Population
According to Donald Ary, „a population is defined as all members of any
well-defined class of people, events or objects.2 Population was the generalization
that occurred over the subject/object: had certain qualities and characteristics set
1
Syamsudin and vismaia S. Damaianti, metode pendidikan bahasa, Bandung : rosda,2006,p.25
2
. Donal Ary(et...all)Introduction to Research in Education, p.129.
by the writers to learn and drawn the conclusion.3In this study, Population of this
research was all students of English study program at State Islamic Institute there
were three reading classes of English study program where each class has 20-25
students. Total class and students may see on the table below:
Table 3.1
The population at third semester IAIN Palangka Raya
Reading Class Total students
A 16
B 16
C 13
∑= 45
2. Sample
The writer used a sample from population above as probability sampling, so
probability sampling defined as the kind of sampling in which every element in
the population had an equal chance of being selected. The possible inclusion of
each population element in this kind of sampling took place by chance and was
attained through random selection.4
The best known of the probability sampling procedures was sample
random sampling. The basic characteristic of simple random sampling was that all
members of the population had an equal and independent chance of being
included in the random sample.5Based on the understanding of simple random
sampling the writer took class B as the sample class and class C as the
tryout class with the number 28 students.
3
Sugiono, metode penelitian kuantitatif kualitatifdan R & D, Bandung: Alfabeta:2009, p.80
4
Donald Ary, Lucy Cheser Jocorbs, Chis Sorenses&AsgharRazavieh, Introduction to Research in Education, Canada:Nelson Education,2010,8th ed. P 150
5
Table 3.2
Number of population of at third semester of IAIN Palangka Raya.
No Class Total students
1 B 15
2 C 13
∑=28
From the data sample above, the writer implemented the try out in class C.
To measure the validity of the items. The items consisted of 50 items. The item
divided into 25 synonym context clue and reading comprehension 25 items.
D. Data Collection Procedure
The function of data collection was to determine that result of the research.
The writer took some procedures in collecting data, they were :
1. Preparing the instruments to try out. The writer gave test toward the
students. The test consisted 50 multiple chaise test (a, b , c, and d).
2. Giving the try out test to the students, Thursday, September 22, 2016, at
3.15 PM in IAIN Palangka Raya.
3. Analyzing the reliability and validity of the try out test. The writer
analyzed the data obtained into calculation. to calculate the data, the writer
used SPSS calculation and Manual calculation.
4. Giving the synonym context clue test and then the reading comprehension
test to the sample class. The writer gave test toward the students. The
test consisted 40 multiple chaise test (a, b , c, and d).The items consisted
of 40 items. From 40 items divided into 20 reading comprehension and 20
5. Collecting the students‟ synonym context clue test scores and their reading comprehension test scores. Totally 50 items divided into 25
reading comprehension and 25 synonym context clue items.
6. Analyzing the data by using Pearson Product Moment to answer the
problem of the study. The writer analyzed the data obtained into
calculation. to calculate the data, the writer used SPSS calculation and
Manual calculation. To analyzing the data helped by scatter plot using
SPSS Program.
7. Interpreting the result of analyzing data. Based on the SPSS calculation
and Manual calculation.
8. Concluding the data.
Table 3.3 The sources of the data and the data needed No Source of
data
Instrument Data Needed
1 Students‟ Answer sheets
Synonym context clue Test
The students‟ scores of
synonym context clue test
2 Students‟ Answer sheets
Reading Comprehension Test
The students‟ scores of
reading comprehension test
E. Research Instruments
Before analyzing the data, the writer collected the data. The main
components of the technique of collecting the data are follows:
1. Research Instruments
The test of synonym context clue is intended to collect the data about
students‟ vocabulary mastery. The test is an objective test in the form of
multiple-choice. There were 40 items of questions. From 40 items divided into 20
synonym context clue items ( 6 inferential and 4 literal ). The blueprint and the
objectives test of vocabulary can be seen at Appendices 3
The final score is calculated:
𝑠𝑡𝑢𝑑𝑒𝑛𝑡’𝑠𝑐𝑜𝑟𝑟𝑒𝑐𝑡𝑎𝑛𝑠𝑤𝑒𝑟
𝑡ℎ𝑒𝑛𝑢𝑚𝑏𝑒𝑟𝑜𝑓𝑖𝑡𝑒𝑚 𝑥 100
b. The test of Reading Comprehension
The test of reading comprehension is intended to collect the data about the
students‟ reading comprehension. The test is an objective test in the form of
multiple-choice type. There are four alternatives in each item. There were 40
items of question. From 40 items divided into 20 reading comprehension items
( 11 inferential and 9 literal ) The blueprint and the objective test of reading
comprehension can be seen at Appendices 3
The final score is calculated:
𝑠𝑡𝑢𝑑𝑒𝑛𝑡’𝑠𝑐𝑜𝑟𝑟𝑒𝑐𝑡𝑎𝑛𝑠𝑤𝑒𝑟
𝑡ℎ𝑒𝑛𝑢𝑚𝑏𝑒𝑟𝑜𝑓 𝑖𝑡𝑒𝑚 𝑥 100
2. Validity and Reliability
Validity is defined as the extent to which on a test enable score one to make
meaningful and appropriate interpretation.6 Validity is the most important
consideration in developing and evaluating measuring instrument. Face Validity
is taken to ensure that the questionnaire is valid. Face validity is a term
sometimes used in connection with a test‟s content. Face validity refers to the
extent to which examinnes believe the instrument is measuring what it is
supposed to measure.7Construct Validity Contract validity is type of validity
which assumes the existence of certain learning theories or contracts underlying
the acquaisition of ability and skill.8
According to Donal Ary, “ Reliability is concerned with the effect of error on the consistency of scores. Reliability is consistent in measuring whatever it is
measuring.9 The reliability of a measuring instrument is the degree of consistency
with which it measures whatever it is measuring. on a theoretical level, reliability
is concerned with the effect or error on the consistency of scores.10
In the reliability of an instrument quantitative research described statistically
by using the correlation calculation by searching for " coefficient " which ranges
between 0 and 1. When coefficient close to 1 , the instruments have high
reliability.11
The good instrument in a study was not only the instrument valid but also
realiable to measure what suppose measured. The analysis used several formulas
that used to measure the realibility.12 To measure the realibility test, the writer
used the Kuder Richardson (KR20) and the formula as follow :
3. Instruments Try Out
7Ibid,. p.228
8
J.B. Heaton, Writing English Language test, Longman, 1974, p. 154
9
Donal Ary, Introduction to Research In Introduction, secon edition, New York: Wardsworth/Thomson Learning, 1974, P. 237
10
Donald Ary, Lucy Cheser Jacobs, Chris Sorensen, and Asghar Razavieh, Introduction to Research in Education, Canada: Wadsworth, 2010, p.237
11
Prof. Dr. M.Soenardi Djiwandono,2008,TesBahasa, Indonesia:PTmacanan Jaya Cemerlang, P 170.
12
Try out is used to meansure the suitability of the test and the students‟ ability in the sample class of this study, so the writer conducted a try out test.
The writer chose the students in the try out test and collected the students‟
answer for giving scores, and analyzed the score to get the instruments reliability
and validity of test. There were two kinds of test that had been given to students,
both were synonym context clue test and reading comprehension test in one paper.
The synonym context clue test consisted of 25 items and reading comprehension
25 items in form of multiple choices on the time allocation for answering the test
was 55 minutes. The try out test was at the third semester students at English
education study program of IAIN Palangka Raya, it class C with 13 students.
Before analyzing the data, the writer collected the data. The main
components of the technique of collecting the data are follows:
a. The test of synonym context clue
The test of synonym context clue is intended to collect the data about
students‟ vocabulary mastery. The test is an objective test in the form of
multiple-choice. There were 40 items of questions. From 50 items divided into 25
reading comprehension and 25 synonym context clue items. The blueprint and the
objectives test of vocabulary can be seen at Appendices 2.
The final score is calculated:
𝑠𝑡𝑢𝑑𝑒𝑛𝑡’𝑠𝑐𝑜𝑟𝑟𝑒𝑐𝑡𝑎𝑛𝑠𝑤𝑒𝑟
𝑡ℎ𝑒𝑛𝑢𝑚𝑏𝑒𝑟𝑜𝑓𝑖𝑡𝑒𝑚 𝑥 100
The test of reading comprehension is intended to collect the data about the
students‟ reading comprehension. The test is an objective test in the form of
multiple-choice type. There are four alternatives in each item. The blueprint and
the objective test of reading comprehension can be seen at Appendices 3
The final score is calculated:
𝑠𝑡𝑢𝑑𝑒𝑛𝑡’𝑠𝑐𝑜𝑟𝑟𝑒𝑐𝑡𝑎𝑛𝑠𝑤𝑒𝑟
𝑡ℎ𝑒𝑛𝑢𝑚𝑏𝑒𝑟𝑜𝑓 𝑖𝑡𝑒𝑚 𝑥 100
4. Validity and Reliability
The good instrument in a study was not only the instrument valid but also
realiable to measure what suppose measured. The analysis used several formulas
that used to measure the realibility.13 To measure the realibility test, the writer
used the Kuder Richardson (KR20) and the formula as follow :
The formula to be used :
Notes
13
Sugiyono , Metode Penilitian Pendidikan Pendekatan Kuantitatif, Kualitatif dan R&D,p. 131.
𝑟= 𝑘
𝑘 −1× 1−
𝑝𝑞 𝑠2
Statistics
R : Reliability of test
K : Number of test items
P : Mean of the correct answer
Q : Mean of the wrong answer
S2 : Variance
𝑟= 𝑘
𝑘 −1× 1−
𝑝𝑞 𝑠2
𝑟= 50
50−1× 1−
93304 (27,936)2
𝑟=50
49× 1−
93304 780.420096
𝑟=50
49× 1−119.556122
𝑟= 1.02040816 × 118.556122
𝑟= 0.975634
0.800-1.000 = Very High Reliability
0.600-0,799 = High Reliability
0.400-0,599 = Fair Reliability
0.200-0.399 = poor Reliability
0.000-0.199 = Very Poor Reliability14
14
Suharto , Educational Research, Second Edition, p.88.
N Valid 13
Missing 0
According to Suharto, the result of the calculation above connected to the
following criteria. From the result above, 0.975634 indicate that the realibility test
was very high reliability.
1. Construct validity
Construct validity was type of validity which assumes the existence of certain
learning theories or construct underlying the acquisition of abilities and skills.15
Each pre test and post test gave 40 items and matched by syllabus of English
at students of English study program students of IAIN Palangka Raya.
2. Content Validity
The test item in this study measured the students‟ English synonym context
clue and based on the English reading comprehension in IAIN Palangka Raya.
In making the test, the writer tried to match each of item test with the synonym
context clue and reading comprehension that was used by students of English
study program students of IAIN Palangka Raya.
3. Face Validity
The test item in this study measured the students „English synonym context
clue and based on the English teaching learning about 50 items of synonym
context clue and reading comprehension to class B and C in IAIN Palangka
Raya. The test constructed in the multiple choice test (a, b , c, and d). The test
consisted of 50 items.
15
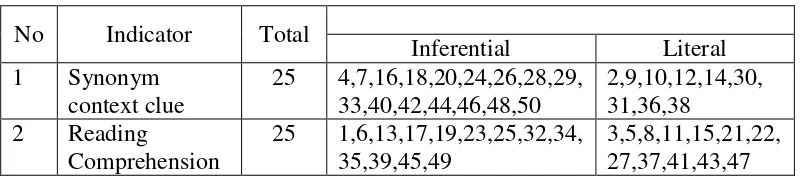
Table 3.4. Item Specification of Instrument Try Out
No Indicator Total
Inferential Literal
1 Synonym
context clue
25 4,7,16,18,20,24,26,28,29, 33,40,42,44,46,48,50
2,9,10,12,14,30, 31,36,38
2 Reading
Comprehension
25 1,6,13,17,19,23,25,32,34, 35,39,45,49
3,5,8,11,15,21,22, 27,37,41,43,47
To measure the validity of the instrument, the writer used the formulation of
product moment by person as follows16 :
𝑟𝑥𝑦 = 𝑁 𝑥𝑦 − 𝑥 ( 𝑦
{𝑁 𝑥2 − 𝑥 2} [𝑁 𝑦2− 𝑦 2 ]
Where :
rxy : Index Correlation Number “r” Product Moment.
N : Number of Cases
∑XY : Multiplication Result between score X and score Y.
∑X : Total Value of score X.
∑Y : Total Value of score Y.
Interpretation :
rxy>rt = Valid
rxy<rt = Invalid
16
The criteria of interpretation the validity 17:
0.800 – 1.000 = Very High Validity
0.600 – 0.799 = High Validity
0.400 – 0.599 = Fair Validity
0.200 – 0.399 = Poor Validity
0.00 –0.199 = Very Poor Validity
𝑟𝑥𝑦 = 𝑁 𝑥𝑦 − 𝑥 ( 𝑦
{𝑁 𝑥2 − 𝑥 2} [𝑁 𝑦2− 𝑦 2 ]
𝑟𝑥𝑦 = 13. 63728 − 232 (220)
{13. (68256− 232 2} [13. 62368−(220) 2
𝑟𝑥𝑦 = 828464−51040
887328− 53824 810784 −(48400)
𝑟𝑥𝑦 = 777424
833504 (762384)
𝑟𝑥𝑦 = 777424
635.450113536
𝑟𝑥𝑦 = 777424
797151,248
𝑟𝑥𝑦 0,97525282
17
In this study, using manual calculation the result of tryout r x y was
0.97525282. r observed was 0.97525282 than r table 5% the value was 0.5139 and 1% was 0.6411. So, the interpretation was rxy>rt= Valid. 0.5139
<0.97525282 >0.408= Valid. The criteria of interpretation the validity 18:
0.97525282 was Very High Validity.
From the calculation above, the items was specification of synonym
context clue and reading comprehension in tryout test items. The number of the
valid items based on SPSS program (more detail, appendix 3)
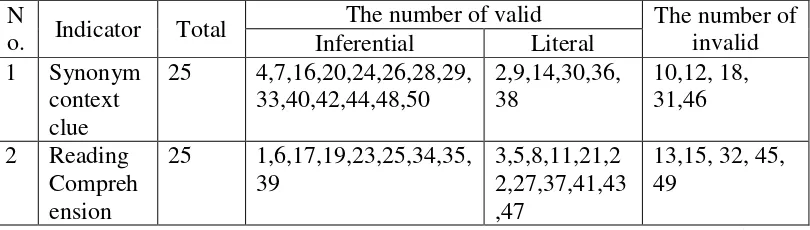
Table . 3.5 Valid and invalid items Specification
N
o. Indicator Total
The number of valid The number of
invalid
Inferential Literal
1 Synonym context clue
25 4,7,16,20,24,26,28,29, 33,40,42,44,48,50
2,9,14,30,36, 38
10,12, 18, 31,46
2 Reading Compreh ension
25 1,6,17,19,23,25,34,35, 39
3,5,8,11,21,2 2,27,37,41,43 ,47
13,15, 32, 45, 49
From the table above, the number of invalid was 10,12, 18,31, and 46 from
synonym context clue items. Meanwhile, the number of invalid from reading
comprehension was 13,15, 32, 45 and 49. The total of invalid items was 10
numbers. So, it meant that the valid number was 40 numbers. The number of valid
from synonym context clue was 4,7,16,20,24,26,28,29,33,40,42,44,48,50
(inferential) and 2,9,14,30,36,38 (literal). The valid number of valid from reading
comprehension was 1,6,17,19,23,25,34,35,39, (inferential) and
3,5,8,11,21,22,27,37,41,43,47 (literal).
18
F. Data Analyzing
After the all data have been collected, the next step is analyzing the data. To
analyze the data obtained from the field, several techniques conducted as follow:
1. Writer did try out to third semester students of English study program
students of IAIN Palangka Raya. The tryout implemented on Thursday, 22
September 2016 in class C Reading Comprehension at 13.15 pm the number
of students was 13 students.
2. Writer collected the data of the students result. From 40 items consisted of 20
reading comprehension and 20 synonym context clue items. Writer gave score
to students by using formula.
𝑠𝑡𝑢𝑑𝑒𝑛𝑡’𝑠𝑐𝑜𝑟𝑟𝑒𝑐𝑡𝑎𝑛𝑠𝑤𝑒𝑟
𝑡ℎ𝑒𝑛𝑢𝑚𝑏𝑒𝑟𝑜𝑓𝑖𝑡𝑒𝑚 𝑥 100
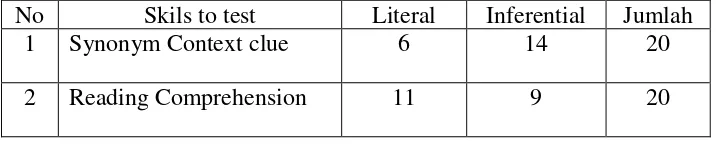
3. Test item specification
Tabel 3.6 Test Item Specification of instrument of study
No Skils to test Literal Inferential Jumlah
1 Synonym Context clue 6 14 20
2 Reading Comprehension 11 9 20
The proportion of correct answers (p), the number of test takers who
answered correctly on items that were analyzed in comparison with the
number of participants is a difficulty entirely tests most commonly used.
Writer discusses clarify the research finding about result of study. The writer
was give test toward the students. The test consisted 40 multiple choice test
4. Correlation coefficients
Connecting the two values using the formula Pearson product
moment correlation to know is there any correlation or not in the two
variables. The formula of Product Moment by Pearson as follows19 :
𝑟𝑥𝑦 = 𝑁 𝑥𝑦 − 𝑥 ( 𝑦
{𝑁 𝑥2 − 𝑥 2} [𝑁 𝑦2− 𝑦 2 ]
Where as:
rxy : The coefficient of correlation
∑X : Total Value of Score X
∑Y : Total Value of Score Y
∑ XY : Multiplication Result between Score X and Score Y
N : Number of students
Pearson product moment correlation coefficient, symbolized r, which is
the most widely used descriptive statistic of correlation. Recoil that the Pearson
coefficient is appropriate for use when the variables to be correlated are normally
distributed and measured on an interval or ratio scale.20
𝑟𝑥𝑦 = 𝑁 𝑥𝑦 − 𝑥 ( 𝑦
{𝑁 𝑥2 − 𝑥 2} [𝑁 𝑦2− 𝑦 2 ]
𝑟𝑥𝑦 = 13.63728− 928 (880)
13. (928)2 − 68256 } [13. 880 2−62368]
19
Riduan, Metode dan teknik Menyusun Thesis,Bandung: Alfabeta, 2004, p. 110.
20
𝑟𝑥𝑦 = 828464−816640
(13.861148) −68256] (13.10067200−62308
𝑟𝑥𝑦 = 11824
1127136− 10004832 ]
𝑟𝑥𝑦 = 11824
−8877696
𝑟𝑥𝑦 = 11824
2979.54627
𝑟𝑥𝑦 = 3,96838946
The result of tryout in product moment formulas using manual calculation
indicated that the item was valid. (see appendix 3 more detail).the result from
SPSS calculation was valid. (see appendix 3).
5. The last step is test of significance correlation
Further testing is test of significance that serves to search for the meaning of
the relationship between variables X and variable Y. The results of the Pearson
product moment significance was tested with the following formula:
𝑡 = 𝑟 𝑛 −2
𝑟 1− 𝑟2
Where:
t = the significant correlation
r = the correlation between two variables
By using the equation, it can be found the significant the correlation
between synonym context clue and reading comprehension. Then the use of
distribution (t table) for ɑ =0, 05 (significance of 5% or 0, 05, is a standard measure that is commonly used in research.)21. In this research, the writer tends
to use computerized calculation by utilizing SPSS. Product moment correlation
and Scatter Plot.
If tobserved>ttable = significant
tobserved<ttable = not significant.
The writer uses the 5% significant level because her field of research is
reading comprehension subject not an exact subject. In the language study, it is
better to use 5% significant level. On the other hand, for exact study it is better to
use the 1% significant level.
21