The development of anticipatory cognitive control
processes in task-switching: An ERP study in children,
adolescents, and young adults
ALBERTO MANZI,a,bDOREEN NESSLER,bDANIELA CZERNOCHOWSKI,c
andDAVID FRIEDMANb
a
School of Social and Behavioral Sciences, Mercy College, Dobbs Ferry, New York, USA
bCognitive Electrophysiology Laboratory, Division of Cognitive Neuroscience, New York State Psychiatric Institute, New York, New York, USA c
Department of Experimental Psychology, Heinrich-Heine University, Du¨sseldorf, Germany
Abstract
To investigate the development of advance task-set updating and reconfiguration, behavioral and event-related po-tential (ERP) data were recorded in children (9–10 years), adolescents (13–14 years), and young adults (20–27 years) in a cued task-switching paradigm. In pure blocks, the same task was repeated. In mixed blocks, comprised of stay and switch trials, two tasks were intermixed. Age differences were found for stay-pure performance (mixing costs) in the 600-ms but not in the 1200-ms cue-target interval (CTI). Children showed larger reaction time mixing costs than adults. The ERPs suggested that the larger costs were due to delayed anticipatory task-set updating in children. Switch-stay performance decrements (switch costs) were age-invariant in both CTIs. However, ERP data suggested that children reconfigured the task-set on some stay trials, rather than only on switch trials, suggesting the continued maturation of task-set reconfiguration processes.
Descriptors:Task-switching, Mixing costs, Switching costs, ERP
Executive control refers to a set of processes involved in the conscious sequencing, organization, and monitoring of thought and action (Norman & Shallice, 1986). It consists of separable functions that have been variably described in the literature as planning, decision-making, impulse inhibition, and self-regula-tion (Zelazo & Muller, 2002). All are thought to depend on the integrity of the pre-frontal cortex (PFC; Alvarez & Emory, 2006; Salmon & Collette, 2005). In fact, executive functions are im-pacted by brain insult to the PFC (Stuss & Alexander, 2007) and their epigenetic development parallels the protracted maturation of the PFC, as myelinization increases and synaptic density is selectively reduced by pruning (Bunge & Wright, 2007; Dia-mond, 2002). The current research was aimed at examining sys-tematically the neurocognitive development of executive functions from childhood to young adulthood.
The emergence and optimization of executive control across development allows increasingly deliberate, goal-directed
behav-ior and cognition. In classic developmental studies (Inhelder & Piaget, 1964), young children have been described as concrete and stimulus-bound, while older children and adolescents have been shown to be capable of flexibly adapting to task demands. However, a more systematic investigation of the development of the different facets of executive control is still necessary to specify how these functions reach the sophisticated form found in adult-hood. Moreover, such understanding might support sound, ne-uroscientifically informed applications in education (Diamond, Barnett, Thomas, & Munro, 2007; Goswami, 2006; Meltzer, 2007) and rehabilitation (Reynolds & Horton, 2008).
In past decades, most evidence on the development of exec-utive control has accrued within a neuropsychological perspec-tive by using instruments putaperspec-tively sensiperspec-tive to PFC damage. These, however, are hardly process pure (Levin et al., 1991; Welsh, Pennington, & Groisser, 1991; Zelazo & Muller, 2002). For example, in the Wisconsin Card Sorting Test (WCST; Heat-on, 1981), subjects have to infer the criterion by which the ex-perimenter is sorting stimulus cards that differ in three dimensions (color, shape, number). After a certain number of consecutive correct responses, the target dimension is changed without notice, and the subject must discover the new sorting principle. Performance is evaluated in terms of perseverative er-rors, number of categories achieved, and failures to maintain set. In research on school-aged children, Chelune and Baer (1986) found linear improvement on all three performance indices be-tween the ages of 6 and 10 years, with 10-year-olds performing The authors thank Mr. Charles L. Brown III for computer
program-ming and technical assistance. We thank Ms. Brenda Malcom for her aid in recruitment of participants and data collection, and Ms. Rebecca Edelblum for subject recruitment. We thank Dr. Y. M. Cycowicz for her contributions to the early phases of this work. This project was supported in part by grants HD14959 (NICHD) and AG005213 (NIA), and the New York State Department of Mental Hygiene.
Please address correspondence to: Alberto Manzi, School of Social and Behavioral Sciences, Mercy College, 555 Broadway, Dobbs Ferry, NY 10522. E-mail: [email protected]
Copyrightr2011 Society for Psychophysiological Research DOI: 10.1111/j.1469-8986.2011.01192.x
like healthy young adults. Although this test is useful in provid-ing global measures of cognitive control, it does not allow teasprovid-ing apart the multiple control functions that are brought on-line during test execution (see, for example, the components of up-dating, shifting, and inhibition proposed by Miyake et al., 2000). Hence, to overcome the limitations of neuropsychological tests, and systematically describe executive functions and their maturation, more process-pure experimental methods have been devised (Zelazo & Muller, 2002, for a review). Among these, task-switching paradigms have been increasingly used in recent years (Kiesel et al., 2010; Monsell, 2003, for reviews). These paradigms typically require performance on two relatively simple tasks. For example, in the current paradigm (adapted from Cepeda, Kramer, & Gonzalez de Sather, 2001), subjects were shown strings of numbers (1, 3, 111, 333) and were asked to respond to digit identity (‘‘What number?’’) in one task, and to the size of the string (‘‘How many?’’) in the other task. In pure blocks, the same task is performed repeatedly. In mixed blocks, the two tasks are randomly presented and, on each trial, partic-ipants might either perform the same task as on the previous trial (stay trials) or switch to the other task (switch trials).
Variations in performance between pure, stay, and switch tri-als provide indices of the engagement of different executive-con-trol processes. Mixing costs are computed as the difference between reaction times (RTs) (or errors) on stay trials in mixed blocks and pure trials in single-task blocks.1Mixing costs have been associated with different processes summarized under the term task-set updating. These processes are thought to reflect such components as the encoding of the cue, the selection and updating of the currently relevant task-set (Mayr, 2001), and the active maintenance of multiple task-sets in memory (Fagot, 1994; Los, 1996; Meiran, 2000). Switch costs (also labeled specific switch costs in Kray & Lindenberger, 2000) are measured as the difference in performance between switch and stay trials in mixed blocks. These costs are believed to capture task-set reconfigura-tion, including operations such as retrieval from memory of the appropriate task rules (Mayr & Kliegl, 2000), implementation of new stimulus-response mappings (Rogers & Monsell, 1995), and counteracting interference from previously active task sets (task-set inertia, Allport, Styles, & Hsieh, 1994).
To selectively investigate anticipatory cognitive control, a variant of the task-switching paradigm has been devised in which participants are cued as to which task is going to be presented on the upcoming trial (Meiran, 1996). By varying the interval be-tween presentation of cue and target, it is possible to evaluate how performance is affected when the opportunity for advance preparation is reduced or increased (Meiran, 1996; Monsell & Mizon, 2006). In one of the first studies using this paradigm, Meiran (1996) administered a simple reaction time (RT) task using two-dimensional stimuli; on each trial a circle was pre-sented in one of the four quadrants of a 22 grid and, therefore, could be defined in terms of left-right or up-down position. At the beginning of each trial, a cue indicated which positional di-mension of the target subjects had to respond to, with cues pre-sented either 200 ms or 1700 ms before target onset. It was
found that longer cue-target intervals (CTIs) were associated with smaller accuracy and RT switch costs (Meiran, 1996). Sim-ilarly, several other studies using the explicit-cue paradigm have replicated the finding that mixing and switch costs decrease when participants are allowed time to prepare prior to the target (Go-pher, Armony, & Greenshpan, 2000; Rogers & Monsell, 1995; Rubin & Meiran, 2005). In the case of switch costs, results from studies varying the CTI indicate that the preparation advantage in young adults (i.e., the decrease in switch costs) plateaus at about 600 ms (e.g., Monsell & Mizon, 2006, Exp. 2; Rogers & Monsell, 1995, Exp. 2). To the best of our knowledge, whether mixing costs are reduced at longer CTIs has not been investi-gated. A CTI longer than 600 ms does not usually show any additional performance benefits, although aresidual switch costis still observed.
At present, the exact processes that are responsible for the beneficial effect of preparation are still to be determined. The advantage is thought to index endogenous, top-down, anticipa-tory control that can be effectively brought on-line before pre-sentation of an imperative stimulus (Monsell & Mizon, 2006; Rubin & Meiran, 2005). Specifically, the preparation interval could be used to orient attention towards task-relevant attributes of the upcoming target stimulus, to retrieve task rules and stim-ulus-response mappings, and to adjust decision and response criteria (Monsell, 2003). In turn, residual switch costs have been attributed to the need for bottom-up, stimulus-driven control processes that cannot be prepared in advance, but might be ini-tiated only after target presentation (Monsell, 2003).
Task-switching paradigms are a valuable tool for investigating selective aspects of cognitive control across the lifespan, because their simplicity makes them suitable for administration to a wide range of age groups, from preschoolers to older adults (Cepeda et al., 2001). However, there is, to date, a paucity of developmental behavioral data. Consequently, prior research has not yet pro-vided unambiguous evidence on the differential developmental progression of mixing and switch costs. Furthermore, of the ex-tant investigations, only a small set has focused on developmen-tal differences in mixing costs, which was one of the factors motivating this investigation (Crone, Bunge, van der Molen, & Ridderinkhof, 2006; Crone, Ridderinkhof, Worm, Somsen, & van der Molen, 2004; Karbach & Kray, 2007; Kray, Eber, & Lindenberger, 2004; Kray, Eber, & Karbach, 2008; Reimers & Maylor, 2005). With one exception (Crone, Bunge, et al., 2006), all reported a decrease in mixing costs from childhood through adolescence, presumably reflecting increased efficiency in task-set coordination and updating the currently relevant task-task-set. By contrast, developmental studies of switch costs have produced conflicting results, with almost equal numbers reporting no differences in switching performance across development (Crone et al., 2004; Karbach & Kray, 2007; Reimers & Maylor, 2005) as those describing larger switch costs in 7–9- and 10–12-year-old children compared to young adults (Cepeda et al., 2001; David-son, Amso, AnderDavid-son, & Diamond, 2006). In the latter case, increased slowing on switch trials in children might indicate im-maturity in implementing task-set reconfiguration processes.
In the current study, we were interested in investigating fur-ther the development of anticipatory control processes elicited in cued task-switching paradigms. However, the RT response re-flects the ‘‘final common pathway’’ or end point of decision processes. Therefore, it cannot provide insight into the temporal course of advance preparatory processes set in train by the explicit cue and terminated with the decision. Accordingly, we
1Some authors compute mixing costs as the performance difference
employed the event-related potential (ERP) technique because its high temporal resolution enables the tracking, in real time, of presumed control processes reflected in the neuroelectric activity occurring after presentation of a task cue and before a response is produced. To date, a few explicit-cue, ERP task-switching studies have investigated post-cue differences between stay and pure tri-als, but only in young adults (Jost, Mayr, & Ro¨sler, 2008; Kray, Eppinger, & Mecklinger, 2005; West, 2004; Wylie, Murray, Javitt, & Foxe, 2008). All found that cues signaling stay trials evoked larger positive amplitudes than cues signaling pure trials (500 ms) at central and parietal scalp locations. The greater positivity on stay trials has been interpreted as indexing the im-plementation of endogenous, anticipatory task-set updating.
More abundant data are available on ERP activity occurring in advance of switch compared to stay trials in mixed blocks. Several studies have reported that a sustained posterior positivity emerging around 400 ms post cue was greater when participants prepared to switch than stay (Astle, Jackson, & Swainson, 2006, 2008; Hsieh & Cheng, 2006; Karayanidis et al., 2009; Kieffaber & Hetrick, 2005; Miniussi, Marzi, & Nobre, 2005; Moulden et al., 1998; Nicholson, Karayanidis, Davies, & Michie, 2006; Nicholson, Karayanidis, Poboka, Heathcote, & Michie, 2005; Rushworth, Passingham, & Nobre, 2002, 2005; Swainson et al., 2003; Tieges, Snel, Kok, Plat, & Ridderinkhof, 2007). Further evidence indicated that the differential switch positivity predicted successful switching performance (Lavric, Mizon, & Monsell, 2008; Swainson, Jackson, & Jackson, 2006). This positivity has also been reported in alternating-run paradigms. In these, no cue is given, but task switches can be predicted because the two tasks alternate in a fixed sequence, thus enabling advance preparation (Karayanidis, Coltheart, Michie, & Murphy, 2003; Wylie, Javitt, & Foxe, 2003). On these bases, this sustained posterior positivity could index the endogenous task-set reconfiguration processes that can be initiated in anticipation of the imperative stimulus, as hypothesized in the behavioral literature (Monsell, 2003).
As noted, executive functions follow a long developmental trajectory from childhood through adolescence into adulthood (Davidson et al., 2006). To the very best of our knowledge, prior developmental ERP studies of task-switching performance do not exist. Consequently, in an attempt to gain additional evi-dence on the development of anticipatory control processes in-volved in task switching, we recorded ERPs during the cue-response interval, as well as performance data, in 9–10-year-old children, 13–14-year-old adolescents, and young adults engaged in a task-switching paradigm, with informative task cues pre-sented 600 ms and 1200 ms before target onset. These intervals were chosen on the basis of previous research showing, as noted earlier, that young-adult switch costs plateau at approximately 600 ms (Cepeda et al., 2001). Although the data of Cepeda and colleagues suggested that children can benefit as much from a long CTI as young adults (e.g., 1200 ms in Cepeda et al., 2001), these authors recorded only performance indices. Critically, we recorded neural activity during the entire cue-target interval. This afforded us the additional capability of determining whether de-velopmental improvements in mixing and/or switch costs were accompanied by concomitant latency changes in onset and/or offset of ERP indicators of advance preparatory control that differed for the short compared to the long CTI. Single- and mixed-task blocks were administered so that stay and pure trials (mixing costs) and switch and stay trials (switch costs) could be compared in order to examine the arguably unique control pro-cesses that the two types of costs are believed to capture.
Following the developmental task-switching behavioral liter-ature, we expected more marked age differences in mixing than switch costs (Crone et al., 2004; Karbach & Kray, 2007; Reimers & Maylor, 2005). Based on the results showing that the reduction of switch costs plateaus at a CTI of 600 ms, we expected young adults to show an anticipatory-control positivity onsetting early after the cue and offsetting at or around target onset, reflecting, respectively, engagement in and completion of anticipatory con-trol processes. In the case of children and adolescents, less defi-nite predictions could be made due to the lack of developmental ERP data. However, it is reasonable to predict that larger mixing and/or switch costs in children and adolescents compared to young adults might be associated with reduction or delayed onset and offset of the cue-related positivity. This would tend to in-dicate an inefficient or delayed engagement in anticipatory con-trol, which would overlap with and slow the processing of the target and the production of the response, thus resulting in larger costs to performance.
Method
Participants
Twenty-three children, 16 adolescents, and 20 young adults were recruited. Eleven participants were eliminated for failure to per-form or complete the task (5 children, 2 adolescents) and because of excessive EEG artifacts (4 children). Fourteen children (9 males, mean age: 10.1, range: 9–11 years), 14 adolescents (6 fe-males, mean age: 14.0, range: 13–15 years), and 20 young adults2 (16 females, mean age: 23.3, range: 20–27 years) were retained for the study. All were native English speakers, with normal or corrected-to-normal vision, no history of neurological or psy-chiatric disorders, and free from medications known to affect the central nervous system. All young adults and one parent of every child and adolescent signed consent forms according to criteria of the New York State Psychiatric Institute’s Institutional Review Board. Children and adolescents signed assent forms. All par-ticipants received monetary compensation.
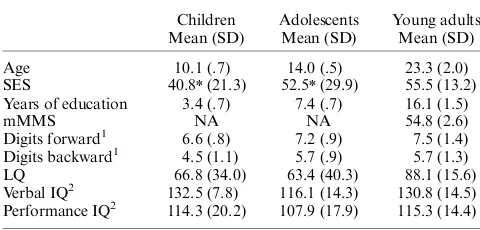
The demographic and neuropsychological data for the three groups are listed in Table 1. Young adults were administered the Modified Mini-Mental Status examination (mMMS; Mayeux, Stern, Rosen, & Leventhal, 1981). IQ scores were estimated from the Vocabulary and Block design subtests of the Wechsler Intel-ligence Scale for Children and Adolescents (WISC-III; Wechsler, 1991) and the Wechsler Adult Intelligence Scale-III for young adults (WAIS-III; Wechsler, 1997). In addition, participants were administered the story, design, and picture memory subtests of the Wide Range Assessment of Learning and Memory battery (WRAML; Sheslow & Adams, 1990). All participants had scores within or above the average range on all of these instruments.
Stimuli and Experimental Procedure
Participants were seated comfortably in a sound-damped and electrically shielded room. They sat facing a 1700computer
mon-itor about 100 cm from the screen and held a small response box on their laps. Stimuli were presented centrally on the computer
2
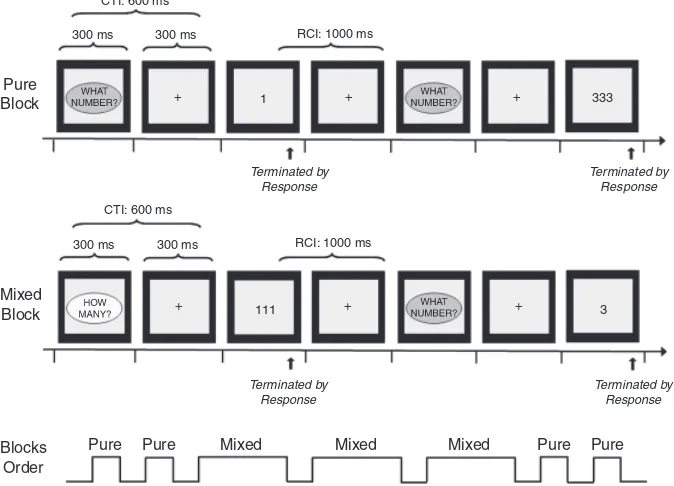
monitor, within a gray box (visual angles: 7.417.41) on a black background. Participants made choice button-press responses in an explicit-cue, task-switching paradigm based on the design in-troduced by Cepeda and colleagues (2001). They viewed one of four possible stimuli (1, 3, 111, 333) and were asked to respond to digit identity (‘‘What number?’’) in one task, and to the size of the string (‘‘How many?’’) in the other task. For both tasks, the response options (‘‘1’’ and ‘‘3’’) were mapped to opposite hands. The experiment included pure and mixed blocks. During pure blocks, one task was performed throughout. During mixed blocks, participants switched between the two tasks. Switch trials (i.e., when a change of task was required) occurred after 0, 1, or 2 stay trials (i.e., when the task set remained the same on consec-utive trials), with switch and stay trials occurring equally often. Figure 1 illustrates a schematic of the task sequence for pure and mixed blocks. In each trial, a cue signaling the task to be per-formed appeared for 300 ms and consisted of the words ‘‘How many?’’ or ‘‘What number?’’ enclosed in an oval shape (visual angles: 5.41horizontally2.31vertically). Cues for the two tasks were presented in oval shapes of different colors (yellow and blue, rendered in light and dark gray in Figure 1), in order to facilitate cue discrimination (see Crone, Bunge, et al., 2006 for a similar argument on cue design). For each subject, the color assigned to a task cue remained the same throughout the experiment. Color-to-task pairing was counterbalanced across participants. In the short CTI condition (depicted in Figure 1), the cue was followed by a fixation cross displayed for 300 ms, thus resulting in a cue-target interval of 600 ms. In the long CTI condition, the fixation cross was displayed for 900 ms, thus resulting in a cue-target interval of 1200 ms. The target stimulus was displayed until a response was made by pressing one of two buttons with the left or right index fingers. Equal emphasis was placed on speed and accuracy. The next trial started after a fixed 1000 ms response-cue interval (RCI), during which the fixation cross appeared.
For each CTI condition, participants completed, in the fol-lowing order, two consecutive pure blocks (one per task, each including 36 trials), followed by three mixed blocks (each in-cluding 96 trials), and conin-cluding with two pure blocks (one per task). The order in which task (‘‘How many?’’ or ‘‘What num-ber?’’) was assigned to the first pure block, the order of
presen-tation of short and long CTI conditions, as well as response-hand mappings were counterbalanced across participants. Moreover, left- and right-hand responses as well as switches from left- and right-hand responses to, respectively, right- and left-hand re-sponses were randomized for pure, stay, and switch trials. There-fore, it is unlikely that differential, age-related hand-switching effects could have systematically impacted the developmental results reported below. To ensure that participants understood the instructions and could perform accurately, practice versions of two pure blocks (10 trials each) and a mixed block (20 trials) were performed prior to the experiment.
Electroencephalographic (EEG) recording. EEG was recorded with 62 sintered Ag/AgCl electrodes embedded in an elastic cap over scalp sites in accordance with the extended ten-twenty sys-tem (Sharbrough et al., 1990; ground: right forehead, electrode impedanceo5kO). All electrodes were initially referenced to the nose tip and rereferenced offline to averaged mastoids. Hori-zontal and vertical electrooculograms (EOG) were recorded bi-polarly with electrodes placed, respectively, at the outer canthi of both eyes and above and below the left eye. EOG and EEG were recorded continuously with SynAmp amplifiers (Compumedics Neuroscan, Charlotte, NC; DC; 100 Hz low-pass filter; 500 Hz digitization rate).
Data processing and analyses.
Behavioral data. Because a response deadline was not im-posed, the data were trimmed to reject outliers using two criteria. First, only correct trials with RTs between 200 and 4000 ms were included. Second, individual mean RTs and standard deviations (SDs) were computed for each of the three Trial Type conditions (pure, stay, switch). Trials were rejected if they were more than 2.5 standard deviations from the relevant individual mean RT. Mean percentages of total trials excluded by these two rejection criteria were, respectively, 0.08% and 3.2% for children, 0.02% and 3.2% for adolescents, 0.03% and 2.9% for young adults.
The trimmed dataset was used to create mean RTs and mean error rates separately for pure, stay, and switch trials. Mixing costs were computed to estimate the error increase and response slowing on stay trials in mixed blocks compared to trials in pure blocks. Error mixing costs were obtained for each participant by subtracting the error rates for pure from those for stay trials. Error switch costs were computed to estimate the impact on performance induced by switching between the two tasks in a mixed block. In this case, switch costs were obtained by sub-tracting the error rates for stay from those for switch trials. Raw RT mixing and switch costs were computed, respectively, by subtracting RTs on pure trials from those on stay trials, and RTs on stay trials from those on switch trials. To ensure that any group differences in these costs did not merely reflect prolonged overall RTs (i.e., baseline response speed) in the children and/or adolescents relative to young adults, we computed proportional scores for RT mixing and switch costs. Proportional RT mixing costs were computed using the formula (Stay RT – Pure RT)/ Pure RT. Proportional RT switch costs were computed using the formula (Switch RT – Stay RT)/Stay RT. In order to evaluate age-related differences in task-switching effects, error and pro-portional RT mixing, and switch costs were submitted to be-tween-Age Group analyses of variance (ANOVAs). For these and all of the following analyses, the Greenhouse-Geisser epsilon (e) correction (Jennings & Wood, 1976) was used when appro-priate. Uncorrected degrees of freedom are reported along with Table 1.Demographic Characteristics and Neuropsychological
Measures for Children, Adolescents, and Young Adults
Children Adolescents Young adults Mean (SD) Mean (SD) Mean (SD)
Age 10.1 (.7) 14.0 (.5) 23.3 (2.0)
SES 40.8n(21.3) 52.5n(29.9) 55.5 (13.2) Years of education 3.4 (.7) 7.4 (.7) 16.1 (1.5)
mMMS NA NA 54.8 (2.6)
Digits forward1 6.6 (.8) 7.2 (.9) 7.5 (1.4) Digits backward1 4.5 (1.1) 5.7 (.9) 5.7 (1.3)
LQ 66.8 (34.0) 63.4 (40.3) 88.1 (15.6) Verbal IQ2 132.5 (7.8) 116.1 (14.3) 130.8 (14.5)
Performance IQ2 114.3 (20.2) 107.9 (17.9) 115.3 (14.4)
Notes: NA: not applicable, mMMS: Modified Mini-Mental Status Exam (Mayeux, Stern, Rosen, & Leventhal, 1981, maximum score557), SES:
socioeconomic status (Watt, 1976, higher score5lower SES), LQ:
later-ality quotient (Oldfield, 1971).
1
Digit-span (uncorrected scores).
2WAIS-III (Wechsler, 1997) for young adults; WISC-III (Wechsler, 1991)
for children and adolescents.
the epsilon value; the P values reflect the epsilon correction. Partial eta squared (Zp2) is given as an estimate of effect size.
ERP data. Only trials accepted on the basis of the behavioral criteria specified above were included in the ERP analyses. Eye-movement artifacts were corrected off-line (Semlitsch, Anderer, Schuster, & Presslich, 1986), and remaining artifacts (e.g., mus-cle activity) were manually rejected. If single channels showed artifacts, a spherical spline algorithm was used for interpolation on a trial-by-trial basis (Perrin, Pernier, Bertrand, & Echallier, 1989), with a maximum of four channels interpolated for a given trial (Picton et al., 2000). EEG epochs had a 100-ms pre-cue baseline and included the cue-target interval and the 400 ms fol-lowing target presentation. Averages were obtained for each of the three Trial Type conditions (pure, stay, switch), in short- and long-CTI conditions, separately for the three age groups.3 Mix-ing costs were investigated by comparMix-ing pure with stay trials and switch costs by comparing stay with switch trials. A 15 Hz low-pass filter was applied to all averages before statistical analysis.
In order to capture early and sustained ERP effects presum-ably indexing anticipatory control processes initiated following the cue and sustained until or past target presentation, mean amplitudes were computed for consecutive 100-ms windows, starting at cue onset. Activity in the post-target interval, poten-tially reflecting continued preparatory processing, was analyzed only if cue-related activity extended to the end of the CTI. The analysis of the post-target interval was terminated with the first
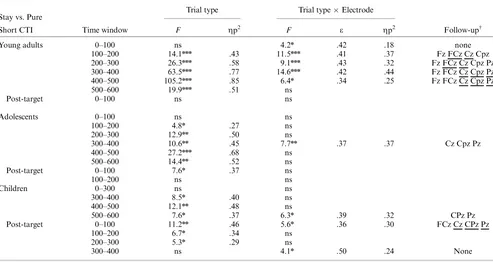
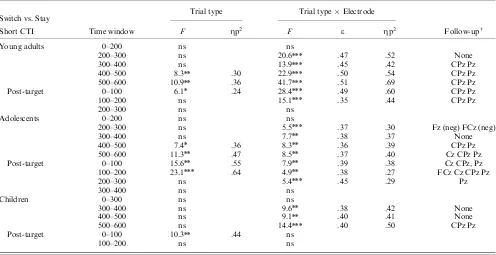
100-ms time interval that did not return a significant stay-pure or switch-stay difference. Based on previous studies and the pri-marily midline topographic distribution of the effects depicted in the maps of the difference waveforms (see Results section for details), amplitudes were analyzed at five midline electrodes (Fz, Fcz, Cz, Cpz, Pz). In a first step, to test whether pure-stay and stay-switch differences were present in each age group and to determine their timing, mean amplitudes in each time window were submitted to Trial Type (pure vs. stay or stay vs. switch) by Electrode (Fz, Fcz, Cz, Cpz, Pz) repeated measures ANOVAs, separately for each age group. Because we were interested in ERP effects underlying mixing and switch costs, only effects involving the Trial Type factor are reported. Interactions involving the Electrode factor were further explored in repeated measures Trial-Type ANOVAs at each electrode site using a modified Bonferroni correction for multiple comparisons (Jaccard & Wan, 1996). In a second step, differences between age groups were examined using Age GroupTrial TypeElectrode ANOVAs for the 100-ms windows that had demonstrated significant stay-pure or switch-stay differences in at least two of the groups in the initial, within-group analyses. To test whether significant 3-way interactions reflected topographic differences between the groups, these interactions were followed up by Age Group
Electrode ANOVAs on the stay-pure or switch-stay normalized amplitude differences. Normalization controls for the effect of overall amplitude differences among the three groups (vector scaling, McCarthy & Wood, 1985). Topographic maps were computed only for significant stay-pure (mixing costs) and switch-stay (switch costs) differences by calculating spherical spline contours (Perrin et al., 1989) on the data from all 62 elec-trodes. The maps illustrate amplitude differences for individual 100-ms intervals when differences between groups were signifi-cant. The maps are collapsed across contiguous intervals when scalp distribution differences among groups were not significant in those time periods.
CTI: 600 ms
CTI: 600 ms
RCI: 1000 ms RCI: 1000 ms
1 333
111 + + 3
+
+ + +
Terminated by Response
Terminated by Response
Terminated by Response Terminated by
Response
300 ms
Pure Block
Mixed Block
Blocks Order
Pure Pure Mixed Mixed Mixed Pure Pure 300 ms
300 ms 300 ms
Figure 1.Schematic of the experimental paradigm (adapted from Cepeda et al., 2001). A single-task block (pure trials for the ‘‘What number?’’ task) and a mixed block (depicting a task-switch) in the short CTI condition are shown. Block order is shown at the bottom. CTI: cue-target interval, RCI: response-cue interval.
3Minimum and maximum trial numbers for each group and trial type
are provided below.
Short CTI: Children, pure (55–129), stay (45–115), switch (37–105). Adolescents, pure (77–126), stay (56–115), switch (63–108). Adults, pure (113–141), stay (96–122), switch (90–121).
Results
Behavioral Data
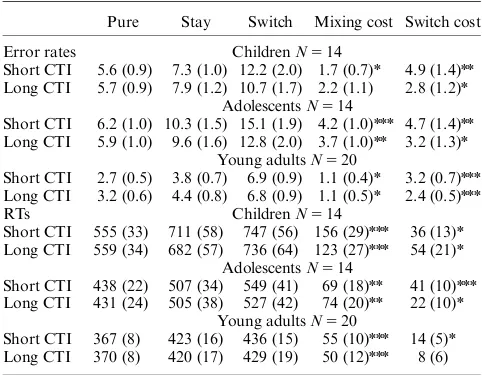
Table 2 shows mean error rates and mean raw RTs for pure, stay, and switch trials, as well as the mean raw mixing and switch costs in short and long CTI conditions for the three age groups.
Mixing costsFshort cue-target interval (600 ms).
Errors. Mixing costs were significantly different from zero (assessed viat-tests) in the three groups (see Table 2). A between-Age Group ANOVA performed on the mixing costs revealed a main effect of Age Group [F(2,45)55.38, po.01,Zp25.19]. Tukey’s HSDpost-hoctesting indicated that executing the same task in mixed- compared to pure-blocks caused a greater increase in errors for adolescents than young adults, although these groups did not differ reliably from children.
RT. Raw mixing costs differed from zero in all groups (Table 2). The between-Age Group ANOVA performed on the proportional mixing costs revealed a reliable main effect of Age Group [F(2,45)53.85,po.05,Zp25.15]. Tukey’s HSD post-hoc tests confirmed larger mixing costs in children than young adults; children did not differ significantly from adolescents, nor did young adults and adolescents.
Ancillary analyses. To rule out the possibility that develop-mental differences in vigilance and/or motivation might be re-sponsible for the age difference in mixing costs, we queried the data to determine if block position and trial position within blocks influenced age-related changes in RT mixing costs. To this end, RTs on pure and stay trials were analyzed separately in between-Age Group ANOVAs with the repeated measures fac-tors of Block Position (4 levels for pure trials; 3 levels for stay trials) and Trial Position (first half, second half of each block). For pure trials, this analysis returned significant main effects of Age Group [F(2,45)520.6,po.0001,Zp25.48] and Block Po-sition [F(3,135)56.93, po.0001,Zp25.13], and a significant
Age GroupBlock Position interaction [F(6,135)53.69,
po.01, Zp25.14]. Main effects of and interactions with the factor of Trial Position were not reliable [ps4.08]. As assessed by follow-up analyses, the Age GroupBlock Position interaction reflected adults’ and children’s tendency to speed up in the sec-ond and fourth blocks, whereas adolescents’ RTs were not sig-nificantly different across blocks. The ANOVA performed on stay-trial RTs returned significant main effects of Age Group [F(2,45)516.2, po.0001, Zp25.42] and Trial Position [F(1,45)54.64, po.05, Zp25.09]. There were no significant effects of Block Position (Fo1) and no Age groupTrial Po-sition or Block PoPo-sition interactions (Fso1). Overall, these re-sults indicate that, although Block and Trial Position influenced RTs, these effects did not differ among the three age groups in a way that could have explained the larger RT mixing costs for children compared to young adults.
Switch costsFshort cue-target interval (600 ms).
Errors. As shown in Table 2, switch costs differed from zero in all groups. The between-Age Group ANOVA did not return a significant effect (Fo1,p4.8), indicating that error switch costs were age-invariant.
RT. Raw switch costs were significantly different from zero for all groups (Table 2). The between-Age Group ANOVA per-formed on the proportional switch costs did not return a signifi-cant effect of Age Group (p4.05), indicating that RT switch costs did not differ among the three age groups.
Mixing costsFlong cue-target interval (1200 ms).
Errors. Mixing costs were significantly different from zero in adolescents and young adults, but not children (Table 2). How-ever, the between-Age Group ANOVA showed no significant differences in mixing costs among the three groups (p4.09).
RT. Raw mixing costs differed from zero in all groups (Table 2). Group differences in proportional mixing costs were not reliable (p4.3).
Switch costsFlong cue-target interval (1200 ms).
Errors. Table 2 indicates that switch costs differed from zero in all groups. Nonetheless, the between-Age Group ANOVA did not return a significant effect (Fo1), indicating that error switch costs were age-invariant.
RT. Raw switch costs were significantly different from zero for children and adolescents, but not for young adults (Table 2). However, group differences in proportional switch costs were not significant (p4.1).
Overall, the behavioral results showed that age influenced mixing and switch costs differently in the short CTI. Repeating the same task in mixed compared to pure blocks (mixing costs) increased errors in adolescents, whereas it slowed RTs in chil-dren. Conversely, switching tasks within mixed blocks (switch costs) engendered similar performance decrements in the three age groups. By contrast, in the long CTI condition, age-related changes in RT and accuracy mixing and switch costs were not observed. Importantly, the greater RT mixing costs in children than young adults in the short CTI cannot be explained by gen-eral cognitive slowing (i.e., age-related differences in baseline re-sponse speed) or by differences in vigilance and/or motivation. Table 2.Mean Error Rates (in percentSE) and Mean RTs (in
msSE), Mixing and Switch Costs for Children, Adolescents, and Young Adults
Pure Stay Switch Mixing cost Switch cost
Error rates ChildrenN514
Short CTI 5.6 (0.9) 7.3 (1.0) 12.2 (2.0) 1.7 (0.7)n 4.9 (1.4)nn Long CTI 5.7 (0.9) 7.9 (1.2) 10.7 (1.7) 2.2 (1.1) 2.8 (1.2)n
AdolescentsN514
Short CTI 6.2 (1.0) 10.3 (1.5) 15.1 (1.9) 4.2 (1.0)nnn 4.7 (1.4)nn Long CTI 5.9 (1.0) 9.6 (1.6) 12.8 (2.0) 3.7 (1.0)nn 3.2 (1.3)n
Young adultsN520
Short CTI 2.7 (0.5) 3.8 (0.7) 6.9 (0.9) 1.1 (0.4)n 3.2 (0.7)nnn Long CTI 3.2 (0.6) 4.4 (0.8) 6.8 (0.9) 1.1 (0.5)n 2.4 (0.5)nnn
RTs ChildrenN514
Short CTI 555 (33) 711 (58) 747 (56) 156 (29)nnn 36 (13)n Long CTI 559 (34) 682 (57) 736 (64) 123 (27)nnn 54 (21)n
AdolescentsN514
Short CTI 438 (22) 507 (34) 549 (41) 69 (18)nn 41 (10)nnn Long CTI 431 (24) 505 (38) 527 (42) 74 (20)nn 22 (10)n
Young adultsN520
Short CTI 367 (8) 423 (16) 436 (15) 55 (10)nnn 14 (5)n Long CTI 370 (8) 420 (17) 429 (19) 50 (12)nnn 8 (6)
ERP Data
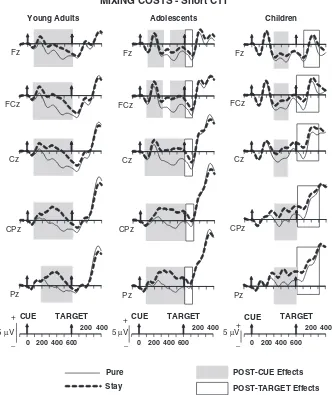
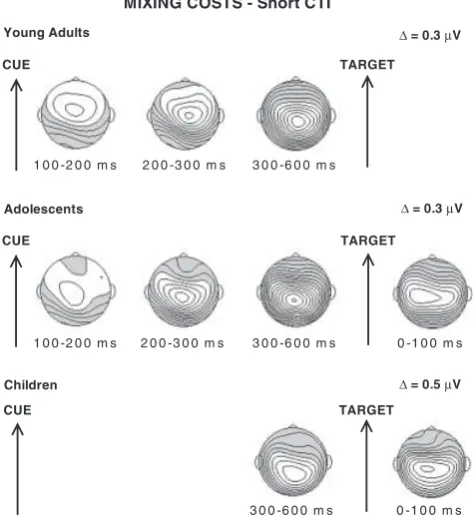
Mixing costsFshort cue-target interval (600 ms). The
wave-forms for pure and stay trials for each age group are displayed in Figure 2. Topographic maps of the time windows with reliable stay-pure differences are shown in Figure 3.
Cue-target interval. Following cue onset in the short CTI condition, young adults showed a positive-going difference be-tween stay and pure trials from 100 to 600 ms (Trial Type main effects: see Table 3 forF-values). This effect was largest at fronto-central sites from 100–300 ms and at centro-parietal sites from 300–500 ms (Trial TypeElectrode Interactions: see Table 3). Similar to young adults, in adolescents, amplitudes for stay rel-ative to pure trials were more positive going from 100–600 ms after cue onset (Trial Type main effects: see Table 3). These effects extended across the midline from 100–300 ms and from 400–600 ms, and were largest at centro-parietal sites from 300–400 ms (Trial TypeElectrode interactions: see Table 3). In contrast with young adults and adolescents, children did not display any difference between pure and stay trials from 100–300 ms after cue
onset (Table 3). However, a reliably increased positivity for stay compared to pure trials emerged from 300–600 ms (Trial Type main effects: see Table 3), with largest amplitudes at centro-pa-rietal sites from 500–600 ms (Trial TypeElectrode interac-tions: see Table 3).
Age-related differences. For the 100–200 and 200–300 ms intervals, there were only significant stay-pure differences for adolescents and young adults. Between-Age Group ANOVAs did not reveal any differences in effect magnitude (Age Group
Trial Type interactions:ps4.6). However, reliable Age Group
Trial TypeElectrode interactions in these intervals (Fs43.38,
pso.05) suggested a difference in topography between young adults and adolescents. Nonetheless, only the difference from 200–300 ms was confirmed by a reliable Age GroupElectrode interaction computed on the normalized stay-pure differences [F(4,128)53.75, po.05, e5.39, Zp25.11]. This result indi-cated that stay-pure differences were larger for young adults than adolescents at Fz, but larger for adolescents than young adults at Pz. From 300–600 ms, all age groups showed reliable stay-pure differences. Age GroupTrial TypeElectrode ANOVAs
Fz
FCz
Cz
CPz
Pz
5 µV +
−
MIXING COSTS - Short CTI
Pure
Stay Young Adults
Fz
FCz
Cz
CPz
Pz
5 µV +
−
Fz
FCz
Cz
CPz
Pz
5 µV +
−
Adolescents Children
CUE TARGET
600 0 200 400
POST-CUE Effects
POST-TARGET Effects
200 400
CUE TARGET
600 0 200 400
200 400
CUE TARGET
600 0 200 400
200 400
comparing raw amplitudes in 100-ms windows among young adults, adolescents, and children did not return either significant Trial TypeAge Group or 3-way interactions (ps4.2). These findings suggest the lack of magnitude and topographic differ-ences among the three age groups, consistent with the similar centro-parietal scalp foci observed for the 300–600 ms interval in the maps depicted in Figure 3.
Post-target interval. Young adults did not show a continu-ation of the difference between pure and stay trials observed in the CTIFno significant differences were found between 0–100
ms post-target onset (Table 3). Unlike young adults, adolescents showed a stay-pure positive difference from 0–100 ms post target across all midline electrodes (Trial Type main effect: Table 3), but similar to young adults, no difference was found between 100– 200 ms. In contrast with young adults and adolescents, children showed a reliable continuation of the cue-driven, stay-pure pos-itive difference from 0–300 after target onset (Table 3). This effect was circumscribed to centro-parietal sites from 0–100 ms and extended across the midline from 100–300 ms (Trial Type main effects and interactions: see Table 3 and Figure 3). Despite the significant Trial TypeElectrode interaction for the 300–400 ms post–target interval,post-hoctests at each electrode site did not return Trial Type differences after modified Bonferroni correc-tion.
Age-related differences. From 0–100 ms post target, stay-pure differences were observed for children and adolescents. The Age GroupTrial TypeElectrode ANOVA did not reveal significant Trial TypeAge group or 3-way interactions
(ps4.2), indicating a lack of magnitude and topographic differ-ences between the two age groups.
In sum, explicit-task cues triggered larger positive-going po-tentials on stay compared to pure trials, possibly indexing the preparatory cognitive control necessary to perform the same task in mixed compared to pure blocks. This preparatory activity started early in young adults and adolescents (100 ms post cue) and, although it included frontal and parietal contributions in both groups, the frontal contribution appeared to be smaller in the adolescents compared to the young adults. In the children, preparatory activity onset later than in the other two groups (starting at 300 ms). Immediately after target onset, the pos-itive difference between stay and pure trials appeared resolved in young adults, whereas it appeared to continue in adolescents (for 100 ms post target) and children (for 300 ms post target).
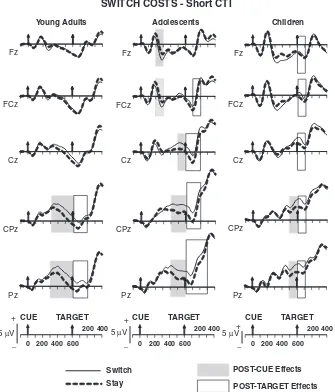
Switch costsFshort cue-target interval (600 ms). Figure 4
de-picts the ERP waveforms for stay and switch trials, and Figure 5 shows the topographic maps of the time windows with significant switch-stay differences.
Cue-target interval. In young adults, switch trials elicited more positive amplitudes than stay trials from 300–600 ms at central and parietal sites (Table 4). Adolescents showed their first significant switch-stay difference from 200–300 ms post cue in the form of a negative-going difference at frontal and fronto-central sites. This was followed by a significant positive switch-stay difference at centro-parietal sites starting at 400 ms post cue and continuing for the remainder of the cue-target interval (Table 4 and Figure 4). By contrast, children failed to show significant switch-stay differences up to 500 ms after cue onset. From 500– 600 ms, a reliable positive switch-stay difference was observed at centro-parietal and parietal electrodes (Trial TypeElectrode interactions: Table 4).
Age-related differences. Switch-stay differences were ob-served for young adults and adolescents from 400–500 ms and for all age groups from 500–600 ms. Age groupTrial Type
Electrode ANOVAs did not return significant Trial TypeAge Group or 3-way interactions (ps4.3), suggesting that there were no age-related differences in effect magnitude or scalp distribu-tion.
Post-target interval. In young adults, switch trials elicited more positive-going activity than stay trials from 0–200 ms post-target onset, which was reliable at centro-parietal sites (Trial Type main effects and interactions: Table 4 and Figure 4). In contrast, adolescents showed a positive switch-stay difference from 0–300 ms, predominantly circumscribed to centro-parietal sites (Trial Type main effects and interactions: Table 4). Children showed a switch positivity across the midline that was reliable only from 0–100 ms post target (Table 4).
Age-related differences. There were no significant differences in effect magnitude or topographic distribution among the three age groups from 0–100 ms or between young adults and ado-lescents from 100–200 ms (Trial TypeAge Group interactions:
ps4.06; Trial TypeElectrodeAge Group interactions:
ps4.2).
In sum, in all age groups, cues signaling a task switch elicited a posterior positivity. This effect had an earlier onset in young adults and adolescents, and appeared to be delayed by 200 ms in children. The posterior positivity continued after the target for
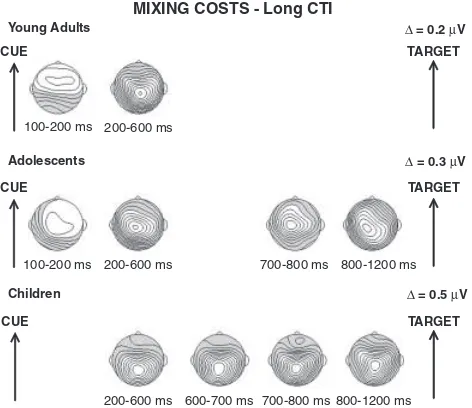
MIXING COSTS - Short CTI
Δ = 0.3 μV
0 -1 0 0 m s Adolescents
Young Adults
Children
1 0 0 -2 0 0 m s 3 0 0 -6 0 0 m s
TARGET CUE
CUE TARGET
TARGET CUE
1 0 0 -2 0 0 m s 3 0 0 -6 0 0 m s
0 -1 0 0 m s 3 0 0 -6 0 0 m s
Δ = 0.3 μV
Δ = 0.5 μV 2 0 0 -3 0 0 m s
2 0 0 -3 0 0 m s
a longer duration in adolescents, but had a shorter duration in young adults and children.
Mixing costsFlong cue-target interval (1200 ms). The
wave-forms for pure and stay trials for each age group are displayed in Figure 6. Topographic maps of the time windows with reliable stay-pure differences are shown in Figure 7.
Cue-target interval. As found in the short CTI condition, young adults showed a positive-going difference between stay and pure trials from 100–600 ms, while stay-pure differences were not present between 600–1200 ms (Trial Type main effects, see Table 5). The stay-pure positivity was reliable at fronto-cen-tral sites from 100–200 ms, and distributed across the midline between 200–600 ms, with larger centro-parietal stay-pure differ-ences from 300–400 ms (Table 5). For adolescents, amplitudes for stay relative to pure trials were more positive going from 100– 600 ms and 700–1200 ms post-cue onset (Trial Type main effects: see Table 5). These effects were distributed across the midline throughout the long CTI with larger centro-parietal stay-pure differences from 300–400 ms and 1000–1100 ms (see Table 5). Children displayed more positive waveforms for stay than pure trials beginning 200–300 ms post-cue onset. These differences remained significant throughout the long CTI (200–1200 ms, see Table 5). Between 200–900 ms, stay-pure differences were limited to centro-parietal recording sites, but spread to fronto-central sites between 900–1200 ms (Trial TypeElectrode interactions: see Table 5).
Age-related differences. From 100–200 ms, stay-pure differ-ences were only present in adolescents and young adults. The Age GroupTrial TypeElectrode ANOVA did not reveal differ-ences in effect magnitude (Age GroupTrial Type interaction:
p4.2), but did return a significant Age groupTrial Type
Electrode interaction [F(4,128)54.17, po.01, e5.39, Zp25.12]. Topographic differences, confirmed by the analysis on normalized difference scores [F(4,128)54.59,po.05,e5.39, Zp25.13], reflected the absence of reliable posterior stay-pure
differences in young adults compared to adolescents.
From 200–600 ms, stay-pure differences were found for all age groups. The Age GroupTrial TypeElectrode ANO-VAs did not return significant Age GroupTrial Type inter-actions in any of the four intervals (ps4.1). However, significant 3-way interactions in all four intervals (Fs42.7,pso.05), all of which remained significant after normalization (Fs43.3,
pso.05), indicated group differences in scalp distribution. Whereas young adults and adolescents showed stay-pure differ-ences at frontal and parietal locations, only children displayed these at parietal sites.
From 700–1200 ms, significant stay-pure differences were exhibited only by children and adolescents. Magnitude differ-ences in these intervals were not reliable (Age GroupTrial Type interactions: ps4.07). Between 700–800 ms, the Age GroupTrial TypeElectrode ANOVA returned a significant 3-way interaction [F(4,104)55.1, po.05, e5.31, Zp25.16], which remained reliable for the normalized amplitudes [F(4,104)54.93,po.05,e5.31,Zp25.16]. This interaction re-flected the lack of a frontal stay-pure difference in children com-Table 3.Results of the Trial Type (Pure, Stay)Electrode (Fz, FCz, Cz, CPz, Pz) ANOVAs for the Short Cue-Target Interval Condition
Stay vs. Pure Trial type Trial typeElectrode
Short CTI Time window F Zp2 F e Zp2 Follow-upw
Young adults 0–100 ns 4.2n .42 .18 none
100–200 14.1nnn .43 11.5nnn .41 .37 Fz FCz Cz Cpz
200–300 26.3nnn .58 9.1nnn .43 .32 Fz FCz Cz Cpz Pz
300–400 63.5nnn .77 14.6nnn .42 .44 Fz FCz Cz Cpz Pz
400–500 105.2nnn .85 6.4n .34 .25 Fz FCz Cz Cpz Pz
500–600 19.9nnn .51 ns
Post-target 0–100 ns ns
Adolescents 0–100 ns ns
100–200 4.8n .27 ns
200–300 12.9nn .50 ns
300–400 10.6nn .45 7.7nn .37 .37 Cz Cpz Pz
400–500 27.2nnn .68 ns
500–600 14.4nn .52 ns
Post-target 0–100 7.6n .37 ns
100–200 ns ns
Children 0–300 ns ns
300–400 8.5n .40 ns
400–500 12.1nn .48 ns
500–600 7.6n .37 6.3n .39 .32 CPz Pz
Post-target 0–100 11.2nn .46 5.6n .36 .30 FCz Cz CPz Pz
100–200 6.7n .34 ns
200–300 5.3n .29 ns
300–400 ns 4.1n .50 .24 None
Notes: Degrees of freedom for main effects and interactions, respectively, are (1,19) and (4,76) for young adults, and (1,13) and (4,52) for adolescents and children. ns: not significant,Zp2: partial eta squared,e: Greenhouse-Geisser coefficient.
np
.05;nnp
.01;nnnp
.001. w
pared to adolescents. Finally, topographic differences between children and adolescents did not emerge between 800–1200 ms (ps4.06).
Post-target interval. In young adults, stay-pure differences were not significant starting at 600 ms post cue. Therefore, po-tential continuation effects were not investigated. In children and adolescents, although the waveforms for stay and pure trials ap-pear to differ in the post-target interval (Figure 6), reliable stay-pure differences were not found from 0–100 ms post-target onset (ps4.3).
To summarize, in the long CTI just as in the short CTI, young adults completed preparation during stay compared to pure trials within 600 ms post-cue onset, as reflected by the termination of the centro-parietal stay-pure positivity. By contrast, children and adolescents appeared to engage in sustained preparatory-control activity that lasted until target onset. These differences were ac-companied by changes in scalp distribution suggesting that, be-tween 200–600 ms, young adults and adolescents exhibited more frontally oriented scalp distributions than children.
Switch costsFlong cue-target interval (1200 ms). Figure 8
de-picts the ERP waveforms for stay and switch trials in the long CTI condition, and Figure 9 depicts the topographic maps of the time windows with significant switch-stay differences.
Cue-target interval. Young adults first displayed a reliable switch-stay positive-going difference across the midline, from 100–200 ms post-cue onset. Between 300–1000 ms, switch trials elicited more positive-going activity than stay trials mainly at centro-parietal locations (see Table 6). By contrast, adolescents did not evince greater positive-going activity to switch than stay trials until later in the post-cue interval, between 600–700 ms at centro-parietal electrode locations (Table 6). Unlike young adults and adolescents, children did not show reliable differences be-tween stay and switch trials in the long CTI condition.
Age-related differences. To test for age-related differences, an Age groupTrial TypeElectrode ANOVA was computed for the 600–700 ms time window (young adults vs. adolescents). Neither the Age GroupTrial Type nor the Age GroupTrial TypeElectrode interaction was significant, suggesting that Fz
FCz
Cz
CPz
Pz
SWITCH COSTS - Short CTI
Young Adults
Fz
FCz
Cz
CPz
Pz
Fz
FCz
Cz
CPz
Pz
Adolescents Children
5 μV +
−
Switch
Stay
5 μV +
−
5 μV +
− CUE TARGET
600 0 200 400
POST-CUE Effects
POST-TARGET Effects
200 400
CUE TARGET
600 0 200 400
200 400
CUE TARGET
600 0 200 400
200 400
reliable differences in effect magnitude and scalp distribution were not present (ps4.2).
Post-target interval. As observed in Figure 8 and confirmed by statistical analyses, stay-switch differences terminated prior to target presentation for all age groups. Therefore, switch-stay differences in the post-target interval were not examined.
In summary, when preparing for a switch, both young adults and, to a limited extent, adolescents produced a reliable switch-stay positivity, which onset earlier for young adults and was sustained for a longer time period relative to that elicited by stay cues. By contrast, children did not evince reliable switch-stay positive activity at any time interval during the long CTI.
Discussion
The aim of the current study was to investigate age-related differences in anticipatory cognitive control in a cued task-switching paradigm. Behavioral and ERP indices for mixing and switch costs, putatively reflecting different anticipatory control processes, were recorded in young adults, adolescents, and chil-dren, and will be discussed separately below.
Mixing Costs: Task-Set Updating
All age groups showed RTand accuracy mixing costs, indicating that all participants were susceptible to the performance decre-ments induced by performing the same task repeatedly in mixed compared to pure blocks. Importantly, the magnitude of behav-ioral mixing costs for the different age groups did not differ for the long CTI of 1200 ms, while developmental differences
SWITCH COSTS - Short CTI
TARGET
Δ = 0.2 μV
Adolescents Young Adults
TARGET
Children
TARGET 200-300 ms 300-600 ms
CUE
CUE
CUE
0-100 ms 100-200 ms
200-300 ms 300-600 ms 0-100 ms 100-200 ms
300-600 ms 0-100 ms
Δ = 0.4 μV
Δ = 0.4 μV
Figure 5.Surface potential scalp topographies for the switch minus stay difference waveforms in the short CTI condition, depicted for the time windows in which the magnitude differences were reliable. Front of the head is at the top. Shaded areas reflect negativity; unshaded areas reflect positivity.
Table 4.Results of the Trial Type (Stay, Switch)Electrode (Fz, FCz, Cz, CPz, Pz) ANOVAs for the Short Cue-Target Interval Condition
Switch vs. Stay Trial type Trial typeElectrode
Short CTI Time window F Zp2 F e Zp2 Follow-upw
Young adults 0–200 ns ns
200–300 ns 20.6nnn .47 .52 None
300–400 ns 13.9nnn .45 .42 CPz Pz
400–500 8.3nn .30 22.9nnn .50 .54 CPz Pz
500–600 10.9nn .36 41.7nnn .51 .69 CPz Pz
Post-target 0–100 6.1n .24 28.4nnn .49 .60 CPz Pz
100–200 ns 15.1nnn .35 .44 CPz Pz
200–300 ns ns
Adolescents 0–200 ns ns
200–300 ns 5.5nnn .37 .30 Fz (neg) FCz (neg)
300–400 ns 7.7nn .38 .37 None
400–500 7.4n .36 8.3nn .36 .39 CPz Pz
500–600 11.3nn .47 8.5nn .37 .40 Cz CPz Pz
Post-target 0–100 15.6nn .55 7.9nn .39 .38 Cz CPz, Pz
100–200 23.1nnn .64 4.9nn .38 .27 FCz Cz CPz Pz
200–300 ns 5.4nnn .45 .29 Pz
300–400 ns ns
Children 0–300 ns ns
300–400 ns 9.6nn .38 .42 None
400–500 ns 9.1nn .40 .41 None
500–600 ns 14.4nnn .40 .50 CPz Pz
Post-target 0–100 10.3nn .44 ns
100–200 ns ns
emerged for the short CTI of 600 ms. Specifically, adolescents showed significantly larger accuracy costs than young adults, although accuracy rates were near ceiling for both groups. Hence, this finding should not be given undue weight. More important, children showed larger RT mixing costs than young adults in the short CTI. Overall, these results are compatible with
the extant literature, reporting age differences in RT mixing costs (Crone et al., 2004; Crone, Bunge, et al., 2006; Karbach & Kray, 2007; Kray et al., 2004, 2008; Reimers & Maylor, 2005; but see Crone, Bunge, et al., 2006, for an exception).
Different theoretical accounts have been provided to explain such developmental differences in mixing costs. According to the working-memory load theory (Los, 1996; Rogers & Monsell, 1995), the reduction in mixing costs throughout development has been interpreted as reflecting an increase in working memory capacity (Gathercole, 1999; Gathercole, Pickering, Ambridge, & Wearing, 2004). Alternatively, increased efficiency in task-set updating might account for the developmental trajectory of mix-ing costs that we and others have observed. Developmental differences in mixing costs might also be primarily related to the use of bivalent stimuli; that is, stimuli that can activate multiple task sets depending on which rule is currently active (Rubin & Meiran, 2005). For instance, in our paradigm, the digit 3 is as-sociated with the response ‘‘3’’ for the task ‘‘Which digit?’’ (compatible response), but it is associated with the response ‘‘1’’ for the task ‘‘How many?’’ (incompatible response). The ambi-guity generated by bivalent stimuli needs to be overcome by re-instating or updating the currently active task set and its associated response contingencies. Children might be especially challenged in recruiting these cognitive processes on incompat-ible trials leading to increased RT mixing costs compared to young adults. However, contrary to this argument, RT mixing costs on incompatible relative to compatible trials did not differ among age groups. That is, Age GroupCompatibility (com-patible, incompatible) ANOVAs on proportional RT mixing costs failed to return reliable Age GroupCompatibility inter-actions (ps4.05). This result reduces the force with which the ambiguity account can be applied to explain the age differences
Fz
FCz
Cz
CPz
Pz
MIXING COSTS - Long CTI
Pure Stay
Young Adults
Fz
FCz
Cz
CPz
Pz
Fz
FCz
Cz
CPz
Pz
Adolescents Children
POST-CUE Effects
POST-TARGET Effects
Figure 6.Grand mean cue-locked ERPs for pure and stay trials in the long CTI condition. A 10-Hz low-pass filter was applied. Shading indicates intervals with significant stay-pure differences.
MIXING COSTS - Long CTI
Δ = 0.2 μV
Adolescents Young Adults
Children 100-200 ms
TARGET CUE
CUE TARGET
TARGET CUE
100-200 ms
600-700 ms
Δ = 0.3 μV
Δ = 0.5 μV 200-600 ms
200-600 ms
200-600 ms
700-800 ms
700-800 ms
800-1200 ms
800-1200 ms
in mixing costs. On this basis, it is more likely that increased efficiency in task-set updating and/or increments in working memory capacity are key components putatively accounting for the reduction in mixing costs with increments in cognitive devel-opment.
The age-related behavioral differences in mixing costs are congruent with the age-related differences that were observed for the post-cue ERP positivity for stay compared to pure trials in the short CTI. This ERP effect has been attributed to anticipa-tory task-set updating (Jost et al., 2008; Kray et al., 2005; West, 2004; Wylie et al., 2008). In young adults and adolescents, cues elicited a positive stay-pure difference starting as early as 100 ms post cue, and extending throughout the cue-target interval. Importantly, although young adults and adolescents showed frontal stay-pure differences in early time intervals (100–300 ms), these were smaller in adolescents. By contrast, children did not evince early frontal (or parietal) stay-pure differences in either of these two intervals.
Efficacious executive control of task sets is thought to require involvement of the PFC, as indicated by neuropsychological studies of patients with circumscribed lesions and hemodynamic neuroimaging studies (for a review, see Sakai, 2008). Based on these kinds of data, it could be speculated that the reduction in early frontally oriented positive activity in adolescents and its absence in children might reflect reduced involvement of pre-frontal cortex in cognitive control. Admittedly, the ERP
tech-nique does not easily support neuroanatomical inferences. Nonetheless, our speculation is compatible with evidence of protracted frontal lobe maturation (Bunge, Dudukovic, Tho-mason, Vaidya, & Gabrieli, 2002; Diamond, 2002) and reduced frontal activations in fMRI studies of task switching in children and adolescents (Bunge & Zelazo, 2006; Crone, Donohue, Ho-nomichl, Wendelken, & Bunge, 2006). In showing evidence of early-latency frontal ERP effects in young adults in association with reduced mixing costs, our findings supplement the extant task-switching literature, which has predominantly concentrated on switch costs and their associated centro-parietal, positive-magnitude effects.
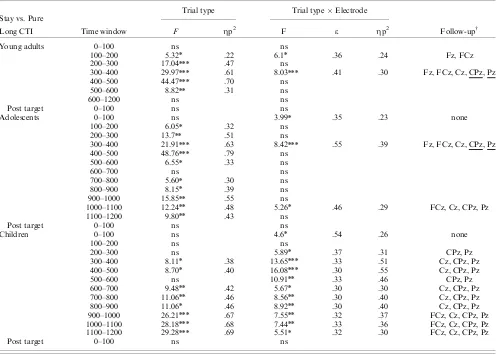
The stay-pure ERP differences for children may reflect an early point in the development of the processes involved in task-set updating. First, children did not show an adult-like pattern of frontal scalp activity for the stay-pure differences during either the short or long CTI, even though, in the latter, the potential for longer-duration preparatory activity was made available. Sec-ond, in contrast to young adults and adolescents, stay-pure pos-itive differences for children did not emerge until after 300 ms post cue in the short CTI and were also delayed by 100 ms in the long CTI compared to young adults and adolescents. Nonethe-less, when sufficient preparation time was available in the long CTI, children showed prominent stay-pure differences through-out the CTI at posterior locations (Figure 6). Notably, such delayed onset of preparatory activity in children in the short CTI Table 5.Results of the Trial Type (Pure, Stay)Electrode (Fz, FCz, Cz, CPz, Pz) ANOVAs for the Long Cue-Target Interval Condition
Stay vs. Pure Trial type Trial typeElectrode
Long CTI Time window F Zp2 F e Zp2 Follow-upw
Young adults 0–100 ns ns
100–200 5.32n .22 6.1n .36 .24 Fz, FCz
200–300 17.04nnn .47 ns
300–400 29.97nnn .61 8.03nnn .41 .30 Fz, FCz, Cz, CPz, Pz
400–500 44.47nnn .70 ns
500–600 8.82nn .31 ns
600–1200 ns ns
Post target 0–100 ns ns
Adolescents 0–100 ns 3.99n .35 .23 none
100–200 6.05n .32 ns
200–300 13.7nn .51 ns
300–400 21.91nnn .63 8.42nnn .55 .39 Fz, FCz, Cz, CPz, Pz
400–500 48.76nnn .79 ns
500–600 6.55n .33 ns
600–700 ns ns
700–800 5.60n .30 ns
800–900 8.15n .39 ns
900–1000 15.85nn .55 ns
1000–1100 12.24nn .48 5.26n .46 .29 FCz, Cz, CPz, Pz
1100–1200 9.80nn .43 ns
Post target 0–100 ns ns
Children 0–100 ns 4.6n .54 .26 none
100–200 ns ns
200–300 ns 5.89n .37 .31 CPz, Pz
300–400 8.11n .38 13.65nnn .33 .51 Cz, CPz, Pz
400–500 8.70n .40 16.08nnn .30 .55 Cz, CPz, Pz
500–600 ns 10.91nn .33 .46 CPz, Pz
600–700 9.48nn .42 5.67n .30 .30 Cz, CPz, Pz
700–800 11.06nn .46 8.56nn .30 .40 Cz, CPz, Pz
800–900 11.06n .46 8.92nn .30 .40 Cz, CPz, Pz
900–1000 26.21nnn .67 7.55nn .32 .37 FCz, Cz, CPz, Pz
1000–1100 28.18nnn .68 7.44nn .33 .36 FCz, Cz, CPz, Pz
1100–1200 29.28nnn .69 5.51n .32 .30 FCz, Cz, CPz, Pz
Post target 0–100 ns ns
most likely reflected inefficient timing of the onset of advance task-set updating, which presumably contributed to the chil-dren’s longer RT mixing costs in that condition.4
To further support the hypothesis that delays in the timing of preparatory activity were associated with increments in mixing costs, correlations between the peak latency of the stay minus pure positivity and proportional RT mixing costs were com-puted.5The data from the midline locations were used. Because only children and young adults differed in mixing cost magnitude in the short CTI, we computed across-subject correlations be-tween the individual latencies of this peak and the individual mixing costs. For the young adults, we obtained the peak laten-cies of the stay-pure positivity using a range of 100 to 600 ms post cue (i.e., within the cue-target interval). The young adults’ mean peak latency (SD) at Pz was 395 ms (65 ms). For the chil-dren, whose amplitudes were prolonged into the target interval, the relevant search epoch was 300 to 900 ms post cue (the latter of which corresponded to 300 ms post target). The children’s mean
peak latency (SD) at Pz was 549 ms (161 ms). With the exception of Fz, the correlations at the remaining sites were positive and highly significant, 0.55 at FCz (po.001), 0.39 at Cz (po.02), 0.40 at CPz (po.02), and 0.46 at Pz (po.007). Hence, these results add strength to the argument that delayed antici-patory task-set updating may have been responsible for the larger mixing costs in the children compared to the young adults.
In addition, the three age groups differed in the offset latency of anticipatory control indexed by the stay-pure positivity. The positivity was resolved by target onset in young adults in the short CTI and, similarly, by 600 ms in the long CTI. This sug-gests that young adults were able to fully carry out anticipatory, endogenous control processes during the short 600-ms prepar-atory interval as well as the long 1200-ms CTI. This indicates that the young adults were well prepared for exogenous, stimulus-driven processing upon target presentation (see also Jost et al., 2008; Monsell & Mizon, 2006, for similar conclusions on switch costs). Although adolescents showed increased positivity for stay relative to pure trials as early as 100 ms post cue, this difference was sustained for approximately 100 ms post target in the short CTI. However, as already pointed out, this short carryover effect did not translate into reliably increased RT mixing costs; rather, it was associated with decreased accuracy.
Conversely, differences in the latency of anticipatory control processes in children compared to young adults were associated with larger RT mixing costs. In the short CTI, the centro-parietal positivity onsetting at 300 ms post cue was protracted for at least 300 ms following the target. Importantly, because the post-target differences were similar in scalp topography to those occurring in the CTI (i.e., centro-parietal), they most likely reflected a continuation of cue-related processing that persisted Fz
FCz
Cz
CPz
Pz
5 μV +
−
SWITCH COSTS - Long CTI
Stay
Young Adults
Fz
FCz
Cz
CPz
Pz
Fz
FCz
Cz
CPz
Pz
Adolescents Children
CUE TARGET
600 0
200400
POST-CUE Effects
POST-TARGET Effects 800
1000 1200
5 μV +
−
CUE TARGET
600 0
200400 8001000 1200
5 μV +
−
CUE TARGET
600 0
200400 8001000 1200
Switch
Figure 8.Grand mean cue-locked ERPs for switch and stay trials in the long CTI condition. A 10-Hz low-pass filter was applied. Shading indicates intervals with significant switch-stay differences.
4
It should be noted, however, that caution must be exercised when interpreting the onset, offset, and duration of an ERP process. For ex-ample, the duration of an ERP amplitude difference does not necessarily reflect the duration of the underlying process (Rugg & Coles, 1995). According to Rugg and Coles (1995), the difference in onset provides an upper bound on the latency at which two processes diverge. That is, the underlying process could have onset earlier without necessarily being reflected in latency changes at the scalp. Nonetheless, as Rugg and Coles (1995) also point out, differences in timing can still be used to provide constraints on the temporal course of cognitive processing. Thus, we believe our results still proffer valuable information concerning develop-mental differences in the duration and timing of anticipatory processes in task switching.
5