technical series
68
Interdisciplinary studies of North Atlantic and
Labrador Sea Margin Architecture and
Sedimentary Processes
Preliminary results of investigations during the TTR-13 cruise of
RV
Professor Logachev
July-September, 2003
Editors: N.H. Kenyon
M.K. Ivanov
A.M. Akhmetzhanov
E.V. Kozlova
A. Mazzini
expression of any opinion whatever on the part of the
Secretariats of UNESCO and IOC concerning the
legal status of any country or territory, or its
authori-ties, or concerning the delimitation of the frontiers of
any country or territory.
For bibliographic purposes, this
document should be cited as follows:
Interdisciplinary studies of North Atlantic and
Labrador Sea Margin Architecture and Sedimentary
Processes.
IOC Technical Series No. 68, UNESCO,
2004 (English)
Cover design: A. Akhmetzhanov
Cover pictures: a TV-guided grab and bottom fauna
recovered from the Western Greenland margin.
Printed in 2004
T
1.1.2. Vigrid Diapir Field (Area 1) 1.1.3. Vivian Diapir Field (Area 2) 1.1.4. Conclusions
11..22.. LLooffootteenn BBaassiinn ((AArreeaa 33)) 1.2.1. Introduction
1.2.2. MAK sidescan sonar imagery and 5 kHz subbottom profiling 1.2.2.1. Traenadjupet Slide to Lofoten Basin Channel
1.2.2.2. Lofoten Basin Channel mouth sand lobe 1.2.3. Bottom sampling
11..33.. AAnnddøøyyaa SSlliiddee,, AAnnddøøyyaa CCaannyyoonn aanndd tthhee uuppppeerr LLooffootteenn BBaassiinn CChhaannnneell ((AArreeaa 44))
1.3.1. Introduction
1.3.2. Interpretation of sidescan sonar and profiles 1.3.3. Bottom sampling
1.3.4. Conclusions
22.. WWEESSTT OOFF AAEEGGIIRR RRIIDDGGEE ((LLEEGG 22,, AARREEAA 55))
33.. SSOOUUTTHH GGRREEEENNLLAANNDD MMAARRGGIINN ((LLEEGG 33,, AARREEAA 66)
33..11.. EEiirriikk DDrriifftt
3.1.1. Introduction
3.1.2. 5 kHz hull-mounted profiler 3.1.3. Seismic profiles
3.1.4. MAK-1M sidescan sonar data 3.1.5. Bottom sampling
3.1.6. Conclusions
33..22.. SSeeaammoouunntt
3.2.1. Seismic and OKEAN data 3.2.2. Bottom sampling
3.2.3. Conclusions
44.. SSOOUUTTHHWWEESSTT GGRREEEENNLLAANNDD MMAARRGGIINN ((LLEEGG 44,, AARREEAA 77))
44..11.. IInnttrroodduuccttiioonn 44..22.. SSeeaabbeedd hhiigghhss
4.2.1. Seismic data
4.2.2. OKEAN long range sidescan sonar and hull-mounted profiler data
4.2.3. Bathymetry
4.2.4. MAK 30 kHz deep-towed sidescan sonar and 5 kHz subbot-tom profiler data
4.2.5. Bottom sampling 4.2.6. Discussion
44..33.. CCaannyyoonn oouuttccrrooppss
4.3.1. Seismic and OKEAN data 4.3.2. Bottom sampling
44..44.. SSeeeepp ssiittee
4.4.1. Seismic and OKEAN data 4.4.1.1. Seismic description
4.4.1.2. Preliminary interpretation of seismic lines PSAT-236, -237 and -238
4.4.2. Deep-towed sidescan sonar data (MAKAT-88 to 91) 4.4.3. Bottom sampling
44..55.. DDaavviiss SSttrraaiitt HHiigghh 4.5.1. Introduction 4.5.2. Seismic data
4.5.3. Sidescan sonar data 4.5.4. Bottom sampling 4.5.5. Main results
44..66.. CCoonncclluussiioonnss
55.. WWEESSTTEERRNN PPOORRCCUUPPIINNEE BBAANNKK ((LLEEGG 55,, AARREEAA 88))
55..11.. IInnttrroodduuccttiioonn
ABSTRACT
Interdisciplinary studies of North Atlantic and Labrador Sea margin architecture and sedimentary pro-cesses were conducted by RV Professor Logachev during the 13th Cruise of the UNESCO-IOC Training-Through-Research Programme. The studies were carried out in 8 areas.
Four locations were visited on the Norwegian margin. Areas 1 and 2 are situated on the Vøring Plateau comprising two fields of shallow diapiric structures of similar nature to diapirs of the Vema filed studied during TTR-8 cruise in 1998. As a continuation of this work, seismic and acoustic studies of the Vigrid (Area 1) and Vivian (Area 2) diapir fields, located on the Vøring Marginal High and the Vøring Basin respectively, were undertaken.
Studies in the Area 3 focussed on the Traenadjupet Slide and Lofoten Basin floor.The distal part of the slide was studied in detail with the help of sidescan sonar, high resolution seismic profiles and bottom sampling in order to elucidate the processes and age of sediment failure.
The Lofoten Basin Channel was crossed on the lower slope where it has a thick unit of acoustically lami-nated sediments on its northern flank. A deep towed sidescan sonar line across the distal part of the channel shows erosional features on the channel floor, especially where it cuts through a probable slide deposit. The area beyond the channel, which had been proved to be difficult to sample on this and an earlier cruise, was succes-fully sampled by the vibracorer and found to be sandy. A highlight of this study was the discovery of possible sand volcanoes on the channel-mouth lobe.
In the 4th Area comprising Andøya Slide and Andøya Canyona large dataset was obtained using high-resolution sidescan sonar, onboard profiler and coring. It will help to identify the age of the most recent slide event and to study sediments that overlie the slide deposits. The adjacent Andøya Canyon was investigated with sidescan sonar, TV-system and bottom sampling in order to confirm the types of processes transporting sediments through the canyon and whether they are still active.
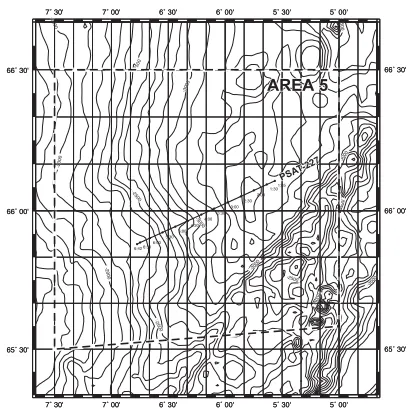
On the passage to Reykjavik (Iceland) a seismic/hull mounted profiler line was run across several supposed diapiric structures on the floor of the Norwegian Basin(Area 5) between the Aegir and Jan Mayen Ridges. The presence of diapiric structures was confirmed.
On the Greenland margin studies were conducted in two main areas. In Area 6 the Eirik Ridge, whose sed-imentary sequence represents an excellent record of the history of global ocean circulation and climate change, was investigated. Location of sites with the highest deposition rate during the Holocene was the main goal of the investigations. A deep towed profile was used to get a high resolution acoustic record and two cores were obtained for detailed analysis, and in particular to determine whether there is evidence for high frequency changes of current speed. This was a reconnaissance for a further UK research cruise to the area in 2004 that will obtain more cores and undertake current measurements.
Principal targets of investigation within Area 7 covering the northern margin of the Labrador Sea and Davis Strait were chosen on the basis of multi-channel seismic data of the Geological Survey of Denmark and Greenland. Positive ("diapir-like") structures on the sea bottom were studied in detail with a variety of methods. Samples collected from two of these structures suggest a volcanic and crystalline basement rather than a diapir-ic origin.
The Pre-Neogene seabed outcrops were studied on the flanks of canyons and valleys extending from the upper continental slope into the deep-water basin west of the Fylla Bank and in the Davis Strait High area. Lithology of the samples and biological specimens were preliminarily identified onboard and stored for shipment ashore and further analysis.
The areas studied for possible gas or fluid seeping were proved to be strongly disturbed by iceberg plough-ing, which provided an unexpected opportunity for studies of the glacial history of the Davis Strait area. Along with a series of gravity cores from the seep areas a unique sandy-gravelly core was collected with a vibracorer in the northernmost of the study areas.
A
AC
CK
KN
NO
OW
WL
LE
ED
DG
GE
EM
ME
EN
NT
TS
S
The thirteenth Training-through-Research Cruise has received financial support from a variety of sources among which are: the Intergovernmental Oceanographic Commission (IOC) of UNESCO, EUROSTRATAFORM Project of EC, University of Tromsø, RAPID Project of NERC (UK), Southampton Oceanography Centre, Geological Survey of Denmark and Greenland, Geological Survey of Ireland, the Russian Ministry of Science and Technological Policy, the Polar Marine Geological Research Expedition (PMGRE) of the Russian Ministry of Natural Resources and Moscow State University (Russia). Logistic sup-port was provided by the Netherlands Institute for Sea Research (NIOZ).
A number of people from different organizations supported the Training-through-Research Programme and were involved in the cruise preparation. The editors would like to express their gratitude for the contributions made by Prof. I. F. Glumov (Ministry of Natural Resources of the Russian Federation), Dr. A. Suzyumov (UNESCO), Dr. P. Bernal (Executive Secretary, IOC), and Dr. V. Zhivago (Ministry of Science and Technological Policy of the Russian Federation).
Credit also should be given to Maarten van Arkel of the NIOZ and Prof. Dr. B. A. Sokolov (Moscow State University) for their continuous administrative support.
Thanks are due to the administration and staff of the PMGRE (St. Petersburg) for their co-operation and assistance with the cruise organization. Captain B. Dobriakov and the skill-ful crew of the RV Professor Logachev are thanked for successskill-fully carrying out the opera-tions at sea.
The 13th cruise (TTR-13) of the UNESCO-IOC "Training-through-Research" programme was carried out onboard the RV Professor Logachev (Russia) from 10 July to 24 September 2003. The cruise started and terminated in St. Petersburg (Russia). The first group of international participants embarked in Copenhagen (Denmark) on 13 July.
The cruise was divided into 5 legs sepa-rated by port calls, where partial exchange of the scientific party was made. After Copenhagen, the port calls were to: Tromsø (Norway), on 29-30 July; Reykjavik (Iceland), on 5 August; Nuuk (Greenland), on 13 and 30-31 August; Dublin (Ireland), on 14-15 September; and Copenhagen (Denmark), on 21 September. The Co-Chief Scientists of the various legs of the cruise were: M. Ivanov
(Russia), N. Kenyon (UK), J.S. Laberg (Norway), N. Poulsen (Denmark), T. Nielsen (Denmark), A. Kuijpers (Denmark) and X. Monteys (Ireland).
A team of forty-two scientists, postgrad-uate and undergradpostgrad-uate students from the following nine countries participated: Belgium, Denmark, Georgia, Germany, Ireland, Norway, Portugal, Russia and UK. The participating students were involved in all stages of acquisition and preliminary pro-cessing of a multidisciplinary set of geophys-ical and geologgeophys-ical data. Daily seminars, lec-tures and discussions of the results facilitated high-level on-the-job training of the students and young scientists.
The objectives of the cruise were two-fold: to conduct detailed investigations of geological processes on the deep continental
IIN
NT
TR
RO
OD
DU
UC
CT
TIIO
ON
N
1-Vigrid Diapir Field, Vøring Plateau; 2- Vivian Diapir Field, Vøring Plateau; 3- Lofoten Basin; 4 - Andøya Slide, Andøya Canyon and the upper Lofoten Basin Channel; 5- West of Aegir Ridge; 6- Eirik Drift; 7- Southwest Greenland Margin;
8- Western Porcupine Bank
margins of Europe and Greenland and to train students in marine geoscience research. The following scientific themes were addressed during the cruise:
1. Deep-water depositional systems in the North Atlantic;
2. Rapid climate changes and thermoha-line circulation;
3. Petroleum potential and fluid escape structures on the West Greenland margin;
4. Neotectonics and down-slope process-es on continental margins;
5. Carbonate mud mounds.
Several areas were selected on the Norwegian margin for studies of shallow diapirism (Areas 1 and 2: Vigrid and Vivian diapir fields) and deep-water depositional systems (Area 3: distal part of the Traenadjupet Slide and the mouth of the Lofoten Basin Channel; Area 4: Andøya Slide and Andøya Canyon/Lofoten Basin Channel).
Another poorly known diapiric province, located to the north-west of the Aegir Ridge off central Norway (Area 5), was chosen for a short study of diapir distribu-tion, morphology and associated features during the passage to the Greenland margin. Survey in Area 6, located on the Eirik Ridge, a large contourite drift off the south-ern tip of Greenland, was aimed at identify-ing sites with a thick Holocene sedimentary sequence, which will later be used for studies of rapid climatic change and the extent to which it is controlled by thermohaline circu-lation.
Essential elements of the research pro-gram in Area 7 (Western Greenland) were studies of the lithological characteristics and age of the Pre-Neogene seabed outcrops, also including volcanics, which are believed to be present on seabed highs and flanks of canyons and valleys extending from the shelf into the deep-water basin. Studies of shallow subseabed strata and seabed morphological features (like diapirs and pockmarks), possi-bly indicative of fluid/gas escape, were also planned. Apart from these topics, we expect-ed to gain information from turbidite and contourite-dominated areas, among others, to determine whether these sedimentary
pro-cesses are currently active.
B
Tove Nielsen (Co-Chief Scientist, Legs 3-4) Niels Poulsen (Co-Chief Scientist, Leg 3) Antoon Kuijpers (Co-Chief Scientist, Leg 4)
Finn Dalhoff
Xavier Monteys (Co-Chief Scientist, Leg 5) Oisin O'Briain
Jacinta Moore James Riordan
N NOORRWWAAYY
Jan Sverre Laberg (Co-Chief Scientist, Leg 1) Henrik Rasmussen
Mikhail Ivanov (Co-Chief Scientist, Legs 1-5) Elena Kozlova
Neil Kenyon (Co-Chief Scientist, Legs 1-3) Andrey Akhmetzhanov 10 July - 24 September 2003
The RV Professor Logachev is a Russian marine geology research and survey vessel equipped with geophysical survey and seabed sampling equipment. She is operated by the State Enterprise "Polar Marine Geological Research Expedition" St. Petersburg. The vessel has: a draught of 6.66 m, length of 104.5 m, width of 16 m, net ton-nage of 1351 ton, displacement of 5700 ton and is powered by two 3500 hp diesel engines.
Navigation
Positioning during the TTR-13 cruise was acquired using an Ashtech GG24 GPS + GLONASS receiver. The use of both GPS and GLONASS satellite configurations allows for greater accuracy than is available from con-ventional GPS alone, with up to 60% greater satellite availability. Positions are calculated in real-time code differential mode with 5 measurements per second and an accuracy of +/- 35 cm (75 cm at 95% confidence limits) with optimal satellite configuration. Realistic positioning accuracy under normal satellite configuration for European waters is assumed as ca. 5 m. Positioning when the vessel is moving also utilizes Doppler veloc-ity determinations from the differential code
signal to generate a vessel speed accuracy of 0.04 knots (0.1 at 95% confidence limits) with optimum satellite configuration.
The GPS+GLONASS receiver is located centrally with accurate levelling to sampling and equipment deployment positions on the vessel allowing precise back navigation. Seabed sampling positions with the gravity corer are normally 5% of the accuracy of the vessel position due to their rapid deploy-ment. MAK1-M sidescan sonar and deep-towed video system are all fitted with a pinger allowing precise navigation between the vessel and sub-sea surface position. This is necessary as deep-towed equipment is subject to greater spatial differences with respect to the vessel. This underwater navi-gation is based on the Sigma-1001 hydroa-coustic system. Four stationary aerials, spaced 14 m apart, are hull mounted and receive acoustic signals from pingers attached to deployed equipment in short-base mode operating between 7-15 kHz. The signal emitted by the sub-surface pinger is tracked on board and accurate x,y position-ing of the device relative to the vessel is com-puted taking into account roll, trim and ship's speed. Error positioning of this method usually does not exceed 1-2% of water depth.
M
ME
ET
TH
HO
OD
DSS
The navigation system is linked with the ship's main and additional thrusters enabling highly accurate dynamic position-ing, which is routinely used during deep-towed acoustic and video surveys and sam-pling operations.
Seismic profiling
The seismic source usually consisted of one 3 litre airgun, at a pressure of 120 bar (12 MPa). The airgun was towed at a depth of approximately 2-2.5 m and was fired every 10 seconds (i.e. approximately every 30 m). The streamer consisted of one active section, 30 m long, with 50 hydrophones, towed at a depth of approximately 2.5-3 m. The offset between the seismic source and the centre of the live hydrophone array was 135 m.
The data was acquired digitally using MSU developed software and preliminarily processed with RadExPro software, which was provided to the UNESCO MSU Centre for Marine Geosciences by GSD Productions, Moscow. The signals were low-pass filtered analogically to 250 Hz in the acquisition stage. The sample interval was 1 ms and the record length 3 seconds.
The basic processing sequence consisted of definition of the acquisition geometry, static shifts correction, spiking deconvolu-tion, amplitude recovery by spherical diver-gence correction and Butterworth bandpass filtering (20-60-180-240 Hz).
Hull-mounted acoustic profiler
A hull-mounted 5.1 kHz profiler was routinely used during most of the opera-tions, with a continuous paper output and a selective recording of the digital data.
Sidescan sonar systems
O K E A N
The OKEAN is a long-range sidescan sonar operating at a frequency of 9.5 kHz, which, with its up to 15 km swath range and 6 knots towing speed, is well suited for reconnaissance surveying of large deep-sea
areas. The OKEAN vehicle is towed behind the ship at about 40-80 m below the sea sur-face. Depending on the waterdepth and reso-lution required the swath could be set to 7 or 15 km.
M A K - 1 M
The MAK-1M deep-towed hydroacous-tic system contains a high-resolution sides-can sonar operated at frequencies of 30 and 100 kHz, with a swath range of up to 2 km (1 km per side) and a subbottom profiler, oper-ated at a frequency of 5 kHz. The sonar has a variable resolution of about 7 to 1 m across track (maximum range to centre) and along track (center to maximum range). During TTR-13, the fish was towed at a nearly con-stant altitude of about 100-150 m above the seafloor at a speed of 1.5-2 knots for 30 kHz surveys and about 50 m above seafloor for 100 kHz. The positioning of the tow-fish was archived with a short-based underwater nav-igation system.
The data from the tow-fish was trans-mitted on board through a cable, recorded digitally, and stored in Seg-Y format, with a trace length of 4096 2-byte integer samples per side. Time-variant gain was applied to the data while recording, to compensate the recorded amplitudes for the irregularity of the directional pattern of the transducers as well as for the spherical divergence of the sonic pulse.
included slant-range-to-ground-range (SLT) correction of the sonographs, geometrical correction of the profiles for recovery of the real seafloor topography, and smoothing average filtering of both types of records. Individual lines were geometrically correct-ed for the towing specorrect-ed of the fish, convertcorrect-ed into a standard bitmap image format. Some image processing routines, such as his-togram equalization and curve adjustment, which are aimed at improving the dynamic range of the imagery were also applied before printing out. Geographic registration of the acquired images was also done onboard.
Underwater photo and television system
The television system operating onboard cruise TTR-13 is a deep towed system designed for underwater video surveys of the seabed at depths of up to 6000 m. It con-sists of onboard and underwater units. The onboard part comprises the control units with video amplifier and VCR. The power for the underwater system is supplied through a conductive cable. The underwater equipment comprises the support frame with light unit, the high-pressure housing con-taining a "Canon M1" digital camera and the power supply unit.
The TV system is controlled from onboard by the winch operator, who visual-ly controls the distance from the camera to the seafloor. This is assisted by a 1.5 m long rope with a weight at the end attached to the
frame. It is usually towed along the seafloor enabling the operator to estimate the altitude of the instrument above the seafloor. Lights and video camera are switched on/off by the operator from onboard. The non-stop under-water record on the digital camera lasts for 2 hours in the "LP" mode. Onboard VCR keeps a continuous record during the whole sur-vey, which can be up to 6 hours.
Sampling Tools
G r a v i t y c o r e r
Coring was performed using a 6 m long c. 1500 kg gravity corer with an internal diameter of 14.7 cm.
One half of the opened core was described on deck, paying particular atten-tion to changes in lithology, colour and sedi-mentary structures. All colours relate to Munsell Colour Charts. The other half was measured for changes in magnetic suscepti-bility using a Bartington Instruments Magnetic Susceptibility meter with a MS2E1 probe. Magnetic susceptibility reflects the ease with which a material can be magne-tised. This property is most strongly influ-enced by grain-size, heavy mineral content and is inversely related to carbonate content and diagenetic ferric mineral reduction.
B o x C o r e r
Box cores were taken using a Reineck box-corer with a 50 x 50 x 50 cm box capable of retrieving 185 kg of undisturbed seabed surface sample. Lowering and retrieving operations are conducted using a hydraulic A-shaped frame with a lifting capacity of 2 ton.
K a s t e n - c o r e r
The corer is square in crosssection with a weight of about 600 kg and dimensions of 0.4x0.4x1.8 m. The recovery volume is up to 0.3 m3. The closure of the instrument is per-formed by two sliding plates and triggered during pull-up. The instrument is particular-ly useful for obtaining large samples of loosely packed coarse-grained sediment.
D r e d g e
The dredge comprises a 1 m2, rectangu-lar steel gate with chain mesh bag trailing behind and a 0.5 ton weight attached to the wire 3 m in front of the gate. The mesh bag also has a rope bag inside and the mesh size is ~5 cm. The dredge was deployed ~250 m in front of the identified target site and the ship moved at 0.5 kts between 500 and 1500 m ensuring the dredge was pulled up-slope. On some sites, the bottom was monitored with a 3.5 kHz hull-mounted single-beam echosounder. At all times, the ship's velocity and position were monitored using GPS. Tension on the trawl-wire was monitored in the winch cab by both ink-line paper roll and by a tension meter. "Bites" of up to 10 tons on the trawl wire were recorded in this way.
T V - g u i d e d g r a b
SGS-4/1 hydraulically operated grab system was used during the cruise. The 3100 kg system is able to sample dense clayey and sandy sediments as well as deep water Gravity corer arrives on the working deck.
Box corer on the working deck.
basalts and sulphide ores. SGS-4/1 can be used at depths up to 4000 m. The maximum sample volume for soft sediment is 1 m3. The grab is controlled by an operator from onboard and can be opened and closed again at any given time. The grab is positioned with the short base SIGMA 1000 underwater navigation system. The grab is equipped with a built-in digital camcorder with the video signal being both stored locally and transmitted back onboard to enable control for the grab operation as well as back-up recording. The lights are powered by a rechargeable battery, enabling up to 1 hour of continuous operation. A second battery kept on board was used to perform consecu-tive dives.
V i b r o c o r e r D I S ( D y n a m i c I m p u l s e S a m p l e r ) - O K E A N .
The system was used for the first time during this TTR cruise.
Purpose and applications
Vibrocorer DIS-OKEAN is intended for coring of a wide range of sediments
includ-ing marls, clays, sands and pebbles with recovery up to 10 m in water depths from 20 to 5000 m.
Technical characteristics
Depth, 20 - 5000 m Recovery, Up to 10 m Sample diameter, 0.1 m
Drive mechanism type - Vibroimpulse Penetration velocity, (min/max) 0.5/10 m/minute
Overall dimensions, 2 x 2 x 4.5/12.5 m Weight, 1500 kg
Working time (at the bottom), 3 to 5 minutes Roughness of the sea Up to force 3
Main components
Principles of operation
When the instrument approaches the seabed the lights and TV camera are switched on by an operator from onboard and video survey commences. Once the sam-pling site is chosen, the corer is lowered on the seafloor and the operator sends the com-mand to turn on a water pump. Water is pumped under a pressure of approx. 12 atmospheres and with a flow rate of about 0.15 m3/min into a vibroimpulser where the water energy is transformed into back-and-forth motion of the corer, which penetrates through the sedimentary sequence. Water then moves along the space between the corer and the casing and flushes the drill hole out. The process is controlled from onboard through the TV-channel.
Once complete penetration is achieved or the penetration velocity decreases down to 10 cm/min the recovery commences. At this stage particular attention is paid to the angle of the wire during the exit, which should not exceed 5°. The recovery speed of the corer from sediments is up to 0.5 m/s. The speed of the instrument's retrieval is up to 2 m/s.
1 vibroimpulser; 2 cased rotatable drill pipe; 3 -frame; 4 - water pump; 5 - rechargeable battery in high-pressure housing; 6 - lights; 7 - control unit; 10
- TV-camera.
11.. N
NO
OR
RW
WE
EG
GIIA
AN
N M
MA
AR
RG
GIIN
N
((L
LE
EG
G 11))
11..11.. V
Vøørriinngg P
Pllaatteeaau
u ((A
Arreeaass 11 aannd
d 22))
11..11..11.. IInnttrroodduuccttiioonn
J.S. LABERG, N.H. KENYON ANDSHIPBOARD
SCIENTIFICPARTY OFLEG1
The Vøring Plateau is a marginal plateau situated offshore of the 200 km wide shelf of mid-Norway at depths of between 1200 m and 1600 m. Beneath the Plateau is a thick SW-NE trending sedimentary basin, the Vøring Basin of Cretaceous age, which is flanked by the Vøring Marginal High to the northwest. The steep Vøring Escarpment forms the northern edge of the Basin. To the east there are platform areas and the Norwegian mainland. This structural config-uration is caused by repetitive tectonic episodes, which culminated with continental break up and initiation of sea floor spreading in early Tertiary (Brekke, 2000; Skogsheid et al., 2000). The onset of rifting in the Norwegian Greenland Sea at 57Ma was accompanied by a transient phase of much increased magmatic production. After the magmatic phase abated, 2 to 3Ma after break up, the margin started to subside by thermal contraction (Eldholm et al., 1989).
Mound fields on the Vøring Plateau have been attributed to diapirism (Hjelstuen et al., 1997; Hovland et al., 1998) caused by the presence of relatively dense Late Pliocene/Pleistocene glacial marine sedi-ments overlying Tertiary biosiliceous oozes of lower density. These have been called the Vigrid Diapir Field, the Vema Diapir Field and the Vivian Diapir Field.
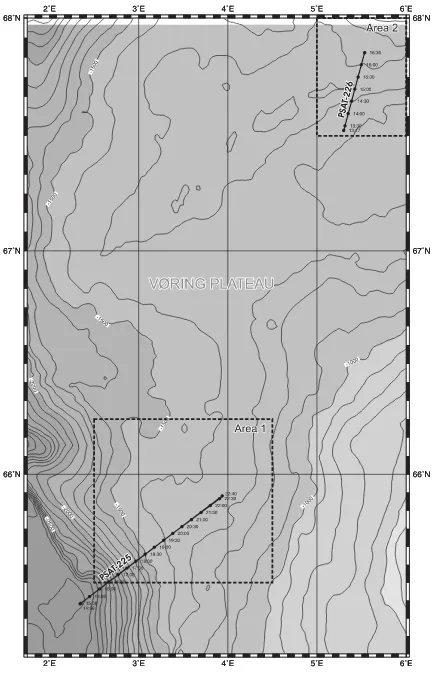
As a part of the testing of the scientific equipment, air gun seismic and OKEAN sidescan sonar lines were run across the western margin of the Vøring Plateau in order to cross the Vigrid Field (Area 1) and another to cross the Vivian Field (Area 2) (Fig.1).
The Vema Diapir Field, in water depths of about 1200 m, was investigated on TTR-8
(Kenyon et al., 1999). Mounds are up to about 200 m thick and without any organised inter-nal structure on the single channel seismic lines. The poor quality of the seismic pre-vented a clear indication of how far down into the sedimentary sequences the potential diapirs extended, but at one place it was seen that the mounds did not extend into the underlying units. The sidescan sonar map-ping showed that the mounds of the Vema Field have a variety of shapes in plan view. Some are elongate with an orientation and others are near equilateral. All have irregular outlines. The high resolution profiles show them to have a veneer of about 10 m of well stratified sediments.
11..11..22.. VViiggrriidd DDiiaappiirr FFiieelldd ((AArreeaa 11))
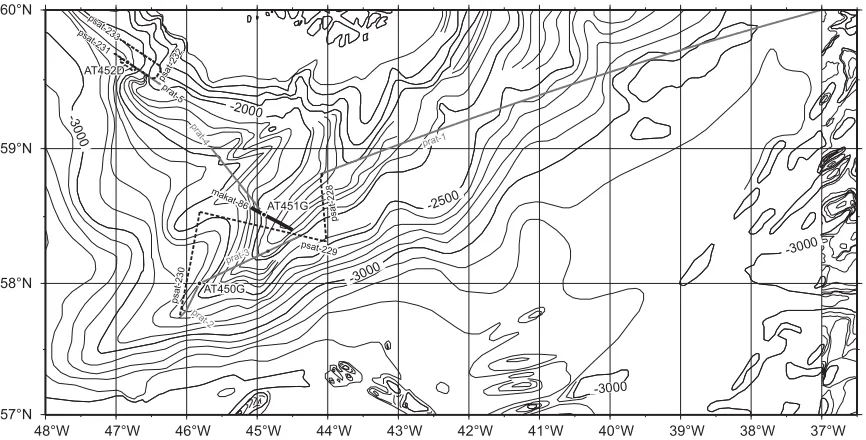
The Vigrid Diapir Field, in water depths of about 1100 m to 1500 m, was studied by Figure 1.Location of the two seismic lines PSAT 225
and PSAT 226 on the Vøring Plateau. Depth con-tours, at 100 m interval, are from GEBCO 2003
Vogt et al. (1999), who called it a probable diapir field and showed by close spaced mapping with 8 kHz profiles that the mounds are elongated NW-SE and have no heat flow anomalies in the one core studied. We are not aware of seismic profiles across this field or across the Vivian Field.
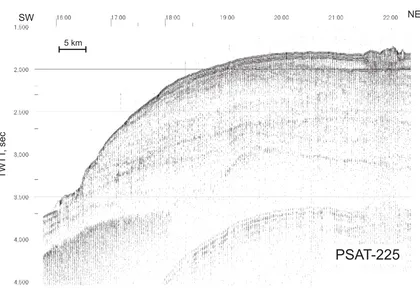
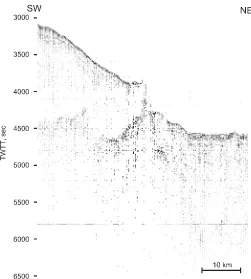
PSAT 225 air-gun seismic line
The PSAT 225 line (Fig. 2) runs north east from about 3000 m near the foot of the western slope of the Vøring Plateau to cross the Vigrid Diapir Field at about 1350 m on the top of the Plateau. The surface of the slope has a series of steps down towards the basin. These seem to mark the traces of shal-low rotational faults that have left several rotated blocks perched above the outer part of the Storegga Slide, which runs out along the base of the slope. There is a prominent and gently sloping basement horizon, with a prolonged character, that stops abruptly at about 18.10GMT. It could be a side echo from a canyon floor, as there is a bight in the con-tours on GEBCO bathymetry, or perhaps it is the top of a buried volcanic sill. Seismic reflectors tend to thicken, and in some cases
to dip, towards the east from a point near to 19.30GMT. West of 19.30GMT there are bas-inward dipping sequences, some of them lens shaped. Thus a buried high may occur somewhere near 19.30GMT. The most super-ficial sequence pinches out on the upper slope and thickens towards the east, reaching a thickness of about 200 msec. A multi-peaked mound stands up to 60 m above the surrounding seafloor. This mound does not originate from below the prominent reflector at the base of the uppermost sequence and, in fact, seems to have a base within the sequence. The base does not seem to be hori-zontal.
The OKEAN record showed no map-pable features.
11..11..33.. VViivviiaann DDiiaappiirr FFiieelldd ((AArreeaa 22))
PSAT 226 air-gun seismic line
Vøring Basin. From the Vøring Escarpment northwards there is a relatively shallow and near horizontal basement marking the Vøring Marginal High. Overlying the base-ment is a relatively horizontal sequence but overlying this is a sequence with a flat and broad base and a triangular cross section (resembling the cross section through a sub-marine channel levee complex). It has a max-imum thickness of about 250 msec and has an irregular upper bounding reflector. There is a similar triangular sequence above it but situated to the south. This is in turn overlain by an uppermost sequence which is seen to drape the underlying topography. This drap-ing is confirmed by the hull-mounted profil-er which shows at least 20 m of well stratified sediment covering the topography. Two sur-face deeps, located where the Vivian Diapir Field is plotted on the figure of Vogt et al. (1999), have what appears to be high ampli-tude reflectors beneath, but these could be an artefact such as a focussing effect.
11..11..44.. CCoonncclluussiioonnss
The proposed Vigrid and Vivian Diapir fields have not, as far as we are aware, been confirmed by sampling. The hull-mounted profiles show that sampling by shallow cor-ing would be difficult. Our scor-ingle channel airgun profiles show features that do not fit well with a diapiric origin. The Vigrid Field mounds are "shallow rooted" and seem to have an irregular basal reflector within the uppermost identifiable sequence. An origin as a field of carbonate mud mounds is possi-ble e.g. Kenyon et al. (2003), but these should have a depth control whereas the mounds are identified as stretching from about 1100 m to over 1500 m depths and the belt of mounds runs across the contours rather than along the contours. Another possible origin is as mounds from a large submarine slide. In this case there should be a slide scar up slope as well as more disintegrated debris flow deposits both up slope and down slope. A bight in the contours, that is over 100 m deep, Figure 3.Seismic line PSAT 226 across the Vøring Escarpment and on to the Vøring Marginal High. The
is noted to the south east and upslope of the Vigrid mounds (GEBCO bathymetry, 2003). Consultation of existing seismic profiles should readily confirm or disprove this hypothesis.
Without having any sidescan sonar cov-erage over the Vivian Field it is not possible to confirm whether there are craters due to fluid flow, moated mounds or other indica-tors of diapirism. It is noted that the upper-most flat based, triangular or lens shaped body has a prominent expression in the sur-face relief. The latest GEBCO bathymetry shows that the peak of this "mound" extends as a 100 km long ridge running along the southern part of the Vøring Marginal High, with a crest at about 1200 m. The shipboard party discussed the possibility of these two triangular shaped sedimentary bodies being some kind of contourite drift, shaped by for-mer oceanic currents flowing along the marginal high. They would be unusual in lying on a horizontal plateau rather than on a slope, like the more common perched drifts (Faugeres et al., 1993). There is a Late Saalian to Early Weichselian drift lying just to the north in similar depths (Laberg et al., 2001).
11..22.. L
Looffootteenn B
Baassiinn ((A
Arreeaa 33))
11..22..11.. IInnttrroodduuccttiioonn
J.S. LABERG ANDN.H. KENYON
The Lofoten Basin, reaching a water depth of more than 3000 m, is located in the northern Norwegian Sea (Fig. 4). It is bound-ed by the Norwegian continental margin to the east, by the very large Bear Island glacial trough mouth fan to the northeast, by the mid oceanic spreading ridge to the north, the Jan Mayen Fracture Zone to the west and by the Vøring Plateau to the south. Significant studies of the area can be found in Damuth (1978), Kenyon (1987), Dowdeswell et al. (1996) and Vorren et al. (1998).
By far the highest sediment input to the basin has been from the northeast, where the input of glacigenic sediments from the Barents Sea are mainly transported through the Bear Island Trough, which was cut by fast flowing ice streams. The resulting fan is built mainly of large numbers of glacial debris flow deposits prograding onto the basin floor.
The other main input area is the Norwegian continental margin through sev-eral large submarine slides, including the Traenadjupet, Andøya and Bear Island Fan Slides, and through several large submarine canyons whose continuation into the basin plain is via the Lofoten Basin Channel. The Andøya Canyon cuts furthest back into the continental shelf and is the only one known to connect directly with the Lofoten Basin Channel. The channel can be followed for almost 200 km into the deepest part of the basin, where it is associated with what has been interpreted, on the basis of location, shape and backscattering style, as a sandy depositional lobe or channel mouth lobe. The distal extent of the lobe is not known as there is no geophysical or geological data from the Lofoten Basin Plain, which lies beyond it.
11..22..22.. MMAAKK ssiiddeessccaann ssoonnaarr iimmaaggeerryy aanndd 55 kkHHzz ssuubbbboottttoomm pprrooffiilliinngg
The Traenadjupet Slide has been broad-ly mapped with GLORIA sidescan sonar, and parts of the upper slide have been mapped in detail by TOBI sidescan sonar (Laberg et al., 2002). Part of the lower slide has been shown by TOBI sidescan sonar and swath bathymetry to be areas of blocky deposits (Dowdeswell et al., 2000). The 30 kHz MAKAT 80 line was run across the lower slide in order to pass through an exist-ing core site and to cross the Lofoten Basin Channel.
The Lofoten Basin Channel had been mapped by GLORIA sidescan sonar (Dowdeswell et al., 1996; Taylor et al., 2002) and seen to be shallow and in part braided, with only a poorly developed levee system. A further survey of the channel mouth was made with TOBI 30 kHz sidescan sonar and ship mounted parasound profiler (Dowdeswell et al., 2000). The channel mouth has a braid-like pattern and beyond is
an extensive flat area with several kinds of longitudinal bedform.
1.2.2.1. Traenadjupet Slide to Lofoten Basin Channel
J.S. LABERG, N.H. KENYON ANDL. PLASSEN
MAK lines 79 and 80 run north and north-northwest, respectively, from the dis-tal deposits of the Traenadjupet Slide, cross-ing the Lofoten Basin Channel and endcross-ing just north of it (Fig. 4). Two sediment wedges are seen on the Traenadjupet Slide. The southern one (Fig. 5) having an off lapping relationship with the northern underlying and hence older one. The sediment wedges have no apparent internal reflectors and each have a rugged positive relief standing above the general surface level. The upstanding relief is assumed to be due to blocks within slide deposits. These blocks are approximate-ly equilateral in planview, unoriented and up to about 60 m high. They are high enough for many of them to cast acoustic shadows. There is a crude sorting of the blocks, which tend to become smaller and sometimes more widely scattered towards the distal edges of both of the wedges. There is a thin veneer of bedded sediments above the older of the wedges, that is not seen above the younger of the wedges (Fig.5).
North of the termination of the older wedge the profiler has well stratified sub-bottom reflectors, fairly parallel, though some discontinuities are evident, as are some thin lenses due to a ponding process in the slight depressions. A prominent reflector is found at a depth of about 4 m. The sidescan records show a faint SSE-NNW oriented, lin-eated signature. The lineations are fairly par-allel to one another, but a few bundles of lin-eations cut across other bundles at a low angle. No corresponding sea floor relief is seen on the profile, whose resolution limit is less then 0.5 m. The lineated fabric may be a regular longitudinal bedform, with a wave-length of about 25 m, caused by the passage of currents running approximately north-wards tonorth-wards the Lofoten Basin Channel. Presumably, because of the direction and the
ponding the currents are turbidity currents rather than oceanic bottom currents. Overbank from the channel there is no thin-ning of sedimentary layers away from the channel, as one would expect for levee build-ing.
The prominent 4 m reflector is seen to be an angular erosional unconformity near to the channel. Terraces are found on both channel walls producing a characteristic steer-head geometry, commonly seen in cross sections through channel fills in ancient rocks and in other seismic profiles e.g. Wheeler et al. (2003). On the channel floor the sidescan record shows a train of wave-forms. The wavelength is about 100 m, which is lower than usual for mud waves and high-er than usual for gravel or pebble waves. They are presumed to be sand waves.
In conclusion, the data shows two wedges of sediment terminating in the southwestern part of the Lofoten Basin. They represent the distal part of two debris flow deposits probably originating from the conti-nental slope in the area of the Traenadjupet Slide where two mass wasting events have been identified, the Traenadjupet Slide at about 4 ka BP and the Nyk Slide at about 16 ka BP (Laberg et al., 2002). The lineated sig-nature may be due to turbidity currents, pos-sibly contemporaneous with the 4 ka BP slide event or a younger one, that flowed further into the basin and fed into the erosional Lofoten Basin Channel. Another prominent turbidity current event is marked by the 4 m deep reflector
1.2.2.2. Lofoten Basin Channel mouth sand lobe
N.H. KENYON, J.S. LABERG, S. ARNOTT, M.
GUTJAHR, H. RASMUSSEN ANDK. VANLANDEGHEM
Figure 6. Fragment of the line MAKAT-81 showing smooth channel floors dividing around the end of an "island". The profile shows a stronger echo on the channel floors. The “islands” are rough in places and
smooth in others.
Channel overbank area
The line starts south of the channel, where the seafloor is very similar to that seen on the nearby line MAKAT 80. The seafloor is near horizontal with a prominent reflector at about 6 m depth and, below that, well stratified reflectors, seen down to about 25 m below sea floor. These reflectors have some discontinuities and tend to fill in the slight depressions, both characteristics of turbidite sedimentation.
Channel mouth
The section of the line that runs along the channel mouth shows it to have a com-plex of highs and lows with a relief of about 10-20 m. The highs tend to be elongate and lozenge shaped, typical of fluvial braid bars (Fig. 6). However they are clearly not equiv-alent to fluvial bars in being erosional, as dis-cussed below, rather than depositional. The channels run between these "islands" with a low sinuosity of about 1.2. Channel floors tend to be smoothed off, and flat or slightly tilted. Of the four "braided" channels that were crossed the sidescan backscatter level is uniform and fairly low. There are no bed-forms apart from a field of regular giant scours (Fig. 7), similar to those seen on the Valencia Channel mouth/pathway west of the Rhone Fan (Morris et al., 1998). The pro-filer shows a strong surface echo from the channel floors and little penetration other than a surficial layer of about 2 m, whose base is an erosional unconformity.
The "islands" are characterised by strong surface erosion that in places has planed off both the underlying layer of acoustically structureless sediment and the overlying well-stratified sequence. The latter can be 30 m or more thick. The structureless sediment has a rough surface that has in places been filled by the well-stratified sequence. From the acoustic properties, geometry and the single core sample (Core AT 438V), it is believed to be a muddy debris flow. The style of erosion of this possible debris flow includes:
1. Regular longitudinal furrows (Figs. 6 and 8) that are up to about 2 m deep and up to 2 km long. Similar features in both muds
and sands have been described by, for instance, Flood (1981) and Belderson et al. (1988).
2. As well as the originally deposited hummocky surface there are subsequently eroded hummocky depressions with some longitudinal and some transverse elements (Fig. 9). The erosional depressions can be up to 10 m deep. Some small dark specks, main-ly positive features, because they cast shad-ows, could be exhumed or ice-rafted blocks or boulders.
A group of six "blocks" that are larger than any of the others, all elongate, oriented on the sea floor in different directions, up to 35 m long and about 5 m high, could be wreckage or ice-rafted blocks.
Channel mouth sand lobe
Beyond the channel mouth there is a flat seafloor, shown on GLORIA sidescan sonar to have patches of both very high and very low backscatter (Dowdeswell et al., 1996) (Fig. 10). It is hypothesised here, for the first time, that the very low backscatter could be due to the presence of sheets of sand. Sand sheets would be expected beyond a channel, where the flow expands onto the proximal part of a basin plain (Komar, 1971; Kenyon and Millington, 1995). This is supported by observations that sheets of fine to medium sand are often imaged by sidescan sonar as low backscatter e.g. Gardner et al. (1991). The profiler has a penetration of about 15 m and shows fairly well stratified, horizontal reflec-tors. Some reflectors stop abruptly when traced laterally and some show an unusual regular waveform with an apparent wave-length of about 50 m and an amplitude of about 1 m. The sidescan sonar shows a vari-ety of medium backscatter patterns scattered fairly randomly throughout:
Figure 9. Fragment of the line MAKAT 81 showing hummocky erosional topography, up to 10 m deep, in the supposed slide deposits.
69 30 0 N
69 0 0 N
5 0 0 E 6 0 0 E 7 0 0 E 8 0 0 E 9 0 0 E
Lofoten
Basinchannel
Depositional sand-rich lobe
Edge ofTraenadjupet lides
AT437V
AT438K
AT441K AT440V
AT442K
MAKA T -80
MAKA
T
-79
MAKA
T -81
TVAT-40
?
Buried debris flow
6
B
A
KM
Depositional sand-rich lobe
Edge ofTraenadjupet lides
Lofoten
Basinchannel
Partly buried debris flow
Interpretation
setting are thought to be sand volcanoes. Some of these patches have transverse align-ments and because of their association with the waveforms seen on the profile they are presumed to be parallel to the crests of sedi-ment waves.
2. Groups of narrow elongate streaks of medium backscatter. They are aligned in the expected flow direction of turbidity currents and are thus believed to be longitudinal bed-forms of some kind, with a separation of 8-20 m. They may correspond to streaks seen on the GLORIA mosaic (Fig. 10B).
Conclusions
The Lofoten Basin Channel is relatively shallow, typically 10 m depth, and is eroded into the deep axis of the basin that runs gen-tly down towards the Lofoten Basin Plain. There are either no levees or low levees where it crosses the basin floor, though a possible levee is seen on a seismic profile (Laberg et al., 2003) from near the canyon
base. Just before it reaches the basin plain the channel turns to the northwest and cuts through what seems to be slide debris. The possible slide debris is old, as it is covered by up to 30 m of well stratified sediment, and probably originates from the Bear Island Fan Slide which has a headwall scar about 450 km to the north. The slide debris and its cover have been eroded by turbidity currents into elongate "islands" and channels. The channels are probably floored by sand, as this is consistent with the low backscatter values and the acoustic character of the pro-file, though no samples were obtained. There are few bedforms on the channel floors apart from erosional scours, resembling giant flute marks, and some sediment waves. However the high energy of the currents flowing through the channels is shown by the deep erosion of the "islands".
The flat floor beyond the channel mouth is dominantly depositional as it has parallel bedding and some sediment waves. There Figure 11. Perspective view based on 100 kHz sonograph from the line MAKAT-81 and reconstruction of the bathymetry of features believed to be sand volcanoes. Their origin is thought to be due to dewatering following
are probably extensive and thick sands. This is supported by the very low, and unique for this area, GLORIA backscatter pattern, which is seen as far as the coverage extends (up to 120 km from the channel mouth). It is also supported by the possible sand volca-noes and the one core sample (Core AT-440V), which had 86 cm of fining upward well sorted, quartz rich sand. The failure of the gravity corer on this cruise at a number of sites and on the Cruise of the RRS James Clark Ross (Dowdeswell et al., 2000) also points to fine, well sorted sand being widespread near the seafloor.
11..22..33.. BBoottttoomm ssaammpplliinngg
A. MAZZINI, E. KOZLOVA, E. SARANTSEV, O.
BARVALINA, A. BELAN, E. BILEVA, V. BLINOVA, R.
KHAMIDULLIN, D. KOROST, A. OVSJANNIKOV, E.
POLUDETKINA, T. PTASHNAYA, H. RASMUSSEN AND
Z. TSILIKISHVILI
The aim of the sediment sampling pro-gramme was to ground truth sidescan sonar interpretations of an extensive GLORIA sur-vey, combined with a more detailed TOBI survey, carried out at the mouth of the Lofoten Basin Channel, and the three sides-can sonar lines (MAKAT 79, 80 and 81) recorded during this survey. The area com-prises the Lofoten Basin Channel mouth sand lobe, a braided part of the channel, the extensive area separating the flank of the channel and the northern part of the Traenadjupet slide. Several attempts to obtain samples using the gravity corer failed, possibly due to the presence of well-sorted sand layers. A total of 5 stations were sam-pled in the area (Fig. 4) using a vibrocorer and a kasten corer, and a bottom TV line was run.
Sampling locations were chosen from sidescan sonar and subbottom profiles. The main sampling site parameters and the sedi-mentological, acoustic and geological charac-teristics are summarized in Tables 1 and 2. Detailed logs for the sediment retrieved are included in Annex I.
Core AT-437V and AT-440V
These two stations aimed to sample the channel mouth sand lobe using a vibrocorer.
Station AT-437V intended to sample a high backscatter area observed on the GLO-RIA imagery. The device retrieved about 50 cm of sediment that was heavily disturbed during the extrusion operations. The top part includes approximately 10 cm of moderately sorted and compacted fine sand, consisting of quartz, mica, feldspars, pyroxene and amphiboles with dispersed Emiliana huxleyi. The lower unit consists of brownish marl, water saturated and with some foraminifera, becoming greyer and compacted towards the bottom. Part of the sand had probably been washed out during the retrieval of the corer, therefore there may have been a thicker sandy layer than recorded.
Station AT-440V sampled a flat area with possible sand volcanoes observed on profile MAKAT-81 (Fig. 12). Due to the high water content in the sediment retrieved, the upper part of the core was disturbed during the extrusion from the liner, thus the thick-ness given for the upper units is approxi-mate. A few millimetres thick veneer of brownish hemipelagic sediment is observed above an 86 cm thick sandy unit. The fine and very well sorted sand appears water sat-urated in the upper part. The water content gradually decreases towards the bottom while the grain-size gradually increases, changing to fine-medium at 15 cm, to medi-um at 37 cm, and to coarse sand towards the bottom where the sediment is well compact-ed. The sand composition includes quartz, feldspar, sponge spicules and other organic fragments (e.g. plants fragments). The lower-most unit consists of stiff stuctureless grey clay.
Core AT-438K
unit, more water saturated in its upper part, shows some planar lamination interval visi-ble as oxidised layers. The unit below (34-69 cm) consists of greyish homogeneous clay containing stiffer intervals. Below this unit is a 60 cm thick unit of fine to coarse sand with a clayey matrix, extremely rich in
foraminifera and small (~1 mm sized) bivalves (shell debris?). The fine fraction mostly consists of quartz and feldspars, while millimetre sized rock fragments repre-sent the coarse component. The coarse sand embeds structureless and more consolidated clayey clasts (up to 7 cm in size). Some irreg-Table 1. Sampling sites in Area 3 (Traenadjupet Slide and Lofoten Basin Channel Mouth Sand Lobe).
ular sandy intervals were also observed and towards the bottom the unit appears to be more clayey. At 80 cm a continuous layer of coarse sand containing drop-stones (up to 1 cm in size) of different roundness and lithol-ogy was observed above a layer of indurated dark brown clay. The lowermost unit (132-157 cm) consists of homogeneous grey clay.
Site AT-439Gr
No sampling was attempted at this site on the braided part of the channel. The TV grab camera shows flat sea floor and diffuse biological activity on the sea floor sediment.
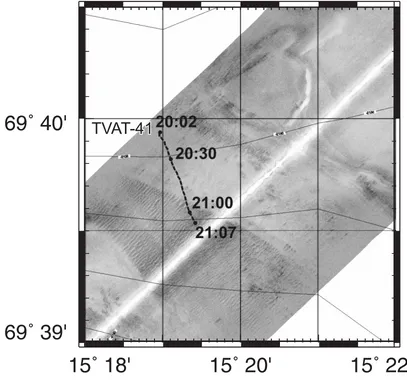
TVAT-40
The TV line TVAT-40 was run along the Lofoten Basin Channel floor, across the fur-rowed transparent unit and the possible exo-posed turbidite beds in the channel wall, seen on line MAKAT-81 (Fig. 13). The video record shows mainly hard seafloor covered by a thin layer of soft bioturbated sediment. The TV line initially planned could not be followed due to strong bottom currents (mostly flowing to the north or east) that
pushed the TV frame north of the ship's track. The sessile fauna observed is not abun-dant and mostly represented by sea anemones. Several elongated outcrops were also observed (Fig. 14).
Core AT-441K
The kasten corer targeted an area just north of the main channel. 43 cm of biotur-bated sediment were recovered. Most of the sediment consists of brownish bioturbated marl interrupted at 15 and 23 cm by a few centimetres thick bioturbated sandy layers. At 37 cm a layer extremely rich in foraminifera and shell fragments is observed.
Core AT-442K
Figure 13. Fragment of the line ÌÀÊÀÒ-81 and track of the TV line TVAT-40.
Figure 14. Video stills from the line TVAT-40. a and b, bioturbated seabed, note burrowing features in figure a and sea anemones in figure b (arrowed); c and d, elongated rock outcrops (arrowed) covered by veneer of
Discussion
It is difficult to draw definite conclu-sions from the limited amount of successful coring stations. Combined samples and sidescan sonar record allowed a preliminary interpretation of the area.
The topography, setting and the fea-tures observed on the sidescan sonar record on the channel mouth lobe suggest that this is an area of significant sand deposition. This is supported by the sandy units observed in the top part of the cores 437V and AT-440V retrieved from this area. The moderate-ly to very well sorted sands and the fining upwards grain size of the sand, confirm the presence of a turbidity current that deposited at the mouth of the channel. The sharp
boundary between the coarse sand and the stiff clay (AT-440V) may indicate an erosion-al contact.
Further south, where TOBI sidescan sonar records show braided features, line MAKAT-81 reveals elongated striped fea-tures that indicate strong current activity and erosion. The only sample in this area (AT-438K) retrieved recent hemipelagic sediment covering a clayey-sandy unit. The presence of drop stones within the sandy unit suggests a glacigenic origin for this deposit (ice-rafted ?) while the clayey clasts suggest a debris flow transport mechanism for the whole unit. It is possible that glacigenic sediment deposited further north on the upper part of the slope was later transported downslope within a debris flow event. The subbottom profiler record also supports this hypothesis. A transparent reflector, interpreted as the top part of the debris flow, has an uneven profile when covered by layered sediments.
The sandy layers seen in core AT-441K, from outside the main channel, are interpret-ed as overbanking from the main channel or possibly due to turbidity currents related to the slides observed further to the south.
11..33.. A
Annd
døøyyaa SSlliid
dee,, A
Annd
døøyyaa C
Caannyyoonn aannd
d
tthhee u
up
pp
peerr L
Looffootteenn B
Baassiinn C
Chhaannnneell
((A
Arreeaa 44))
11..33..11.. IInnttrroodduuccttiioonn
J.S. LABERG
In Area 4 the aim was to study the Andøya Slide, the Andøya Canyon and its deep-sea continuation, the Lofoten Basin Channel. The focus was on the sedimentary processes and age of the events.
The Andøya Slide is located at about 60° 30' - 70° 15' N and 12° - 17° E (Fig. 16). The headwall is inferred to be located at the pre-sent day shelf break (Kenyon, 1987). Slide deposits have been identified up to 200 km into the basin, the most distal part being three elongated lobes identified on GLORIA long-range sidescan sonar data (Dowdeswell et al., 1996; Laberg et al., 2000; Taylor et al., 2002). In total the slide affected area is esti-Figure 15. Fragment of line MAKAT-79 showing
mated at about 9700 km2(Vorren et al., 1998). The age of the slide is inferred to be Holocene on the basis of the thin drape of pelagic ooze. On the continental slope immediately south of the slide is the Andøya Canyon. The upper part of the canyon is characterised by a V-shaped cross-section and the maximum width between its shoulders is about 8 km, the incision is up to 1000 m. Further downs-lope the canyon has a U-shaped form, is up to 25 km wide and 900 m deep.
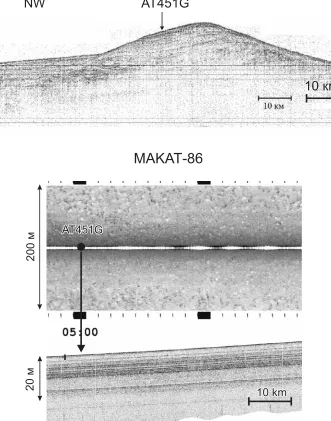
At the base of the slope the Andøya Canyon continues as the Lofoten Basin Channel. In its uppermost part the channel has a thick unit of acoustically laminated sediments on its northern flank, inferred to represent levee deposits. Slightly further into the basin the channel turns about 90° (from NNW to WSW) and in this area levee devel-opment is very limited.
11..33..22.. IInntteerrpprreettaattiioonn ooff ssiiddeessccaann ssoonnaarr aanndd p
prrooffiilleess
N.H. KENYON, J.S. LABERG, K. VANLANDEGHEM
ANDM. GUTJAHR
MAKAT 82 and 83: Lower Andøya Slide The line MAKAT 82 ran due north along 13°E, starting south of the Lofoten Basin Channel and crossing the channel and the three long supposed debris flow tongues (Fig. 24), mapped by GLORIA as high backscattering features. The sidescan was run at 30 kHz.
crossed that appears to have been uplifted by tectonics or diapirism.
Immediately south of the channel a transparent debris flow lobe, up to 12 m thick, is seen on the profile (Fig. 24) but not on the sidescan sonar record. Because a thin surface layer, though less than 1 m thick, is seen to cover it, the lobe is probably older than those to the north, which accounts for it not being identified from the GLORIA sur-vey.
The Lofoten Basin Channel is crossed where it is about 10 m deep. A transparent debris flow covers most of the channel floor, as well as part of the overbank. A few small blocks and some wave forms are seen on the channel floor but the waves may be within the debris flow rather than being traction current waves associated with channel pro-cesses.
The three main debris flow tongues are
similar to each other. The southern one is up to 20 m thick. Blocks are all smaller than 50 m across and less than 3 m upstanding above the surface. Well developed longitudinal structures, presumably shears, are well seen near the northern edge of the southern flow. The middle flow has split into two tongues and both tongues fill and overflow erosional deeps. The deeps are up to 12 m deep and may be due to erosion by the flow process itself rather than being pre-existing deeps. The maximum flow thickness is about 20 m. The blocks are similar in size to those of the other flows.
The northern flow has a maximum thickness of only 10 m. No basal erosion is apparent, unlike in the other two flow tongues.
The areas between the flows are similar to each other. Reflectors are closely spaced and not very parallel, but have a tendency to
asymmetric wave forms with a very low amplitude (Fig. 24, N end). The most promi-nent erosional horizon is at the near surface where isolated scours of 1-3 m depth are seen. The sidescan shows many isolated arcuate features, which have a tendency to be concave in the downslope direction. These near surface scours are not seen below the flow deposits, implying that they occur later, though this may be immediately after the flow emplacement.
The 100 kHz line MAKAT 83 was chosen to look at features on the western side of the MAKAT 82 sidescan record in greater detail. It crosses the northern side of the southern flow and the middle flow. The depth sensor failed and so the profile was less accurate than usual.
Both longitudinal shears and transverse wave like features are seen (Fig. 18). Blocks are distributed as if frozen in a swirling motion, with little overall orientation (Fig. 19).
The arcuate deeps seen in areas between flows are up to 1500 m long and 250 m wide (Fig. 20). Ridges and grooves in the floor of the deeps are common. They are oriented at right angles to the long axis of the deeps and may indicate the direction of failure. Part of the surface layer has been removed either by current scouring or by slab sliding (or per-haps by a combination of both). The arcuate shape and isolated nature seems more in keeping with current scouring, though some slab like pieces seem to have been left behind. It is noted that the scours seen in the bottom of the Lofoten Basin Channel Mouth also have longitudinal grooves and ridges in their floors. These are on a flat floor, swept by currents and thus currents would be the likely cause of the scouring seen in this area also.
MAKAT 84: traverse up Andøya Slide The 30 kHz line runs up the slope from depths of 2800 m to 2050 m. The slope steep-ens as it goes up. The deepest part shows the near surface pattern found between debris flow tongues on MAKAT-82 and 83. There appears to be little evidence of erosional fea-tures at or near the sea floor but there is a
pattern of low amplitude, asymmetrical waves on the profiler, similar to deep sea mud waves (Fig. 21). The asymmetry is con-sistent with currents, active over a very long period of time, that were flowing either downslope or along the contours to the south.
The debris flows are first crossed at 1745 GMT and are continuous to the end of the line. The style on the sidescan record varies, with a tendency for blocks to comprise more of the flow and to get larger upslope. Longitudinal (southwestwards trending) fea-tures predominate. A sinuous deep, with a smoother, block free fill, crosses the track at one point, rather like a fast flowing lava channel on a volcano flank (Fig. 22). Between 0010 and 0210 there seems to be a pattern of asymmetrical mud waves, buried beneath the debris flow. Upslope from about 1300 GMT there is a parallel bedded, easily pene-trated sequence beneath the debris flow.
MAKAT 85: upper Andøya Slide and Andøya Canyon
The 30 kHz sidescan and profiler runs across the southern margin of the slide and crosses the lower Lofoten Canyon. There are two upstanding large blocks within the slide deposits that have not disintegrated. They are up to 50 m above the surroundings and up to 1.5 km across. It is not clear whether they are in place or have moved. The north-ern one seems to have been tilted at some time as bedding is poorly seen, whereas the southern one has the thick sequence of paral-lel bedding that is found in place nearby. Beyond the blocky slide deposits there are two smooth surfaced debris flow lenses. One extends about 3 km beyond and overlies another that extends about 7 km beyond, almost to the edge of the Andøya Canyon. Between the two flow deposits there is a 2 m thick parallel layer that has clearly been eroded by the later flow.
Figure 18. Fragment of MAKAT-83 sonograph showing longitudinal shears and transverse waves within slide.
Figure 19. Fragment of MAKAT-83 sonograph showing a swirling pattern of blocks frozen within a debris flow.
waves, wavelength 25 m (Fig. 23). These are believed to be coarse grained, gravel or peb-ble, waves because of their backscatter char-acteristics, their wavelength and from the common occurrence of such waves in the lower reaches of canyons. The north side of the canyon floor has a low backscattering strip of sediment. This could be a covering of sand over the sediment waves, which show through in places on the sidescan sonar record. The 50 m or more of parallel bedded sediments, attributed to levee deposition (Laberg et al., 2000), are very widespread, extending at least 15 km beneath the slide.
South of the Canyon there is a complex of valleys and ridges. It is difficult to map the shapes of the relief. The sedimentary sequence on seismic (Figs. 23 and 24) is:
1. At base - a near parallel bedded unit, up to 40 m or more thick and faulted in part.
2. An erosion surface.
3. Lenses of transparent facies, up to 25 m thick and presumably debris flows. Found especially in deeps.
4. At top - a prominent reflector beneath an up to 6 m thick sequence with at least one internal reflector.
S N
2650m
2700m
21:00
20:30
1 km
Figure 21. Part of profile MAKAT-82 showing asymmetric sediment waves, presumably due to currents active over a long period.
11..33..33.. BBoottttoomm ssaammpplliinngg
A. MAZZINI, E. KOZLOVA, E. SARANTSEV, O.
BARVALINA, A. BELAN, E. BILEVA, V. BLINOVA, R.
KHAMIDULLIN, D. KOROST, A. OVSJANNIKOV, E.
POLUDETKINA, T. PTASHNAYA, H. RASMUSSEN AND
Z. TSILIKISHVILI
Four sampling stations were occupied near the bottom of the Andøya Slide. Stations were selected on the basis of line MAKAT-82 that was run across the three long, narrow terminal lobes that were originally observed on the GLORIA sidescan sonar mosaic. The three main lobes sampled will be described as northern, central and southern according to their geographical setting. In all three cases the lobes were sampled at their edge where the subbottom profiler shows the slide deposit thinning, and overlying the layered sediments that characterise most of the area. The aim was to sample the superficial hemipelagic sediment, penetrate through the transparent unit, interpreted as debris flow deposits, and reach the layered underlying unit as observed on the subbottom profiler (Fig. 24).
The southern flank of the Andøya slide was investigated with three sidescan sonar lines (MAKAT-84 and MAKAT-85) and three sampling stations were selected from line MAKAT-85 that was run from NE to SW, across the edge of the slide and across the Andøya Canyon.
The main sampling site parameters and the sedimentological, acoustic and geological characteristics are summarized in the Tables 3 and 4. Summarized core logs for the sedi-ment retrieved are included in Annex I.
The terminal part of the Andøya Slide
C o r e A T - 4 4 3 G a n d A T - 4 4 4 V Two attempts were made at sampling the northernmost lobe. The first attempt, using the gravity corer, retrieved a small amount of material from the core catcher. The sediment consists of well sorted fine sand presumably capped by the brownish hemipelagic sediment that was also recov-ered from the core catcher.
The second station (AT-444V), done using the vibrocorer, retrieved 139 cm of sed-iment. Some disturbed portions of hemipelagic sediment were retrieved overly-ing an 11 cm thick unit of sand with silty admixture. Alternations of thin clayey silt, silty clay and clay (as grey or dark grey lay-ers) occur throughout the core particularly between 34-41, 63-64, 73-74, 77-78, 82 cm. Thin sandy layers with silty and clayey admixture are observed between 24-31, 106-108, 117-119, 127-129 cm. Bioturbated and irregular dark grey layers occur at several depths.
C o r e A T - 4 4 5 G
Station AT-445G was the only attempt to sample the central lobe of the Andøya Slide. A small portion of hemipelagic marl and fine sand, similar to the sample retrieved at sta-tion AT-443G, is found in the core catcher.
C o r e A T - 4 4 6 V
This station aimed to sample the south-ernmost lobe observed on the sidescan sonar image. 75 cm of structureless clay with a sig-nificant amount of silty and sandy admixture
Station N Date Time (GMT) Latitude Longitude Depth, m Recovery, cm TTR13-AT-443G 25.07.2003 6:12 70°06.460N 13°00.093E 2741 10
TTR13-AT-444V 25.07.2003 7:09 70°06.454N 13°00.111E 2742 139
TTR13-AT-445G 25.07.2003 11:50 69°50.955N 12°59.845E 2769 10 TTR13-AT-446V 25.07.2003 15:18 69°43.474N 12°59.856E 2781 75 TTR13-AT-447G 28.07.2003 12:45 69°35.310N 15°06.777E 2114 554 TTR13-AT-448G 28.07.2003 15:00 69°39.337N 15°19.012E 2205 10
TTR13-AT-449G 28.07.2003 17:07 69°42.186N 15°27.824E 2086 478
was retrieved. The fine sand consists of quartz, mica, glauconite, amphiboles, pyrox-ene. Millimetre sized rock fragments are dis-persed throughout the section. Glacigenic pebbles (drop stones?) of different size (up to 7 cm), lithology (quartzite, schist, granite and others) and roundness are observed. The largest clasts appear to have one or two flat surfaces indicating the transport of pebbles at the base of a glacier.
The southern flank of the Andøya Slide
C o r e A T - 4 4 7 G
silty clay is characterised by sponge spicules, diatoms and a moderate amount of foraminifera and shell fragments. Patches and subparallel greenish grey layers (mostly between 80-100 and 140-240 cm) of more water-saturated clay, richer in forams, are irregularly distributed. These greenish layers show transitional boundaries and are some-times discontinuous. Between 290-509 a sim-ilar unit of slightly darker silty clay is charac-terised by patches and thin (few millimetres) subparallel layers of dark grey clay, rich in diatoms and interpreted as the decay of organic content in anoxic conditions. These layers are mostly concentrated between 290-300, 330-360, 390-500 cm. Fine sand mottles and lenses are found at 317 and 350 cm. Coarse sand mottling was seen at 457 cm, and at 480 cm an 8 cm thick layer of sand
shows fining upwards of the grain-size, from coarse to fine. From 510 until the bottom a clayey silt unit shows a significant amount of millimetre sized rock fragments and drop stones up to 5 cm in size.
C o r e A T - 4 4 8 G
The aim of this station was to sample the deepest part of the Andøya Channel. The sidescan sonar image (Fig. 23) shows medi-um backscatter values with sediment waves, and the profiler shows a strong reflector with no layered structure below. Only a small amount of sediment was retrieved from this station. The core catcher contains disturbed brown marl capping gray clay with silty and some sandy admixture. Between the teeth of the core catcher and within the clayey sedi-ment mostly sub angular pebbles of different Figure 23. Fragment of the line MAKAT-85 showing trains of high backscattering waves along the Andøya
T
ec
hni
ca
l S
er
ie
s
N
o.
68
34
2m
0
5ì
5ì
TTR13-AT445G
N
2m
0
5ì
TTR13-AT444V TTR13-AT443G
0
50
TTR13-AT446V
S
50
m
Southern lobe
Central lobe
Northern lobe
0
50
100
2m
0