CFD Analysis into the Drag Estimation
of Smooth and Roughened Surface Due to
Marine Biofouling
Muh. Sawal Baital
1and I Ketut Aria Pria Utama
1Abstract This study is to investigate drag on ship due to marine biofouling using CFD approach. A cargo ship with one year operation was used for the study and to examine the effect of biofouling between smooth and roughened hull by observing the result of CFD simulation. Simulation is done using CFD software based RANSE code together with SST based k-omega as turbulence setting and Grid Generator was used to build the hybrid grids. The result indicated that marine biofouling make significant increase for ship resistance up to 37 %. This fact is in good agreement with experimental test has been examined that fouling increases drag up to 80 % for two years.
KeywordsHull Roughness, fouling, Fluid Dynamics, simulation, drag, power.
AbstrakPenelitian ini untuk meneliti gaya hambat kapal yang diakibatkan oleh marine biofouling menggunakan pendekatan CFD. Kapal Cargo dengan satu tahun pelayaran digunakan untuk studi dan menguji efek biofouling antara lambung dengan permukaan halus dengan permukaan yang dikasarkan dengan mengamati hasil dari simulasi CFD. Simulasi dikerjakan dengan menggunakan software CFD berbasis RANSE dengan SST berbasis k-omega sebagai seting turbulen dan Grid Generator digunakan untuk membentuk hybrid grid. Hasil simulasi mengindikasikan bahwa marine biofouling meningkatkan gaya hambat yang bekerja pada kapal hingga 37 %. Fakta ini sesuai dengan pengujian eksperimen yang menyatakan bahwa fouling meningkatkan gaya hambat hingga 80 % dalam dua tahun.
Kata Kunci Hull Roughness, fouling, Fluid Dynamics, simulation, drag, power.
I.INTRODUCTION1
iofouling is the accumulation of microorganisms, plants, algae, or animals on wetted structures and become the one of the most important problems currently facing in marine technology. The growth of marine biofouling is natural phenomena that cannot be avoided, because biofouling is biological roughness that is impossible to detain and it grows massively. Biofouling is not as simple a process as it sounds. Organisms do not usually simply absorb into a substrate. The complex process often begins with the production of a biofilm [1]. Formation of this film is immediately followed by an accumulation of microorganisms (e.g. bacteria, fungi, diatoms, and other micro-organisms) and the secretion at their cell surface of extra cellular polymeric substances (EPS) during attachment, colonization, and population growth [2].
Marine biofouling begins to occur immediately after a ship immersed in water, and will continue to occur throughout a ship’s life at sea until a cleaning process is performed. The level of biofouling depends on several factor, including the length of time spent at sea, the water temperature, the geographical location of the ship, surface condition and the salinity of the sea [3].
Marine biofouling is one of the major unsolved problems currently affecting the shipping industries [4]. Marine biofouling commonly refers to the adverse growth of marine organisms on immersed artificial structures such as ship hulls [5]. Biofouling creates roughness over ship hull surface may affect the flow properties and causes a reduction of velocity profile in turbulent boundary layer
1Muh. Sawal Baital and I Ketut Aria Pria Utama are with Department of Naval Architecture and Shipbuilding Engineering, Institut Teknologi
which increases the shear stress and frictional resistance, thus affecting its hydrodynamics, speed and maneuverability [6]. The frictional resistance of a ship has a significant importance to ship speed, power requirement, fuel consumption and the economic penalty due to the increase of fuel consumption [7]. Frictional resistance can account for up to 80-85% of a ship’s total resistance [8], a means of reducing the frictional resistance of ship would significantly reduce fuel consumption.
Analysis of the effect of marine biofouling to ship resistance is carried out by using computational fluid dynamics (CFD) simulation with Reynold-average Navier-Stokes (RANS) solvers for incompressible flow developed by CFD code have included free surfacearound the hull with Shear Stress Transport (SST) based k-omega turbulence model is used to carry out the simulation.
CFD is an effective tool to analyze the flow within turbulent boundary layer and it has become very popular to assess resistance and power performance of marine vehicles [9]. Since experiment test cannot visualize the fluid flow phenomena that happened during test, CFD can give accurate prediction to support the major test [10, 11].
II.METHOD
A. Model Data
The simulation were conducted on 1 : 25 scale model of the Cargo Ship hull with full scale dimensions as shown in Table 1.
Sepuluh Nopember, Surabaya, 60111, Indonesia. E-mail: [email protected]; [email protected].
CFD simulation is used to analyze the drag difference between smooth hull surface, regular hull roughness with 0.72 mm of the biofouling height, and irregular roughness where there is a height difference on certain part, 0.60 mm
on bow, 0.72 mm on amidship and 0.92 mm on stern as shown in Figure 1.
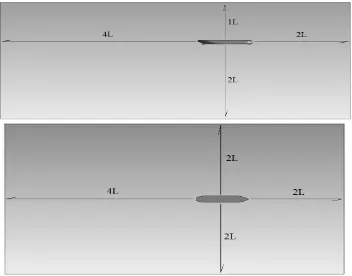
The computational domain of the cargo ship model which is extended to 2L forward, 4L backward, 2L aside, 1L upward above the main deck of the cargo ship model, and 2L downward under the keel of the cargo ship model. Figure 2 shows the computational domain used in the simulation.
B. Mathematical Model
In order to analysis the motion of a fluid element, we need to derive the equation of fluid motion. And the governing equations of fluid motion represent
mathematical formulation of the basic laws of physics. These laws contain continuity equation (Equation 1), momentum conservation law (Equation 2) and energy conservation. For marine CFD problems, energy conservation equation is not used.
𝜕𝜌
𝜕𝑡 + ∇(𝜌𝑈⃑⃑ ) = 0 (1)
TABLE 1.
PARTICULAR DIMENSIONS
Length over all Breadth Height Draught Wetted Surface Displacement
109 m 17.8 m 10 m 7 m 2647 m2 9603 tom
Figure 1. 3D model (a) smooth surface; (b) regular roughness; (c) irregular roughness
Where 𝜌is fluid density; U = (u, v, w) which is the fluid
Where p is the surface pressure; 𝜏𝑛𝑚is viscous stresses and 𝐹= (𝐹𝑥 , 𝐹𝑦 , 𝐹𝑧) is the body force (mass force).
Turbulence model using SST based k- it accounts for the transport of the turbulent shear stress and gives highly accurate predictions of the onset and the amount of flow separation [12]. The SST based k-omega turbulent model was used in CFD code formulated by
𝜕(𝜌𝑘) respectively represent the effective diffusivity for k and ω, generation of turbulence kinetic energy and ω due to mean velocity gradients, and dissipation of k and ω due to turbulence respectively. Meanwhile Dω represents the cross-diffusion term.
C. Meshing
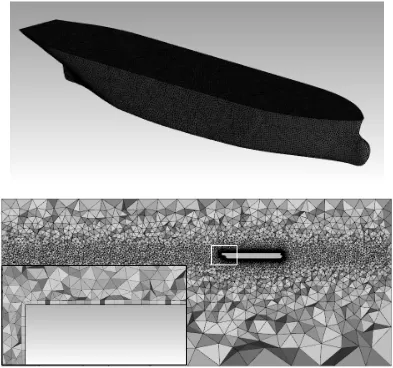
Unstructured tetrahedral mesh with inflation layer (hybrid mesh) was built using Grid Generator around the model scale cargo ship geometry. Unstructured tetrahedral was built in the region around the model and smaller element size was used for the cargo ship model. The small size of element used on the cargo ship hull and near the free surface with additional refinement is designate to obtain a better result and to capture the flow properties. The inflation layer of the ship surface was built around the model with total of three layers to be
maintained for each case y+ < 100. A convergence test was carried out in order to obtain grid independent solutions due to cell number are influential on the solution. It is of note that once the mesh independent solution is achieved, further refinement of the mesh does not affect the final solution, though it does affect the solution time [13]. Figure 3 depicts grid of the unstructured tetrahedral and inflation layer of the model.
(2)
D. Numerical model
Total resistance data for the Cargo Ship are used for validating the CFD simulations were obtained through towing tank test (50 m x 3 m x 2 m) on 1 : 53.03 scale model [14]. The model was fixed in heave and pitch at the full scale static draught with zero trim.
Table 2 show the numerical simulation properties for flow analysis of hull form design of cargo ship. The flow analysis is presented using CFD code based RANSE fitted with shear stress transport (SST) based k-omega for turbulence setting was used to carry out the simulation and using Grid Generator to build hybrid grids for RANSE solver. Simulation has been convergence with residual target 10-5 was used to check. This simulation using steady state with total elements about 2 million elements to satisfy grid independences criterion. This study emphasized the roughness of biofouling in the ship hull percentage of roughness resistance is determined.
III.RESULTS AND DISCUSSION
A. Grid Independence
The studies were performed using the Cargo Ship model with smooth surface in order to obtain grid independent solution for validation. The near-wall grid and total number of grid study was carried out to determine the effect of grid number on the calculated total resistance.
To generate the mesh, the total of element from domain
was gradually changed, whilst keeping other parameters such us grow rate, inflation layer and models number of element the same. The results from different simulations are shown in Table 3.
As shown in Table 3, the solution converged well, with little variation in the total force. On the other hand, the difference in the total force between Grid 3 and Grid 4 are 1 % or not greater than 2 % [15]. Therefore, the resolution with the total number of elements on Grid 3 was chosen and used throughout all cases of the full scale prediction study.
TABLE 2.
NUMERICAL SIMULATION PROPERTIES
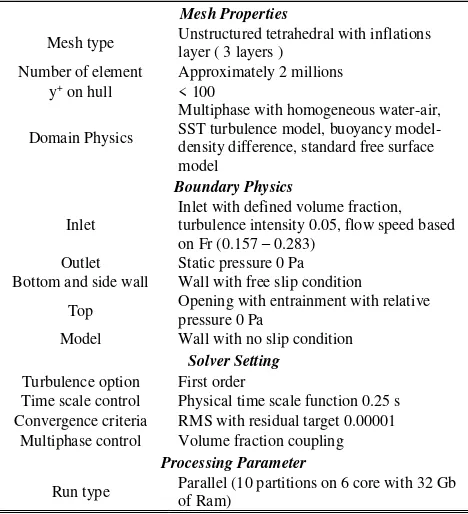
Mesh Properties
Mesh type Unstructured tetrahedral with inflations layer ( 3 layers )
Number of element Approximately 2 millions y+ on hull < 100
Domain Physics
Multiphase with homogeneous water-air, SST turbulence model, buoyancy model-density difference, standard free surface model
Boundary Physics
Inlet
Inlet with defined volume fraction, turbulence intensity 0.05, flow speed based on Fr (0.157 – 0.283)
Outlet Static pressure 0 Pa Bottom and side wall Wall with free slip condition
Top Opening with entrainment with relative pressure 0 Pa
Model Wall with no slip condition Solver Setting
Turbulence option First order
Time scale control Physical time scale function 0.25 s Convergence criteria RMS with residual target 0.00001
Multiphase control Volume fraction coupling Processing Parameter
B. CFD Result
Numerical flow analysis of the model scale cargo ship was performed and computational data was acquired
using RANSE code. All models were run at Fr 0.157 – 0.283 which equals to 10 – 18 knot full scale ship.
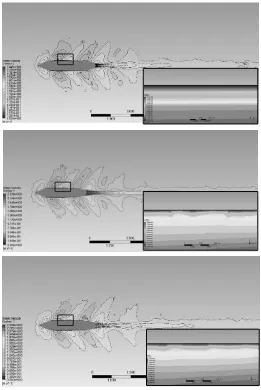
Numerical wave pattern contour around the hull and velocity contour are presented in Figure 4 and Figure 5. Figure 4 is wave pattern that show the generated waves by sailing ship. The simulation result is obviously with nice diffusion waves on both side of the ship model. It is mean that the grid/mesh and physical setting is suitable. Figure 5 is velocity contour around the hull. The boxed region of ship model on smooth surface, regular and irregular roughness are details of flow properties that through around hull. The boxed region on Figure 5.a show smoothly fluid flow without disturbed. The boxed region
on Figure 5.b and Figure 5.c show unsmooth flow properties due to biofouling. Biofouling to be obstacles that disturb fluid flow around hull thus lead fluid flow and
cannot be through smoothly.
Figure 4. Wave pattern of model ship (Fr = 0.283) (a) smooth surface; (b) regular roughness; (c) irregular roughness
Figure 5. Smooth Surface Velocity Contour (Fr = 0.283) (a) smooth surface; (b) regular roughness; (c) irregular roughness
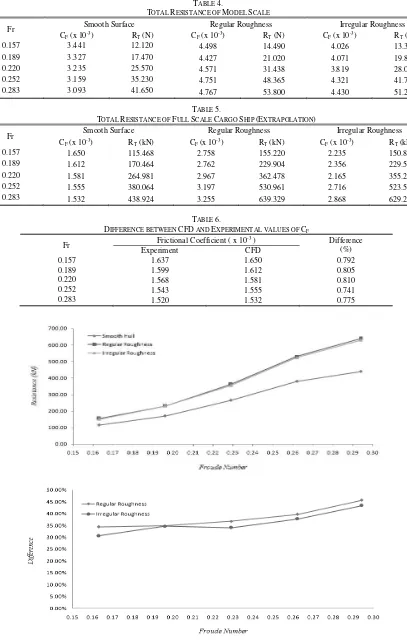
In CFD simulation, the value of total resistance can be read directly whilst friction resistance can be calculated by using ITTC equations [16]. Table 4 show the value of total resistance and frictional resistance coefisient based on CFD simulation result and Table 5 show extrapolation result from model scale to full scale.
Figure 6(a) show the total drag according to CFD result. The total resistance between smooth and roughened hull have a significant difference is up to 37 % at cruising speed. Both of regular and irregular roughened has similar percentage. Figure 6(b) shows the different percentage of regular and irregular roughened. Regular roughened has
TABLE 4.
TOTAL RESISTANCE OF MODEL SCALE
Fr Smooth Surface Regular Roughness Irregular Roughness
CF (x 10-3) RT (N) CF (x 10-3) RT (N) CF (x 10-3) RT (N)
0.157 3.441 12.120 4.498 14.490 4.026 13.390
0.189 3.327 17.470 4.427 21.020 4.071 19.810
0.220 3.235 25.570 4.571 31.438 3.819 28.050
0.252 3.159 35.230 4.751 48.365 4.321 41.770
0.283 3.093 41.650 4.767 53.800 4.430 51.200
TABLE 5.
TOTAL RESISTANCE OF FULL SCALE CARGO SHIP (EXTRAPOLATION)
Fr Smooth Surface Regular Roughness Irregular Roughness
CF (x 10-3) RT (kN) CF (x 10-3) RT (kN) CF (x 10-3) RT (kN)
0.157 1.650 115.468 2.758 155.220 2.235 150.811
0.189 1.612 170.464 2.762 229.904 2.356 229.570
0.220 1.581 264.981 2.967 362.478 2.165 355.298
0.252 1.555 380.064 3.197 530.961 2.716 523.575
0.283 1.532 438.924 3.255 639.329 2.868 629.230
TABLE 6.
DIFFERENCE BETWEEN CFD AND EXPERIMENTAL VALUES OF CF
Fr Frictional Coefficient ( x 10
-3 ) Difference
(%)
Experiment CFD
0.157 1.637 1.650 0.792
0.189 1.599 1.612 0.805
0.220 1.568 1.581 0.810
0.252 1.543 1.555 0.741
0.283 1.520 1.532 0.775
slightly higher than irregular roughened. This difference is caused by the regular roughness which has uniform height of biofouling in entire ship hull, while on certain parts of biofouling has a thinner thickness.
C. Validation Study
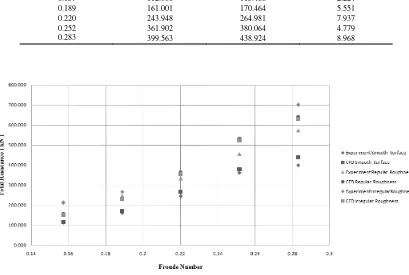
The experimental test has been used to validate the CFD simulations. The total resistance with CFD has slightly different with experimental test. Table 6 and 7 shows the differences value between the frictional resistance coefficient and total resistance that computed by CFD and obtained by the experiment for five different Froude number.
Figure 7 show the difference of total resistance value between CFD approach and experiment data on smooth surface, regular and irregular roughness. The different of total resistance lead different value of component resistance such frictional resistance. Within CFD post the total resistance acting on body can be calculated by performing an area integral of the wall shear in the x-direction. The total force evaluated both of aerodynamic and hydrodynamic drag by integrating the x-component
of the pressure and frictional over the relevant areas of the hull through using volume fraction.
IV.CONCLUSION
The effect of biofouling can be predicted using CFD by modified the roughness of hull with changing the equivalent sand grain in roughness regime.
By simulate model in CFD, we basically grasp the hydrodynamic characteristics of all three models, compare the results of them and try to figure out the
causes marine biofouling on a deeper level.
In addition, we summarize some precautions for the mesh after experiencing several failures of simulations. During the mesh setting process, we should notice that the inflation layers setting is a quite important concerns that we need to try several times to find the best setting thickness to keep the Y+ number around the underwater ship hull in the range of 30 -100. This number is actually can influence the accuracy of friction resistance coefficient.
The CFD result shows that roughness due to biofouling has significant increase for frictional resistance coefficient up to 29 % and total resistance up to 37 % at cruising speed, that mean the ship losses almost half of the power and the ship need more power to keep the ship still in cruising speed. This fact is in good agreement with experimental test has been examined that fouling increases drag up to 30% for a year and up to 80% for two years. Irregular roughened can applied in CFD simulation to get more accurate prediction and shows the actual conditions.
ACKNOWLEDGEMENTS
The authors are thankful to Kemenristek-Dikti for partially funding the study and permission of A. K. Yusim to use his experimental data obtained at Hydrodynamics Laboratory Sepuluh Nopember Institute of Technology is gratefully acknowledged.
TABLE 7.
DIFFERENCE BETWEEN CFD AND EXPERIMENTAL VALUES OF RT
Fr Frictional Coefficient ( x 10
-3 ) Difference
REFERENCES
[1] Raiklin, A. I. “Marine Biofouling Colonization Processes and Defenses”. CRC PRESS. Boca Raton London New Work Washington D.C. 2005.
[2] Gehrke, T. and Sand, W. “Interactions between microorganisms and physicochemical factors cause mic of steel pilings in harbours”. NACE International, Corrosion/2003 pp. 8. 2003. [4] Nybakken, J.W. “Marine Biology: An Ecological Approach”.
Third Edition. HarperCollins College Publishers. 1993. [5] Rolland, J.P. and DeSimone, J.M. “Synthesis and characterization
of perfluoropolyether graft terpolymers for biofouling applications”. Polymeric Materials Science and Engineering. vol. 88, pp. 606-607. 2003.
[6] Demirel, Y.K., Khorasanchi, M., Turan, O., and Incecik, A. “CFD approach to resistance prediction as a function of roughness”. Transport Research Arena, Paris. 2014.
[7] Townsin, R. L., Byrne, D., Svensen, T. E., Milne, A. “Estimating the technical and economic penalties of hull and propeller roughness”. Trans SNAME 90: 295-318. 1981.
[8] van Manen, J.D. and van Oossanen, P. Resistance. In : Lewis, E.V. (ed.). Principles of Naval Architecture. Second Revision. Volume II : Resistance, Propulsion and Vibration. Jersey City, NJ : The Society of Naval Architects and Marine Engineers. 1988. [9] Bertram, V. “Practical Ship Hydrodynamics”.
Butterworth-Heinemann. Oxford. UK. 2002.
[10] Candries, M., and Atlar, M. “On the drag and roughness characteristics of antifouling”. Transaction of the Royal Institution of Naval Architects, Vol.145, pp.107-132. 2003. [11] Molland, A.F., and Utama, I. K. A. P. “Experimental and
numerical investigation into the drag characteristics of a pair of ellipsoids in close proximity”. Proceedings of the Institution of Mechanical Engineers. Journal of Engineering for the Maritime Environment, Vol.216, Part M, pp.107-115. 2002.
[12] Ding, Y. “Scale Effect on the Wake Field of Single Screw Ship”. Master Thesis. Aalesund University College. Norway. 2015. [13] Demirel, Y. K., Khorasanchi, M., Turan, O., and Incecik, A.
“CFD Approach to Resistance Prediction as a Function of Roughness”. Transport Research Arena. Paris. 2014.
[14] Yusim, A.K. and Utama, I.K.A.P. “An Investigation into the Drag Increase on Roughen Surface due to Marine Fouling Growth”. Presented at The 2nd Internasional Seminar on Science and
Technology (ISST) for Sustainable Infrastructure Empowering Research and Technology for Sustainable Infrastructure. Surabaya. Indonesia. 2016.
[15] Anderson, J. D. “Computational Fluid Dynamics : The Basics with Applications. McGraw-Hill, Inc. New York. 1995. [16] ITTC. “Recommended Procedures and Guidelines, Testing and