Effects of Groundwater Table Position and Soil Properties
on Stability of Slope during Rainfall
Harianto Rahardjo
1; Alfrendo Satyanaga Nio
2; Eng Choon Leong
3; and Ng Yew Song
4Abstract: Rainfall, hydrological condition, and geological formation of slope are important contributing factors to slope failures. Parametric studies were carried out to study the effect of groundwater table position, rainfall intensities, and soil properties in affecting slope stability. Three different groundwater table positions corresponding to the wettest, typical, and driest periods in Singapore and four different rainfall intensities共9, 22, 36, and 80 mm/h兲were used in the numerical analyses. Typical soil properties of two main residual soils from the Bukit Timah Granite and the sedimentary Jurong Formation in Singapore were incorporated into the numerical analyses. The changes in factor of safety during rainfall were not affected significantly by the groundwater table near the ground surface due to the relatively small changes in matric suction during rainfall. A delay in response of the minimum factor of safety due to rainfall and a slower recovery rate after rainfall were observed in slopes from the sedimentary Jurong Formation as compared to those slopes from the Bukit Timah Granite. Numerical analyses of an actual residual soil slope from the Bukit Timah Granite at Marsiling Road and a residual soil slope from the sedimentary Jurong Formation at Jalan Kukoh show good agreement with the trends observed in the parametric studies.
DOI:10.1061/共ASCE兲GT.1943-5606.0000385
CE Database subject headings: Rainfall intensity; Groundwater; Water table; Residual soils; Permeability; Shear strength; Slope stability; Soil properties.
Author keywords:Rainfall intensity; Groundwater table; Residual soils; Matric suction; Permeability; Shear strength; Slope stability.
Introduction
Many slope failures around the world, particularly in regions with residual soils, occurred due to changes in unsaturated soil condi-tion as a result of frequent heavy rainfalls. Matric succondi-tion or nega-tive pore-water pressure plays an important role in the stability of these slopes共Fredlund and Rahardjo 1993兲. A deep groundwater table and a significant thickness of unsaturated zone above the groundwater table are general characteristics of steep residual soil slopes. In tropical and subtropical areas, rainfall-induced slope failures are closely related to the properties of the soil, the geom-etry of the slope, the position of groundwater table, and certain environmental factors共vegetation and weathering effects兲.
Previous research works have shown that rainfall is the main contributing factor of slope failures in Singapore 共Brand 1984;
Tan et al. 1987; Chatterjea 1989; Lim et al. 1996; Toll et al. 1999; Rahardjo et al. 2007a,b兲. The last heavy rainfall between Decem-ber 2006 and January 2007 caused a numDecem-ber of slope failures in Singapore. Almost all of the slope failures occurred in residual soils from the Bukit Timah Granite 共BT兲 and the sedimentary Jurong Formation共JF兲 共Rahardjo et al. 2007a兲.
Numerical analyses of rainfall-induced slope failures have been carried out to study the controlling parameters共Gasmo et al. 2000; Tsaparas et al. 2002; Rahardjo et al. 2005, 2007a,b兲 and the effects of antecedent rainfall on rainfall-induced slope failures 共Rahardjo et al. 2001, 2008兲. Cho and Lee共2002兲indicated that most shallow slope failures were caused by the advancement of a wetting front into the slope. Ng et al. 共2001兲conducted three-dimensional numerical analyses of groundwater response to rain-fall and found that rainrain-fall pattern, duration, and its return period have major influences on the changes in pore-water pressures in unsaturated cut slopes. Tohari et al.共2007兲conducted a labo-ratory study of slopes under rainfalls and observed that shallow noncircular slip was the dominant mode for rainfall-induced slope failures.
In this paper, parametric studies were performed to study the effect of position of groundwater table, rainfall intensity, and soil properties on the stability of slope. The observation was focused on the residual soils from the BT and the sedimentary JF in Sin-gapore. Numerical analyses of existing slopes were compared with the results from the parametric studies.
Slope Observation
Two-thirds of Singapore consist of two major formations, the BT and the sedimentary JF 共PWD 1976兲. BT underlies the Bukit Timah nature reserve and the central catchment area in the center 1
Professor and Head of Div., School of Civil and Environmental Engineering, Nanyang Technological Univ., Blk N1, No. 1B-36, Nanyang Ave., Singapore 639798, Singapore 共corresponding author兲. E-mail: [email protected].
2
Project Officer, School of Civil and Environmental Engineering, Nanyang Technological Univ., Singapore 639798, Singapore. E-mail: [email protected]
3
Associate Professor, School of Civil and Environmental Engineering, Nanyang Technological Univ., Blk N1, No. 1C-80, Nanyang Ave., Singapore 639798, Singapore. E-mail: [email protected]
4
Deputy Director and Professional Engineer, Dept. of Building Tech-nology, Housing and Development Board, HDB Hub 480, Lorong 6, Toa Payoh, Singapore 310480, Singapore. E-mail: [email protected]
Note. This manuscript was submitted on April 29, 2009; approved on February 19, 2010; published online on May 11, 2010. Discussion period open until April 1, 2011; separate discussions must be submitted for individual papers. This paper is part of theJournal of Geotechnical and Geoenvironmental Engineering, Vol. 136, No. 11, November 1, 2010. ©ASCE, ISSN 1090-0241/2010/11-1555–1564/$25.00.
Downloaded from ascelibrary.org by Curtin Univ of Technology 2009 on 10/06/12. For personal use only. No other uses without permission. Copyright (c) 2012. American Society of Civil Engineers. All rig
of the island. Sedimentary rocks of the JF, which contain varia-tions of conglomerate, shale, and sandstone, are located in the southern, southwestern, and western parts of Singapore. Climatic conditions in Singapore are characterized by uniform tempera-ture, high humidity, and particularly, abundant rainfalls. The rainy season can be divided into two main seasons, the wetter Northeast Monsoon season from December to March and the drier South-west Monsoon season from June to September共National Environ-ment Agency 2007兲. During the Northeast Monsoon season, moderate to heavy rainfalls usually occur between December and January. Maximum rainfall usually occurs between December and January, whereas July is noted as the driest month共National En-vironment Agency 2007兲.
Several slopes located at the residual soil slopes from the BT and the sedimentary JF were investigated to obtain information on typical soil properties, slope geometry, and position of ground-water table for both formations. The investigated slopes had a slope angle and a slope height varying from 15° to 40° and from 5 to 42 m, respectively.
Location and Geometry of Slopes
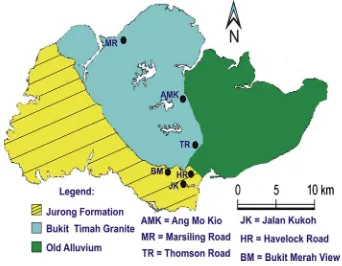
Six slopes were selected from two different geological formations in Singapore. Ang Mo Kio St. Twenty-one 共AMK兲, Thomson Road 共TR兲, and Marsiling Road 共MR兲 slopes are located in the BT, while Bukit Merah View 共BM兲, Jalan Kukoh共JK兲, and Havelock Road 共HR兲 slopes are located in the JF共Fig. 1兲. Soil sampling was performed using continuous foam drilling with a Mazier sampler to obtain good quality samples. Laboratory tests were then carried out to obtain saturated and unsaturated hydrau-lic properties and shear strength of the investigated soils. Soil profiles of the observed slopes could then be constructed. The unsaturated laboratory tests included soil-water characteristic curve 共SWCC兲 tests and unsaturated triaxial tests for obtaining unsaturated shear-strength parameters.
Positions of Groundwater Table
The investigated slopes were instrumented with at least two pi-ezometers to monitor the position of groundwater table. Manual monitoring of the Casagrande piezometers for all slopes was car-ried out over a 2-year period 共June 2006 until September 2008兲. Variations of groundwater table positions for the driest and wet-test periods are shown in Figs. 2 and 3 in the residual soil slopes from BT and JF, respectively. The average positions of ground-water table, representing its typical position in residual soil slopes in Singapore, were calculated based on the minimum position of
groundwater table during the dry period and the maximum posi-tion of groundwater table during the wet period共Figs. 2 and 3兲. The symbol ᐉ in Figs. 2 and 3 represents the distance of the piezometers共P1 and P2兲measured from the crest of slope, while the symbolhcorresponds to the depth of groundwater table from the slope surfaces. Slope vertical heights and slope horizontal lengths were denoted asHandL, respectively.
Figs. 2 and 3 show that the groundwater table of the JF slope was generally deeper than that of the BT slope during dry and wet periods. However, the groundwater table of the JF slope indicated a larger difference between dry and wet periods as compared to that of the BT slope. This condition may be attributed to the large variability of soil types in the JF residual soil that was derived from the sedimentary rocks of different variations from conglom-erate to shale, siltstone, and sandstone. On the other hand, the BT residual soil was derived mainly from the same granitic rock of Bukit Timah formation.
Soil Properties of Investigated Slopes
SWCCs
SWCC tests were performed using Tempe cell and pressure plate. Matric suction up to 500 kPa was applied to several specimens of
Fig. 1.Location of instrumented slopes in Singapore
Fig. 2.Variation of groundwater table position for the residual soil slopes from BT
Fig. 3.Variation of groundwater table position for the residual soil slopes from JF
Downloaded from ascelibrary.org by Curtin Univ of Technology 2009 on 10/06/12. For personal use only. No other uses without permission. Copyright (c) 2012. American Society of Civil Engineers. All rig
the BT and the JF residual soils taken from various depths. The SWCCs of the investigated soils were plotted in terms of normal-ized volumetric water content ⌰w versus matric suction ua−uw.
The normalized volumetric water content can be defined with respect to the residual water content of the soil as follows:
⌰w=w−r
s−r 共1兲
where⌰w= normalized volumetric water content;w= volumetric
water content at particular matric suction;r= residual volumetric water content; ands= saturated volumetric water content.
The SWCCs from two soil layers of Ang Mo Kio 共AMK1 and AMK2兲, two soil layers of Thomson Road 共TR1 and TR2兲, and one soil layer of Marsiling Road共MR1兲slopes were collated with the SWCC data of the BT residual soils of Agus et al. 共2001兲. The normalized SWCC data of the BT residual soils are shown in Fig. 4.
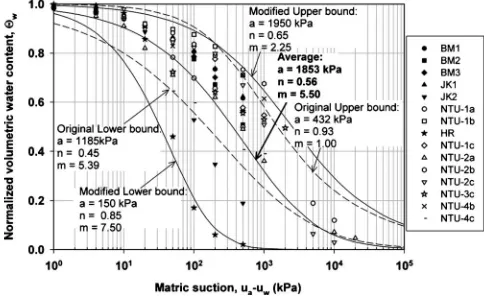
The SWCCs from three soil layers of Bukit Merah View 共BM1, BM2, and BM3兲, two soil layers of Jalan Kukoh共JK1 and JK2兲, and one soil layer of Havelock Road 共HR兲 slopes were collated with SWCC data of the JF residual soils of Agus et al. 共2001兲. The normalized SWCC data for the JF residual soils were compiled, as shown in Fig. 5.
The following SWCC equation共Fredlund and Xing 1994兲was used to best fit the data:
w=C共兲
s
兵ln关e+共ua−uw/a兲n兴其m
共2兲
where C共兲= correction factor; 共ua−uw兲= matric suction 共kPa兲;
ande= natural number共2.718 28,…兲. The fitting parametersa,n, andmare related to the air-entry value of the soil共kPa兲, the slope of the SWCC, and the residual water content, respectively. Leong and Rahardjo共1997兲suggested using a correction factor of 1. The upper and lower bounds of the normalized SWCC together with typical SWCC for each formation were subsequently drawn on the graphs based on Eq.共2兲withC共兲= 1. A typical SWCC was obtained by taking a mean value of volumetric water content for each matric suction within the upper bound and lower bound of SWCC. Then, the mean value of volumetric water content was fitted using Fredlund and Xing’s共1994兲equation with correction factor= 1, as suggested by Leong and Rahardjo共1997兲.
Fig. 4 illustrates that the upper and lower bounds of normal-ized SWCC for the BT residual soils were considered to be the same with those envelopes proposed by Agus et al. 共2001兲.
The upper bound of normalized SWCC envelope gave a= 159 kPa, n= 0.93, and m= 1.004; and the lower bound of normalized SWCC envelope gave a= 32 kPa, n= 0.525, and m= 2.243. The typical normalized SWCC fitting parameters were a= 20 kPa,n= 0.8, andm= 0.75.
Fig. 5 shows the lower bound of normalized SWCC for the JF residual soils 共a= 150 kPa, n= 0.85, and m= 7.5兲 and was lower and steeper than that proposed by Agus et al.共2001兲. Meanwhile, the upper bound of normalized SWCC 共a= 1 , 950 kPa, n= 0.65, and m= 2.25兲 was observed to be higher than that proposed by Agus et al.共2001兲. The typical normalized SWCC fitting param-eters werea= 1 , 853 kPa,n= 0.56, andm= 5.5. In general, the new envelope of normalized SWCC for the JF soils was wider than that proposed by Agus et al.共2001兲.
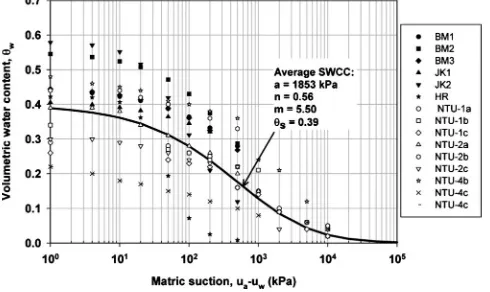
Using the saturated volumetric water content of each soil, the corresponding typical SWCC was then used as the input soil properties in the parametric study, for both BT and JF residual soils 共Figs. 6 and 7兲, respectively. It can be observed that the SWCC of the BT residual soils has higher saturated volumetric water content, lower air-entry value, steeper slope, and lower re-sidual water content than those of the JF rere-sidual soils.
Permeability Function
Field and laboratory permeability tests were conducted to obtain saturated permeabilityksof the selected residual soils. Saturated
permeabilities of the BT and the JF residual soils were then
Fig. 4.Normalized SWCCs of the residual soils from BT关compiled data from Agus et al.共2001兲, AMK, TR, and MR observed slopes兴
Fig. 5.Normalized SWCCs of the residual soils from JF关compiled data from Agus et al.共2001兲, BM, JK, and HR observed slopes兴
Fig. 6.SWCCs of the residual soils from BT
Downloaded from ascelibrary.org by Curtin Univ of Technology 2009 on 10/06/12. For personal use only. No other uses without permission. Copyright (c) 2012. American Society of Civil Engineers. All rig
used in the parametric studies. Permeability functions of the in-vestigated soils were determined indirectly from SWCC using the statistical model 共Marshall 1958; Millington and Quirk 1959; Kunze et al. 1968兲as explained in Fredlund and Rahardjo共1993兲. Permeability functions of the BT residual soils with ks= 3
⫻10−5m/s and the JF residual soils with k
s= 4⫻10−6m/s are
shown in Fig. 8.
Shear Strength
Shear strengths of the BT and the JF residual soils were obtained from two types of triaxial tests. The consolidated undrained tri-axial tests with pore-water pressure measurement were carried out to obtain effective cohesion 共c⬘兲 and effective angle of internal friction共⬘兲of the residual soils. Meanwhile, multistage consoli-dated drained triaxial tests were performed using a modified triaxial apparatus to obtain an angle indicating the rate of change in shear strength relative to a change in matric suction 共b兲 of
the residual soils. Typical shear strengths of the observed residual soils were then used in parametric studies. The shear-strength parameters of the BT residual soil used in the parametric studies were c⬘= 3.5 kPa, ⬘= 31.5°, and b= 22.5°. Those values were
within the ranges suggested by Leong et al. 共2002兲; i.e., c⬘= 0 – 14 kPa, ⬘= 29° – 32°, and b= 15° – 32°. The JF soil
has c⬘= 6.5 kPa, ⬘= 30.5°, and b= 22°. Leong et al. 共2000兲
suggested the ranges forc⬘,⬘, andbfor the JF residual soil as
5–9 kPa, 27°–35°, and 23°–35°, respectively.
Numerical Modeling of Residual Soil Slopes in Singapore
Parametric studies were conducted to assess the stability of re-sidual soil slopes subjected to several independent variables. The controlling independent variables are the position of initial groundwater table, soil properties, and rainfall intensity.
Controlling Parameters in Numerical Analyses
The study of the effect of groundwater table on the stability of the BT and the JF slopes in Singapore involves six series of paramet-ric studies. Two series were conducted using the initial positions of groundwater table during dry period. The other two series were performed using the initial positions of groundwater table during wet period. The remaining series of these parametric studies were conducted using the average groundwater table positions of re-sidual soil slopes in Singapore as the initial positions of ground-water table. Based on the Code of Practice of Power and Utilities Board, Singapore 共PUB 2000兲 for drainage system design, the maximum total amount of rainfall in a day is 533.2 mm. There-fore, a rainfall intensity of 22 mm/h for a duration of 24 h was applied in all series of these parametric studies.
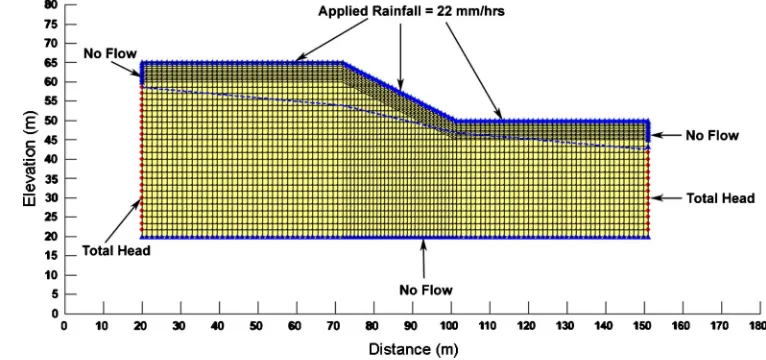
A typical slope geometry with height 共H兲of 15 m, angle of 27°, and length共L兲of 29.4 m共Rahardjo et al. 2000兲was used in the model for parametric study of residual soil slopes from the BT and the sedimentary JF. The initial position of groundwater table for each series of parametric studies was calculated from Figs. 2 and 3. As an example, Fig. 2 shows that at the wettest period, the groundwater table position in the BT slope was ath/Hof 0.653 at the crest共ᐉ/L= 0兲and ath/Hof 0.053 at the toe共ᐉ/L= 1兲of the slope. In other words, the actual depths of groundwater table共h兲 were 9.8 and 0.8 m at the crest and the toe of the BT slope, respectively, corresponding to H= 15 m. Similarly, the initial po-sition of groundwater table for the JF slope was calculated from Fig. 3 for the wettest and driest periods.
The study of the effect of rainfall intensity on the stability of the BT and the JF slopes in Singapore involved eight series of parametric studies. All series in these parametric studies were conducted using the average groundwater table positions of re-sidual soil slopes in Singapore as the initial positions of ground-water table. Four different rainfall intensities, 9, 22, 36, and 80 mm/h, were used in these studies. Paulhus共1965兲observed that the greatest rainfall intensity in the world is 80 mm/h. Therefore, this rainfall intensity was also adopted in the numerical analyses. All numerical analyses were conducted for a period of 48 h with rainfall being applied during the first 24 h.
Seepage and Slope Stability Modeling
Two-dimensional seepage analyses were performed in this study using the finite-element software SEEP/W 共Geoslope Interna-tional Pte. Ltd. 2004a兲. In Singapore, majority of slope failures occurred within a shallow depth. Simplified slope profiles with a homogeneous soil layer共one layer兲from the JF and the BT slope were used in the parametric study. Typical SWCC共Figs. 6 and 7兲 and permeability functions 共Fig. 8兲 were used in the numerical analyses.
Boundary conditions were applied to the slope model for the transient seepage analyses. Nonponding boundary condition was applied in order to prevent excessive accumulation of rainfall on the slope surface. The flux boundaryqequal to the desired rain-fall intensity and duration was applied to the surface of the slope. Fig. 7.SWCCs of the residual soils from JF
Fig. 8.Permeability function of the residual soils from BT and JF
Downloaded from ascelibrary.org by Curtin Univ of Technology 2009 on 10/06/12. For personal use only. No other uses without permission. Copyright (c) 2012. American Society of Civil Engineers. All rig
The nodal fluxQequal to zero was applied along the sides above the water table line and along the bottom of the slope in order to simulate no flow zone. The sides below the water table were defined as head boundaries equal to the specific position of the groundwater level共total headhw兲. Initial condition for the slope
model was taken as hydrostatic pore-water pressure condition with a limiting negative pore-water pressure of 75 kPa. The limit was imposed to prevent the generation of unrealistic pore-water pressures. Rahardjo et al.共2000兲observed that the highest matric suction measured in a few sites in Singapore was 75 kPa. Fig. 9 shows the typical slope model and the applied flux boundary con-ditions. The distance between the slope and the side of the slope model was set to three times the height of the slope to avoid the influence of the side boundary conditions. The finite-element model down to 5 m below the slope surface had a mesh size of approximately 0.5 m, smaller than other part of the slope, in order to obtain accurate results within the infiltration zone.
The selected time increment was related to a period of rainfall of 24 h. Finer time increments provide more accurate seepage and slope stability analyses. Therefore, the time increments were set as 1, 2, 5, 10, 20, 30, and 60 min. The time increment was altered every ten steps and the total simulated duration was 48 h. The pore-water pressures were calculated in SEEP/W for every time step at each node of the finite-element mesh. The pore-water pres-sure output of the seepage analyses was incorporated into slope stability analyses.
Slope stability analyses of the BT and the JF slopes were performed using SLOPE/W 共Geoslope International Pte. Ltd. 2004b兲. The finite-element mesh of the slope model in SEEP/W was imported to SLOPE/W. The typical saturated and unsaturated shear strengths for the BT and the JF residual soils were used in the slope stability analyses using Bishop’s simplified method. The pore-water pressure distribution was selected for each time incre-ment, and the corresponding factor of safety was calculated.
Parametric Studies with Variation of Groundwater Table Position
Variations in factor of safety due to initial groundwater table positions at the BT and the JF residual soil slopes are given in Figs. 10 and 11, respectively. Fig. 10 shows that the factor of safety of the BT slope reached a minimum value when rainfall stopped regardless of the position of groundwater table. Factor of
safety for the BT slope in the driest period 共2.16兲 and at the average condition 共2.04兲 decreased drastically and reached a minimum value at 1.7. After the rainfall ceased, the factor of safety for the BT slope at the driest period and at the average condition increased rapidly at the same recovery rate. The factor of safety for the BT slope in the wettest period decreased gradu-ally from 1.7 to 1.45 and then it increased slowly after the rainfall stopped.
Fig. 11 shows that the factor of safety decreased rapidly during the driest period due to the high matric suction of the soil above groundwater table before rainfall. In the wettest period, the de-crease in factor of safety was slower as compared to other peri-ods. The factor of safety共2.5兲of the JF slope in the driest period decreased significantly to a minimum factor of safety of 1.8, 1 h after the rainfall stopped. After which, the factor of safety recov-ered slowly. The factor of safety 共2.0兲 of the JF slope at the average condition decreased rapidly and reached a minimum fac-tor of safety of 1.6, 1 h after the rainfall stopped. Subsequently, it recovered at the same rate as that for the driest period. The factor Fig. 9.Slope model for parametric studies共slope height= 15 m and slope angle= 27°兲
Fig. 10. Variation of factor of safety of the slopes from BT for different groundwater table positions 共slope height= 15 m and slope angle= 27°兲
Downloaded from ascelibrary.org by Curtin Univ of Technology 2009 on 10/06/12. For personal use only. No other uses without permission. Copyright (c) 2012. American Society of Civil Engineers. All rig
of safety 共1.56兲 of the JF slope at the wettest period decreased slowly and it reached a minimum value of 1.4 at 12 h after rain-fall stopped.
The groundwater table position affected the initial factor of safety. The closer the groundwater table position to the ground surface, the lower the initial factor of safety would be. The sig-nificant difference in the decreasing rate of factor of safety for the JF slope during the driest, average, and wettest periods was caused by the wide range of groundwater table position in the JF slope for those periods. In the driest period, the initial matric suction before rainfall is higher than that in other periods. When rainwater infiltrated into the soil layer, the matric suction de-creased drastically, resulting in the significant decrease in factor of safety during dry periods. The minimum factor of safety for the JF slope was not observed at the end of rainfall, but 1 h after the rainfall stopped for the average groundwater table condition and during the driest period. In the wettest period, the minimum factor of safety was observed 12 h after the rainfall stopped. However, the time delay to reach the minimum factor of safety was not observed in the BT slope. This could be attributed to the effects of SWCC and permeability function on the JF residual soil. The JF residual soil slope had lower water-entry value and gentler per-meability function, resulting in a slower infiltration rate of rain-water than that in the BT slope. Although rainfall already stopped, the rainwater continued to percolate down into greater depths. As a result, the most critical slip surface might be observed several hours after the rainfall stopped.
Parametric Studies with Variation of Rainfall Intensity
The effects of different rainfall intensities on the stability of the BT and the JF slopes are shown in Figs. 12 and 13, respectively. Factor of safety of the BT slope with a rainfall intensity higher than 22 mm/h decreased drastically during the rainfall period and recovered rapidly after the rainfall stopped. The magnitude and the rate of decrease in factor of safety were related to the rainfall intensity. A higher intensity of rainfall caused the factor of safety to decrease more rapidly. However, the minimum factors of safety for the BT slope with 22, 36, and 80 mm/h of rainfall intensity were approximately similar. This behavior indicated that the slope had reached its threshold rainfall intensity at 22 mm/h, beyond
which rainfall intensity did not appear to affect the minimum factor of safety significantly because the soil had reached its ca-pacity to receive rainwater. On the other hand, a rainfall intensity of 9 mm/h共2.5⫻10−6m/s兲had no significant effect on the factor
of safety of the BT slope. Fig. 8 shows that the BT slope had a low permeability at a high suction. The deep groundwater table of the BT slope created a high matric suction in the BT slope before rainfall, resulting in a low permeability. The application of 9 mm/h of rainfall for 24 h was not high enough to change the matric suction of the BT soil significantly. Therefore, the rainwa-ter had difficulties to infiltrate into the slope, and the factor of safety remained constant during 24 h of rainfall.
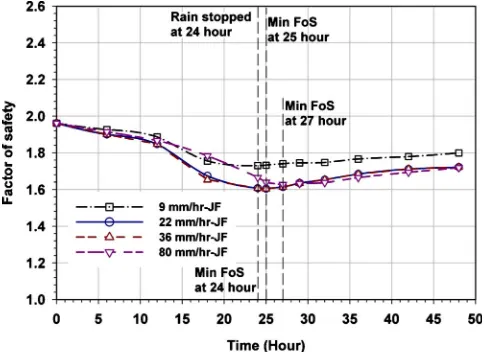
In the JF slope, rainwater infiltrated into the slope slowly dur-ing 12 h of rainfall causdur-ing the factor of safety to decrease gradu-ally 共Fig. 13兲. Similar to the BT soil, the permeability of the JF soil was low due to the initially high matric suction of the JF slope. After 12 h of rainfall, the matric suction of the JF soil had already decreased significantly and permeability of the soil also increased. Therefore, the factor of safety started to decrease at a faster rate and recovered gradually after reaching the minimum Fig. 11.Variation of factor of safety of the slopes from JF for
dif-ferent groundwater table positions 共slope height= 15 m and slope angle= 27°兲
Fig. 12. Variation of factor of safety of the slopes from BT for different rainfall intensities 共slope height= 15 m and slope angle = 27°兲
Fig. 13.Variation of factor of safety of the slopes from JF for dif-ferent rainfall intensities共slope height= 15 m and slope angle= 27°兲
Downloaded from ascelibrary.org by Curtin Univ of Technology 2009 on 10/06/12. For personal use only. No other uses without permission. Copyright (c) 2012. American Society of Civil Engineers. All rig
value of factor of safety. The minimum factor of safety was reached several hours after rainfall stopped regardless of the in-tensity of rainfall. The JF slope with 9, 22, and 36 mm/h, rainfall reached the minimum factor of safety, 1 h after the rainfall stopped. However, the JF slope with 80 mm/h of rainfall reached the minimum factor of safety of 1.64, 3 h after the rainfall stopped 共Fig. 13兲. The delay in reaching the minimum factor of safety occurred due to the low saturated permeability of the JF soil. At the end of the rainfall, rainwater had not reached the critical slip surface. It took some time for the rainwater to reach the critical point depending on the infiltration rate of the rainwa-ter. The minimum factors of safety of the JF slope with applied rainfall intensities of 22, 36, and 80 mm/h were approximately similar. This indicated that a rainfall intensity of 22 mm/h can be considered as a threshold value for residual soil slopes in Sin-gapore.
Fig. 12 shows that the factor of safety of the BT slope re-mained constant during a low intensity of rainfall 共9 mm/h兲 whereas the factor of safety of the JF slope共Fig. 13兲decreased quite significantly for the same rainfall intensity. This differing characteristic can be attributed to the permeability functions of the respective soils. Fig. 8 shows that the permeability of the BT soil was lower at high suctions as compared to that of the JF soil. As a result, rain water infiltrated the BT slope at a slower rate than the infiltration rate in the JF slope, causing the factor of safety of the BT slope to remain essentially constant while the factor of safety of the JF slope decreased significantly.
Case Studies
Numerical analyses of two actual slopes located in the residual soils of the two main geological formations in Singapore were carried out using the actual slope geometry, soil properties, and position of groundwater table, and the results were compared with the finding from the parametric studies. The BT residual soil slope at MR had a slope height共H兲of 17 m and a slope angle of 27°共Fig. 14兲. The first soil layer of the slope consisted of a silty sand with unit weight of 20 kN/m3, effective cohesion of 9 kPa, effective angle of internal friction of 34°, and b angle of 21°.
The second soil layer consisted of a sandy silt with unit weight of 20 kN/m3, effective cohesion of 0 kPa, effective angle of internal
friction of 33°, andbangle of 26.1°. The second slope selected
for the case study was the JF residual soil slope at JK with a slope height共H兲of 12 m and slope angle of 33° 共Fig. 15兲. The slope consisted of two soil layers. The first layer was a clayey sand with unit weight of 20 kN/m3, effective cohesion of 4 kPa, effective angle of internal friction of 33°, andbangle of 25°. The second
layer consisted of a clayey sand with unit weight of 20 kN/m3, effective cohesion of 0 kPa, effective angle of internal friction of 36°, andbangle of 26.5°.
Three piezometers were installed in the MR slope to monitor the position of groundwater table with time. A 20-m-long piezom-eter was placed at the crest of the slope 共ᐉ/L= 0兲, a 14-m-long piezometer at midslope 共ᐉ/L= 0.33兲, and an 11-m-long piezom-eter at the toe of the slope共ᐉ/L= 0.93兲. The depths of groundwa-ter table共h兲were about 16.43, 10.85, and 4.74 m or共h/H= 0.96, 0.64, and 0.28兲below the slope surface at the crest, mid-, and toe of the slope, respectively. Fig. 2 shows that the groundwater table of MR slope was close to the groundwater table position for the BT soil at the driest period. Three piezometers were also installed in the JK slope to observe the groundwater table movement. Pi-ezometers of 13, 10, and 6 m long were placed near the crest of the slope共ᐉ/L= 0.15兲, at the midslope共ᐉ/L= 0.25兲, and at the toe of the slope 共ᐉ/L= 1兲, respectively. The depths of groundwater table共h兲were about 10, 10, and 3 m or共h/H= 0.83, 0.83, 0.25兲 below the slope surface near the crest, mid-, and toe of the slope, respectively. Fig. 3 shows that the groundwater table of JK slope was close to the groundwater table position for the JF slope at the driest period.
Fig. 14.Soil profile of the slope from BT at MR
Fig. 15.Soil profile of the slope from JF at JK
Fig. 16.SWCCs of the residual soil from BT at MR
Downloaded from ascelibrary.org by Curtin Univ of Technology 2009 on 10/06/12. For personal use only. No other uses without permission. Copyright (c) 2012. American Society of Civil Engineers. All rig
SWCCs for residual soils at MR and JK slopes are shown in Figs. 16 and 17, respectively. The lines on the graph represent the best-fitted Fredlund and Xing SWCC equations whereas the sym-bols represent laboratory test results. In general, SWCC of the BT residual soil at MR had a higher saturated volumetric water con-tent, lower air-entry value, steeper slope, and lower residual water content than that of the JF residual soil at JK. The measured saturated permeabilities of the first and second layers of the MR residual soil were 6⫻10−6and 3.3⫻10−5m/s, respectively. The
saturated permeability of both clayey sand layers for JK slope as obtained from laboratory test was 8.2⫻10−6m/s. Figs. 18 and 19
show the permeability functions of the residual soils at MR and JK slopes, respectively.
Seepage analyses of the slopes under 22-mm/h rainfall inten-sity for 24 h were performed using SEEP/W. Subsequently, slope stability analyses were conducted using SLOPE/W by importing the pore-water pressure distributions from SEEP/W seepage analyses. The comparison of factor of safety during 24-h rainfall and after rainfall for the MR and JK slopes is shown in Fig. 20. Fig. 20 shows that the initial factor of safety of the MR slope 共1.94兲was higher than that of the JK slope共1.79兲. The factor of safety of the MR slope decreased rapidly during rainfall until it reached the minimum factor of safety of 1.54 at the end of rain-fall. Similar behavior was also observed in the parametric studies
of the BT residual soil slope under 22 mm/h of rainfall. The high permeability of the soil allowed rainwater to infiltrate quickly and percolate down to greater depths of soil layers. This would result in a rapid increase in the pore-water pressures in the slope. Fig. 20 also shows that the recovery rate of factor of safety for the MR slope after rainfall was faster than that of the JK slope due to the higher saturated permeability of the BT residual soil.
On the contrary, the factor of safety of the JK slope decreased gradually to 1.43 after 24 h of rainfall and continued to decline to the minimum factor of safety of 1.41 at 5 h after the rainfall stopped. The lower saturated permeability of the JF slope caused a slower rainwater infiltration, which delayed the occurrence of the minimum factor of safety to some time later after the rainfall stopped. Similar behavior was also observed in the parametric studies for the JF slope under 22 mm/h of rainfall.
The results from case studies show relatively good agreement with the results obtained from parametric studies for different positions of groundwater table. Case studies show that the factor of safety for the MR slope at the driest period 共1.94兲decreased significantly during 12 h of rainfall and continued to decrease gradually until it reached the minimum factor of safety共1.54兲at the end of rainfall共Fig. 20兲. The factor of safety for the JK slope at the driest period共1.8兲decreased gradually during 12 h of rain-Fig. 17.SWCCs of the residual soil from JF at JK
Fig. 18.Permeability function of the residual soil from BT at MR
Fig. 19.Permeability function of the residual soil from JF at JK
Fig. 20.Factor of safety variation of residual soil slopes at MR and JK
Downloaded from ascelibrary.org by Curtin Univ of Technology 2009 on 10/06/12. For personal use only. No other uses without permission. Copyright (c) 2012. American Society of Civil Engineers. All rig
fall and continued to decrease rapidly until reaching the minimum factor of safety 共1.41兲 共Fig. 20兲. This behavior was similar to those observed in the parametric studies for the BT and the JF slopes at the driest period 共Figs. 10 and 11, respectively兲. Al-though the minimum factor of safety obtained from the analyses did not indicate slope failures, other slope geometries or soil properties may produce a minimum factor of safety that corre-sponds to slope failure.
Conclusions
The groundwater table of residual soil slope from the sedimentary JF has a larger variation between dry and wet periods as com-pared to the groundwater table of residual soil slope from the BT due to the large variation of soil types in residual soil slope from the sedimentary JF.
At the driest period, the groundwater table of the JF slope is deeper than that of the BT slope. As a result, the factor of safety of the JF slope decreases more rapidly during rainfall as com-pared to that of the BT slope. At the wettest period, the ground-water tables of slopes from both formations are located near the ground surface. As a result, the factors of safety of the JF and BT slopes decrease gradually during rainfall and also recover gradu-ally after the rainfall stops.
The BT slope has coarser soil particles and higher permeabil-ity than the JF slope. As a result, the factor of safety of the BT slope decreases more rapidly than that of the JF slope under rain-fall intensities of 22, 36, and 80 mm/h. The minimum factor of safety of the slope from both formations will not change signifi-cantly if the applied rainfall intensity is higher than 22 mm/h because the soil has reached its capacity to receive rainwater. However, the threshold rainfall intensity of 22 mm/h still requires further investigation.
Soil properties affect the occurrence of the minimum factor of safety of slope. If a soil contains high percentage of fine particles, the air-entry value of the SWCC will be high, the permeability function will be gentle, and the saturated permeability will be low. As a result, the minimum factor of safety may not occur at the end of rainfall, but several hours after the rainfall stops be-cause rainwater has not reached the critical slip surface at the end of rainfall.
The variations in factor of safety from case studies showed similar trends with those obtained from parametric studies. How-ever, different slope geometries and soil properties will result in different values of minimum factor of safety.
Acknowledgments
This work was supported by a research grant from a collaboration project between the Housing and Development Board and Nan-yang Technological University 共NTU兲, Singapore. The writers gratefully acknowledge the assistance of the Geotechnical Labo-ratory Staff, School of Civil and Environmental Engineering, NTU, Singapore during the experiments and data collections.
References
Agus, S. S., Leong, E. C., and Rahardjo, H.共2001兲. “Soil-water charac-teristic curves of Singapore residual soils.”J. Geotech. Geoenviron. Eng., 19共3–4兲, 285–309.
Brand, E. W.共1984兲. “Landslides in Southeast Asia: A state-of-art report.”
Proc., 4th Int. Symp. on Landslides, Canadian Geotechnical Society, Toronto, Canada, 1013–1016.
Chatterjea, K.共1989兲. “Observations on the fluvial and slope processes in Singapore and their impact on the urban environment.” Ph.D. thesis, National Univ. of Singapore, Singapore.
Cho, S. E., and Lee, S. R.共2002兲. “Evaluation of surficial stability for homogeneous slopes considering rainfall characteristics.”J. Geotech. Geoenviron. Eng., 128共9兲, 756–763.
Fredlund, D. G., and Rahardjo, H.共1993兲.Soil mechanics for unsaturated soils, Wiley, New York.
Fredlund, D. G., and Xing, A.共1994兲. “Equations for the soil-water char-acteristic curve.”Can. Geotech. J., 31, 533–546.
Gasmo, J. M., Rahardjo, H., and Leong, E. C.共2000兲. “Infiltration effects on stability of a residual soil slope.”Comput. Geotech., 26, 145–165. Geoslope International Pte. Ltd. 共2004a兲. “Seep/W for finite-element seepage analysis.”Version 6.22: User’s guide, Geoslope Int. Ltd., Cal-gary, Alta., Canada.
Geoslope International Pte. Ltd. 共2004b兲. “Slope/W for slope stability analysis.” Version 6.22: User’s guide, Geoslope Int. Ltd., Calgary, Alta., Canada.
Kunze, R. J., Uehara, G., and Graham, K.共1968兲. “Factors important in the calculation of hydraulic conductivity.”Soil Sci. Soc. Am. Proc.,
32, 760–765.
Leong, E. C., and Rahardjo, H.共1997兲. “A review on soil-water charac-teristic curve equations.” J. Geotech. Geoenviron. Eng., 123共12兲, 1106–1117.
Leong, E. C., Rahardjo, H., and Tang, S. K.共2002兲. “Characterization and engineering properties of Singapore residual soils.”Proc., Int. Work-shop on Characterization and Engineering Properties of Natural Soils, Balkema, The Netherlands, 1–10.
Lim, T. T., Rahardjo, H., Chang, M. F., and Fredlund, D. G. 共1996兲. “Effect of rainfall on matric suction in a residual soil slope.” Can. Geotech. J., 33, 618–628.
Marshall, T. J.共1958兲. “A relation between permeability and size distri-bution of pores.”J. Soil Sci., 9, 1–8.
Millington, R. J., and Quirk, J. P.共1959兲. “Permeability of porous media.”
Nature (London), 183, 387–388.
National Environment Agency. 共2007兲. Meteorological services data, Singapore.
Ng, C. W. W., Wang, B., and Tung, Y. K.共2001兲. “Three-dimensional numerical investigations of groundwater responses in an unsaturated slope subjected to various rainfall patterns.” Can. Geotech. J., 38, 1049–1062.
Paulhus, J. L. H. 共1965兲. “Indian Ocean and Taiwan rainfalls set new records.”Mon. Weather Rev., 93, 331–335.
PUB.共2000兲.Code of practice on surface water drainage, Singapore. PWD.共1976兲.Geology of the Republic of Singapore, Singapore. Rahardjo, H., Lee, T. T., Leong, E. C., and Rezaur, R. B.共2005兲.
“Re-sponse of a residual soil slope to rainfall.”Can. Geotech. J., 42共2兲, 340–351.
Rahardjo, H., Leong, E. C., Deutcher, M. S., Gasmo, J. M., and Tang, S. K.共2000兲. “Rainfall-induced slope failures.”Geotechnical engineer-ing monograph 3, NTU-PWD Geotechnical Research Centre, Nan-yang Technological Univ., Singapore, 1–86.
Rahardjo, H., Leong, E. C., and Rezaur, R. B.共2008兲. “Effect of anteced-ent rainfall on powater pressure distribution characteristics in re-sidual soil slopes under tropical rainfall.” Hydrolog. Process., 22, 506–523.
Rahardjo, H., Li, X. W., Toll, D. G., and Leong, E. C.共2001兲. “The effect of antecedent rainfall on slope stability.”J. Geotech. Geological Eng.,
19共3–4兲, 371–399.
Rahardjo, H., Ong, T. H., Rezaur, R. B., and Leong, E. C. 共2007b兲. “Factors controlling instability of homogeneous soil slopes under rainfall loading.”J. Geotech. Geoenviron. Eng., 133共12兲, 1532–1543. Rahardjo, H., Satyanaga, A., Leong, E. C., Ng, Y. S., Foo, M. D.,
Downloaded from ascelibrary.org by Curtin Univ of Technology 2009 on 10/06/12. For personal use only. No other uses without permission. Copyright (c) 2012. American Society of Civil Engineers. All rig
and Wang, C. L.共2007a兲. “Slope failures in Singapore due to rain-fall.” Proc., 10th Australia New Zealand Conf. on Geomechanics, Vol. 2, Institution of Engineers, Australia, 704–709.
Tan, S. B., Tan, S. L., Lim, T. L., and Yang, K. S.共1987兲. “Landslides problems and their control in Singapore.”Proc., 9th Southeast Asian Geotechnical Conf., Vol. 1, Southeast Asian Geotechnical Society, Bangkok, Thailand, 25–36.
Tohari, A., Nishigaki, M., and Komatsu, M.共2007兲. “Laboratory
rainfall-induced slope failure with moisture content measurement.” J. Geo-tech. Geoenviron. Eng., 133共5兲, 575–587.
Toll, D. G., Rahardjo, H., and Leong, E. C.共1999兲. “Landslides in Sin-gapore.”Proc., 2nd Int. Conf. on Landslides, Slope Stability and the Safety of Infra-Structures, CI-Premier Pte Ltd., Singapore, 269–276. Tsaparas, I., Rahardjo, H., Toll, D. G., and Leong, E. C.共2002兲.
“Con-trolling parameters for rainfall-induced landslides.” Comput. Geo-tech., 29共1兲, 1–27.
Downloaded from ascelibrary.org by Curtin Univ of Technology 2009 on 10/06/12. For personal use only. No other uses without permission. Copyright (c) 2012. American Society of Civil Engineers. All rig