Embedded Systems
Djones Lettnin
Markus Winterholer
Editors
Embedded
Software
Verification
This Series addresses current and future challenges pertaining to embedded hardware, software, specifications and techniques. Titles in the Series cover a focused set of embedded topics relating to traditional computing devices as well as high-tech appliances used in newer, personal devices, and related topics. The material will vary by topic but in general most volumes will include fundamental material (when appropriate), methods, designs and techniques.
Veri
fi
cation and Debugging
Djones Lettnin
Universidade Federal de Santa Catarina Florianópolis
Brazil
Markus Winterholer Luzern
Switzerland
ISSN 2193-0155 ISSN 2193-0163 (electronic)
Embedded Systems
ISBN 978-1-4614-2265-5 ISBN 978-1-4614-2266-2 (eBook) DOI 10.1007/978-1-4614-2266-2
Library of Congress Control Number: 2017932782
©Springer Science+Business Media, LLC 2017
This work is subject to copyright. All rights are reserved by the Publisher, whether the whole or part of the material is concerned, specifically the rights of translation, reprinting, reuse of illustrations, recitation, broadcasting, reproduction on microfilms or in any other physical way, and transmission or information storage and retrieval, electronic adaptation, computer software, or by similar or dissimilar methodology now known or hereafter developed.
The use of general descriptive names, registered names, trademarks, service marks, etc. in this publication does not imply, even in the absence of a specific statement, that such names are exempt from the relevant protective laws and regulations and therefore free for general use.
The publisher, the authors and the editors are safe to assume that the advice and information in this book are believed to be true and accurate at the date of publication. Neither the publisher nor the authors or the editors give a warranty, express or implied, with respect to the material contained herein or for any errors or omissions that may have been made. The publisher remains neutral with regard to jurisdictional claims in published maps and institutional affiliations.
Printed on acid-free paper
This Springer imprint is published by Springer Nature
The registered company is Springer Science+Business Media LLC
Foreword
I am glad to write a foreword for this book.
Verification (informally defined as the process offinding bugs before they annoy or kill somebody) is an increasingly important topic. And I am particularly glad to see that the book covers the full width of verification, including debugging, dynamic and formal verification, and assertion creation.
I think that as afield matures, it goes through the following stages regarding verification:
• Trying to pay little attention to it, in an effort to“get things done”; • Then, when bugs start piling up, looking into debugging techniques; • Then, starting to look into more systematic ways offinding new bugs; • Andfinally,finding a good balance of advanced techniques, such as
coverage-driven dynamic verification, improved assertions, and formal verification.
The area of HW verification (and HW/SW co-verification), where I had the pleasure of working with Markus, offers an interesting perspective: It has gone through all these stages years ago, but it was never easy to see the full path ahead. Consider just the dynamic-verification slice of that history: Initially, no one could predict how important bugs (and thus verification) would be. It took several chip-project failures (I personally witnessed one, first hand) to understand that verification was going to be a big part of our future forever. Then, more random testing was used. That helped, but not enough, so advanced, constrained-random, massive test generation was invented. Then, it became clear that functional cov-erage (not just code covcov-erage) was needed, to make sense of all the resulting runs and see which covered what.
It then dawned on everybody that this new coverage-driven verification needed its own professionals, and thus“verification engineer”as a job description came to be. Then, as CDV started producing more failing runs than engineers could debug, emphasis again shifted to advanced debug tools and so on. All of this looks rea-sonable in hindsight, but was not so obvious on day one.
Contents
1 An Overview About Debugging and Verification Techniques
for Embedded Software . . . 1
Djones Lettnin and Markus Winterholer 1.1 The Importance of Debugging and Verification Processes. . . 1
1.2 Debugging and Verification Platforms . . . 4
1.2.1 OS Simulation. . . 4
1.2.2 Virtual Platform . . . 5
1.2.3 RTL Simulation . . . 5
1.2.4 Acceleration/Emulation . . . 5
1.2.5 FPGA Prototyping . . . 6
1.2.6 Prototyping Board . . . 6
1.2.7 Choosing the Right Platform for Software Development and Debugging . . . 7
1.3 Debugging Methodologies . . . 7
1.3.1 Interactive Debugging . . . 8
1.3.2 Post-Process Debugging . . . 8
1.3.3 Choosing the Right Debugging Methodology . . . 10
1.4 Verification Methodologies . . . 10
1.4.1 Verification Planning . . . 10
1.4.2 Verification Environment Development . . . 11
1.5 Summary . . . 14
References. . . 15
2 Embedded Software Debug in Simulation and Emulation Environments for Interface IP. . . 19
Cyprian Wronka and Jan Kotas 2.1 Firmware Debug Methods Overview . . . 19
2.2 Firmware Debuggability . . . 22
2.3 Test-Driven Firmware Development for Interface IP . . . 24
2.3.1 Starting Development. . . 24
Software Debugger . . . 38
2.5.1 Example. . . 39
2.5.2 Coverage Measurement . . . 42
2.5.3 Drawbacks . . . 44
2.6 Conclusions . . . 44
References . . . 45
3 The Use of Dynamic Temporal Assertions for Debugging. . . 47
Ziad A. Al-Sharif, Clinton L. Jeffery and Mahmoud H. Said 3.1 Introduction . . . 47
3.1.1 DTA Assertions Versus Ordinary Assertions . . . 48
3.1.2 DTA Assertions Versus Conditional Breakpoints . . . 50
3.2 Debugging with DTA Assertions . . . 50
3.3 Design . . . 51
3.3.1 Past-Time DTA Assertions . . . 53
3.3.2 Future-Time DTA Assertions . . . 53
3.3.3 All-Time DTA Assertions . . . 54
3.4 Assertion’s Evaluation . . . 54
3.4.1 Temporal Cycles and Limits. . . 56
3.4.2 Evaluation Log . . . 57
3.4.3 DTA Assertions and Atomic Agents . . . 57
3.5 Implementation. . . 59
3.6 Evaluation. . . 60
3.6.1 Performance . . . 61
3.7 Challenges and Future Work . . . 62
3.8 Conclusion . . . 63
References. . . 64
4 Automated Reproduction and Analysis of Bugs in Embedded Software. . . 67
Hanno Eichelberger, Thomas Kropf, Jürgen Ruf and Wolfgang Rosenstiel 4.1 Introduction . . . 67
4.3 Debugger-Based Bug Reproduction. . . 70
6.6 Architecture of the Monitoring Module . . . 152
6.7 Experiments and Results . . . 153
6.8 Conclusions . . . 156
6.8.1 Future Works . . . 156
References . . . 157
7 Model Checking Embedded C Software Usingk-Induction and Invariants . . . 159
Herbert Rocha, Hussama Ismail, Lucas Cordeiro and Raimundo Barreto 7.1 Introduction . . . 159
7.2 Motivating Example . . . 161
7.3 Induction-Based Verification of C Programs Using Invariants. . . . 162
7.3.1 The Proposedk-Induction Algorithm . . . 162
7.3.2 Running Example. . . 167
7.4 Experimental Evaluation . . . 172
7.4.1 Experimental Setup . . . 172
7.4.2 Experimental Results . . . 173
7.5 Related Work . . . 179
7.6 Conclusions . . . 180
References . . . 181
8 Scalable and Optimized Hybrid Verification of Embedded Software . . . 183
Jörg Behrend, Djones Lettnin, Alexander Grünhage, Jürgen Ruf, Thomas Kropf and Wolfgang Rosenstiel 8.1 Introduction . . . 183
8.2 Related Work. . . 184
8.2.1 Contributions . . . 186
8.3 VERIFYR Verification Methodology . . . 186
8.3.1 SPA Heuristic. . . 189
8.3.2 Preprocessing Phase . . . 191
8.3.4 Coverage . . . 195
8.3.5 Technical Details . . . 195
8.4 Results and Discussion . . . 197
8.4.1 Testing Environment . . . 197
8.4.2 Motorola Powerstone Benchmark Suite . . . 197
8.4.3 Verification Results Using VERIFYR . . . 199
8.4.4 EEPROM Emulation Software from NEC Electronics . . . . 200
8.5 Conclusion and Future Work. . . 203
References . . . 203
Ziad A. Al-Sharif Software Engineering Department, Jordan University of Science and Technology, Irbid, Jordan
Raimundo Barreto Federal University of Amazonas, Manaus, Brazil
Edna Barros CIn - Informatics Center, UFPE—Federal University of Pernambuco, Recife, Brazil
Jörg Behrend Department of Computer Engineering, University of Tübingen, Tübingen, Germany
Lucas Cordeiro Federal University of Amazonas, Manaus, Brazil Hanno Eichelberger University of Tübingen, Tübingen, Germany
Alexander Grünhage Department of Computer Engineering, University of Tübingen, Tübingen, Germany
Hussama Ismail Federal University of Amazonas, Manaus, Brazil
Padma Iyenghar Software Engineering Research Group, University of Osnabrueck, Osnabrück, Germany
Clinton L. Jeffery Computer Science Department, University of Idaho, Moscow, ID, USA
Jan Kotas Cadence® Design Systems, Katowice, Poland
Thomas Kropf Department of Computer Engineering, University of Tübingen, Tübingen, Germany
Djones Lettnin Department of Electrical and Electronic Engineering, Federal University of Santa Catarina, Trindade, Florianópolis, SC, Brazil
Rafael Melo Macieira CIn - Informatics Center, UFPE—Federal University of Pernambuco, Recife, Brazil
Elke Pulvermueller Software Engineering Research Group, University of Osnabrueck, Osnabrück, Germany
Herbert Rocha Federal University of Roraima, Boa Vista, Brazil
Wolfgang Rosenstiel Department of Computer Engineering, University of Tübingen, Tübingen, Germany
Jürgen Ruf Department of Computer Engineering, University of Tübingen, Tübingen, Germany
Mahmoud H. Said Software Engineering Department, Jordan University of Science and Technology, Irbid, Jordan
Michael Uelschen University of Applied Sciences, Osnabrück, Germany Clemens Westerkamp University of Applied Sciences, Osnabrück, Germany Markus Winterholer swissverified.com, Lucerne, Switzerland
Cyprian Wronka Cadence® Design Systems, San Jose, CA, USA
1.1
The Importance of Debugging and Verification
Processes
Embedded systems (ES) have frequently been used over the last years in the electronic systems industry due to their flexible operation and possibility of future expansions. Embedded systems are composed of hardware, software, and other modules (e.g., mechanics) designed to perform a specific task as part of a larger system. Important further concepts such as Cyber-Physical Systems (CPS) and Internet of Things (IoT) consider also different aspects of ES. In CPS, computation and physical processes are integrated considering physical quantities such as timing, energy, and size [4]. In IoT, physical objects are seamlessly integrated into the information network [47]. Taking everything into account, internal control of vehicles, autopilot, telecommunication products, electrical appliances, mobile devices, robot control, and medical devices are some of the practical examples of embedded systems.
Over the last years, the amount of software used in embedded electronic products has been increasing and the tendency is that this evolution continues in the future. Almost 90% of the microprocessors developed worldwide have been applied in embedded systems products [52], since the embedded software (ESW) is the main responsible for functional innovations, for instance, in the automotive area with the reduction of gas emissions or with the improvement of security and comfort [45].
The embedded software is also frequently used in safety critical applications (e.g., automotive) where failures are unacceptable [21], as seen in lists of disasters
D. Lettnin (
B
)Department of Electrical and Electronic Engineering, Federal University of Santa Catarina, Florianópolis, Brazil
e-mail: [email protected]
M. Winterholer
swissverified.com, Lucerne, Switzerland e-mail: [email protected]
© Springer Science+Business Media, LLC 2017
D. Lettnin and M. Winterholer (eds.),Embedded Software Verification and Debugging, Embedded Systems, DOI 10.1007/978-1-4614-2266-2_1
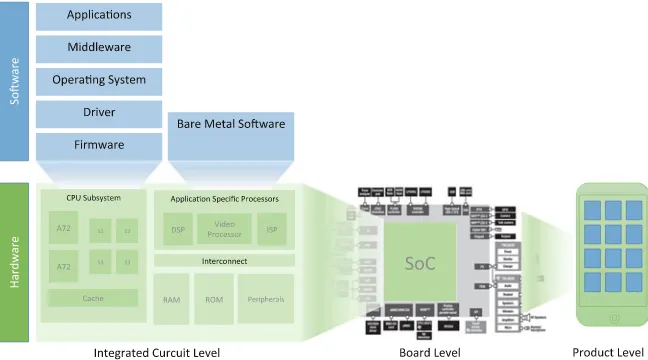
Fig. 1.1 Example a SoC into a system
and inconveniences occurred due to software errors [26,32]. The main challenge of verification and debugging processes is to handle the system complexity. For instance, the automotive embedded software of a car achieved up to 1 GB by 2010 [61]. As it can be observed in Fig.1.1, embedded software is being applied with different views in modern SoCs, going from application software (e.g., apps, middleware, operating system, drivers, firmware) distributed among many processor cores, as well as, hardware-dependent (i.e., bare metal) software and finally, covering the communication software stacks.
The electronic system level (ESL) design and verification consider usually a com-bination of bottom-up and top-down approaches [63]. It meets the system-level objec-tives by exploiting the synergism of hardware and software through their concurrent design. Therefore, the development of software needs start earlier (in parallel) to the SoC design, integration‘, and verification, as depicted in Fig.1.2. During the pre-silicon phase, it is time to remove critical bugs in system environment. In this phase, the SW is becoming more and more a requirement to tape out, since it may hold the fabrication if a bug is too critical. After the production, the development of SW can be continued on-chip and the post-silicon validation will be performed.
SoC
Sub-System
IP
Hardware
Time SoC / Sub-System Integration and Verification
Gate-level Validation
IP Design and Verification
Fig. 1.2 System development. Adapted from [37]
Fig. 1.3 Software and verification driving SoC project costs [37]
agreement that the functional errors must be corrected before the device is released to the market. Supplying companies of both hardware and software intellectual prop-erty (IP1) modules are examples of enterprises that demand high level of correctness, since they need to assure that their IP cores will work correctly when inserted in a target project [33].
This chapter introduces debugging/verification platforms and methodologies and gives an overview about the scope and organization of this book.
1.2
Debugging and Verification Platforms
Debugging and Verification Platforms can be defined as a standard for the hardware of a computer system, deciding what kinds of debugging and verification processes can be performed. Basically, we can divide the platforms in two categories: Pre- and Post-Silicon. In the pre-silicon platforms, the designs are debugged and verified using virtual environment with sophisticated simulation and formal verification tools. In distinction to post-silicon platforms where real devices are used running on target boards with logic analyzer and assertion-based tools.
1.2.1
OS Simulation
The operating systems of smart devices (e.g., smartphones) allow the developers to create thousands of additional programs with several utilities, such as, to store personal data of the users. In order to develop these applications (i.e., apps), each platform has its strengths, weaknesses, and challenges.
Gronli et al. [36] compare the main mobile OS platforms in several different categories, such as software architecture, application development, platform capa-bilities and constraints, and, finally, developer support. The compared OS platforms considers: (1) Android, a Linux-based operating system from Google; (2) The Win-dows Phone operating system from Microsoft; (3) The iOS platform from Apple; and one platform representing a new generation: (4) The new web-based Firefox OS from Mozilla. All evaluated platforms presented from good to excellent interactive debugging options.
1Intellectual property cores are design modules of both hardware or software units used as building
Initiative (OSCI), transaction-level modeling (TLM), [7] standard and the IEEE-1666 SystemC standard [58].
In addition to early software development, virtual prototyping can be used for software distribution, system development kits and customer demos. In post-RTL software development, for example, virtual prototyping can be used as a low-cost replacement for silicon reference boards distributed by semiconductor companies to software developers in systems companies. Compared to reference boards, virtual prototyping provides much better debug capabilities and iteration time, and therefore can accelerate the post-silicon system integration process [6].
1.2.3
RTL Simulation
Hardware-dependent software requires a simulator or a target platform to be tested. Register Transfer Level (RTL) simulation is the most widely used method to validate the correctness of digital IC designs. They are better suited to test software with hard-ware dependencies (e.g., assembly code) and that requires timing accuracy. However, when simulating a large IC designs with complicated internal behaviors (e.g., CPU cores running embedded software), RTL simulation can be extremely time consum-ing. Since RTL-to-layout is still the most prevalent IC design methodology, it is essential to speedup the RTL simulation process. Recently, General Purpose com-puting on Graphics Processing Units (GPGPU) is becoming a promising paradigm to accelerate computing-intensive workloads [62].
1.2.4
Acceleration/Emulation
When excessive simulation time becomes a bottleneck for dynamic verification, hardware emulation and simulation acceleration are often used. Hardware emulators provide a debugging environment with many features that can be found in logic sim-ulators, and in some cases even surpass their debugging capabilities, such as setting breakpoints and visibility of content or sign in memory design. For the Assertion-based Verification (ABV) methodology to be used in hardware emulation, assertions must be supported in hardware [12]. Traditional emulators are based on reconfig-urable logic and FPGAs. To increase flexibility and to ease the debugging process, which requires the ability to instrument assertions, current-generation emulators and simulation accelerators are typically based on an array of processing elements, such as in Cadence Palladium [15]. Another approach, is to integrate the debug and com-munication module inside the chip such as an on-chip in-circuit emulation (ICE) architecture for debugging [75]. However, due to its high cost, emulators are expen-sive for many developers.
1.2.5
FPGA Prototyping
During the last years, Commercial-Off-The-Shelf (COTS) FPGAs provide process-ing capability fulfillprocess-ing the demand required by the increasprocess-ing instruments resolution and measurement speeds, even with low power budget [55]. Furthermore, partial dynamic reconfiguration permits changing or adapting payload processing during operation.
FPGA technology is commonly used to prototype new digital designs before entering fabrication. Whilst these physical prototypes can operate many orders of magnitude faster than through a logic simulator, a fundamental limitation is their lack of on-chip visibility when debugging. In [41] a trace-buffer-based instrumenta-tion was installed into the prototype, allowing designers to capture a predetermined window of signal data during live operation for offline analysis. However, instead of requiring the designer to recompile their entire circuit every time the window is mod-ified, it was proposed that an overlay network is constructed using only spare FPGA routing multiplexers to connect all circuit signals through to the trace instruments. Thus, during debugging, designers would only need to reconfigure this network instead of finding a new place-and-route solution.
1.2.6
Prototyping Board
flow
•Ignore hardware •Before RTL •Great to debug
Fig. 1.4 Strength and weakness of each platform [44]
the least, time-to-market is a major concern when complex post-silicon bugs surface, and it takes time to find the root cause and the fix of the issue [5].
Post-silicon introspection techniques have emerged as a powerful tool to combat increased correctness, reliability, and yield concerns. Previous efforts using post-silicon introspection include online bug detection, multiprocessor cache-coherence validation, online defect detection. In [22] an Access-Control Extensions (ACE) was proposed that can access and control a microprocessor’s internal state. Using ACE technology, special firmware can periodically probe the microprocessor during execution to locate run-time faults, repair design errors.
1.2.7
Choosing the Right Platform for Software Development
and Debugging
As it could be observed in the previous sections, there is no “one fits all” approach. Each platform has strength and weakness, as can be summarized in Fig.1.4.
1.3
Debugging Methodologies
Table 1.1 SW Category versus debugging method and platform
SW Type SW category Debug method Platforms
Bare metal Boot ROM (all SoCs) Post-process (HW/SW)
Bare metal HW bring-up tests (all SoCs)
Post-process (HW/SW)
RTL Sim, emulation
OS—OS-based SoC OS bring-up kernel and drivers
Post-process (HW/SW)
Emulation
OS—OS-based SoC OS bring-up kernel and drivers(OS-based SoC)
One popular debug approach that overcomes the observability problem is the so-called interactive (or run/stop) technique, which stops an execution of the SoC before its state is inspected in detail. An advantage of this technique is that we can inspect the SoC’s full state without running into the device pins’ speed limitations. It also requires only a small amount of additional debug logic in the SoC. The main disadvantage of interactive debug is that the technique is intrusive, since the SoC must be stopped prior to observing its state [71].
The most primitive forms of debugging are the printing of messages on the stan-dard output (e.g.,printf of C language) and the usage of debugging applications (e.g., gdb). If the embedded software is being tested on a hardware engine,JTAG2 inter-faces should be used to acquire debugging information [2]. As example of industrial debug solutions are: Synopsys System-Level Catalyst [46,69] with focus on virtual platforms and FPGA prototypes debugging; SVEN and OMAR focuses on software and hardware technologies increasing silicon and software debug facilities [13].
1.3.2
Post-Process Debugging
The Post-Process Debugging runs simulation in batch mode, record data to a wave-form database, and then analyze the results after simulation is complete. This latter
2JTAG (Joint Test Action Group) is a hardware interface based on the IEEE 1149.1 standard and
V
HW accuracy Good Poor Good Good for traced
use model presents challenges when trying to post-process results when the DUT is being driven by a class-based verification environment, such as the Open Verification Methodology (OVM) or Universal Verification Methodology (UVM) [18].
The Incisive Debug Analyzer (IDA) [16] provides functionality of an interactive debug flow plus the advantage of debugging in post-process mode, allowing all the debug data files running the simulation once.
1.3.3
Choosing the Right Debugging Methodology
Table1.1 correlates the SW category and the debugging methods as well as the debugging platforms.
As it could be observed in the previous sections, both debugging methods have their strength and weakness, as can be summarized in Table1.2.
1.4
Verification Methodologies
1.4.1
Verification Planning
Verification planning is a methodology that defines how to measure variables, scenar-ios, and features. Additionally, it documents how verification results are measured considering, for instance, simulation coverage, directed tests, and formal analysis. It also provides a framework to reach consensus and to define verification closure for a design. An example of verification planning tool is the Enterprise Planner [17], which allows to create, edit, and maintain verification plans, either starting from scratch, or by linking and tracking the functional specifications.
1.4.2.1 Dynamic Verification
The dynamic verification focuses on testing, co-verification, and assertion-based ver-ification approaches. Dynamic verver-ification for hardware-independent software can be tested directly on a host machine. On the other hand, hardware-dependent software requires a simulator or a target platform. If the embedded software demands high performance (e.g., operating system booting, video processing applications) a hard-ware engine (e.g., in-circuit-emulator, simulation accelerator, or rapid prototyping) can be used to increase performance. The main advantage of dynamic verification is that the whole system can be used in the verification in order to test more deeply into the system state space.
Testing
Testing is an empirical approach that intent to execute the software design in order to identify any design errors [8]. If the embedded software does not work, it should be modified in order to get it work. Scripting languages are used for writing different test scenarios (e.g., functions with different parameter values or different function call sequences). The main testing methodologies and techniques are listed in the following [67,74]:
Metric-driven Hardware/Software Co-verification
Metric-driven verification is the use of a verification plan and coverage metrics to organize and manage the verification project, and optimize daily activities to reach verification closure. Testbenches are designed in order to drive inputs into hardware/software modules and to monitor internal states (white box verification3) or the output results (black box verification4) of the design. Executing regression suites produces a list of failing runs that typically represent bugs in the system to resolve, and coverage provides a measure of verification completion. Bugs are iteratively fixed, but the unique process of metric-driven verification is the use of
3White box verification focus on knowledge of a system’s internal structure [8].
4Black box verification focus on the functional behavior of the system, without explicit knowledge
coverage charts and coverage hole analysis to aid verification closure. Analyzing coverage holes provides insight into system scenarios that have not been generated, enabling the verification team to make adjustments to the verification environment to achieve more functional coverage [14].
As an example, coverage driven verification has been successfully used in the hardware area with the elanguage. Recently, it has been extended to embedded software through the Incisive Software extensions (ISX) [73].
Assertion-Based Verification
Assertion-based verification methodology captures a design’s intended behavior in temporal properties and monitors the properties during system simulation [30]. After the specification of system requirement, the informal specification is cast into tem-poral properties that capture the design intent. This formalization of the requirements already improves the understanding of the new system. This methodology has been successfully used at lower levels of hardware designs, specially at register transfer level (RTL), which requires a clock mechanism as timing reference and signals at the Boolean level [30]. Thus, it is not suitable to apply this hardware verification technique directly to embedded software, which has no timing reference and con-tains more complex structures (e.g., integers, pointers, etc.). Thus, new mechanisms are used in order to apply assertion-based methodology with embedded software [50,51].
1.4.2.2 Static Verification
Static verification performs analysis without the execution of the program. The analy-sis is performed on source or on object code. Static verification of embedded software focuses mainly on abstract static analysis, model checking and theorem proving.
Static Analysis
Static analysis has been widely used in the optimization of compiler design (e.g., pointer analysis). In the software verification, static analysis has been used for high-lighting possible coding errors (e.g., linting tools) or formal static analysis in order to verify invariant properties, such as division-by-zero, array bounds, and type casting [25,53]. This approach has been also used for the analysis of worst case execution time (WCET) and of stack/heap memory consumption [1].
with symbolic model checkers [60]. The symbolic model checking is based on binary decision diagrams (BDD) [54] or on Boolean satisfiability (SAT) [31] and it has been applied in the formal verification process. However, each approach has its own strengths and weaknesses [59].
Formal verification can handle up to medium-sized software systems, where they have less state space to explore. For larger software designs, formal verification using model checking often suffers from the state space explosion problem. Therefore, abstraction techniques are applied in order to alleviate the burden for the back-end model checkers.
The commonly software model checking approaches are as follows:
• Convert the C program to a model and feed it into a model checker [43].
This approach models the semantics of programs as finite state systems by using suitable abstractions. These abstract models are verified using both BDD-based and SAT-based model checkers.
• Bounded Model Checking (BMC) [19].
This approach unwinds the loops in the embedded software and the resulting clause formula is applied to a SAT-based model checker.
Each approach has its own strengths and weaknesses and a detailed survey on software model checking approaches is made in [29].
The main weaknesses of current model checking approaches are still the model-ing of suitable abstraction models and the state space explosion for large industrial embedded software.
Theorem Proving
1.4.2.3 Hybrid Verification
The combination of verification techniques is an interesting approach in order to over-come the drawbacks of the isolated dynamic and static aforementioned verification approaches.
The main hybrid verification approach for the verification of embedded software has been focused on combining model checking and theorem proving, such as satis-fiability modulo theories (SMT) [66] and predicate abstraction approaches.
SMT combines theories (e.g., linear inequality theory, array theory, list structure theory, bit vector theory) expressed in classical first-order logic in order to determine if a formula is satisfiable. The predicate symbols in the formula may have additional interpretations that are classified according to the theory that they belong to. In this sense, SMT has the advantage that a problem does not have to be translated to Boolean level (like in SAT solving) and can be handled on word level. For instance, SMT-based BMC has been used in the verification of multi-threaded software allowing the state space to be reduced by abstracting the number of state variables and interleavings from the proof of unsatisfiability generated by the SMT solvers [23].
Model checking with predicate abstraction using a theorem prover [11] or a SAT-solver [20] checks software based on anabstract-check-refineparadigm. It constructs an abstract model based on predicates and then checks the safety property. If the check fails, it refines the model and iterates the whole process.
The combination of dynamic and static verification has been explored in the hardware verification domain [28, 34, 35,38, 39, 56, 57,64, 65, 70]. Basically, simulation is used to reach “interesting” (also known as lighthouse or critical) states. From these states, the model checker can verify exhaustively a local state space for a certain number of time steps. This approach is available in the hardware commercial verification tools such as Magellan [39]. Additionally, the combination of simulation and formal verification has been applied to find bugs in the verification of hardware serial protocols, in which isolated techniques (i.e., only simulation or only formal verification) were unable to find them [34].
One way to control the embedded software complexity lies in the combination of formal methods with simulative approaches. This approach combines the benefits of going deep into the system and covers exhaustively the state space of the embedded software system. For example, assertion-based verification and formal verification based on state-of-the-art software model checkers are combined and applied to the verification of embedded software using the C language [9,48,49].
1.5
Summary
tion and bring-up.http://www.cadence.com/
7. Bailey B, McNamara M, Balarin F, Stellfox M, Mosenson G, Watanabe Y (2010) TLM-driven design and verification methodology. Cadence Des Syst
8. Bart B, Noteboom E (2002) Testing embedded software. Addison-Wesley Longman 9. Behrend J, Lettnin D, Heckeler P, Ruf J, Kropf T, Rosenstiel W (2011)Scalable hybrid
ver-ification for embedded software. In: DATE ’11: Proceedings of the conference on design, automation and test in Europe, pp 179–184
10. Berthet C (2002) Going mobile: the next horizon for multi-million gate designs in the semi-conductor industry. In: DAC ’02: Proceedings of the 39th conference on Design automation, ACM, New York, USA, pp 375–378. doi:10.1145/513918.514015
11. Beyer D, Henzinger TA, Jhala R, Majumdar R (2007) The software model checker BLAST. STTT 9(5–6):505–525
12. Boul M, Zilic Z (2008) Generating hardware assertion checkers: for hardware verification, emulation, post-fabrication debugging and on-line monitoring, 1st edn. Springer, Incorporated 13. Brouillette P (2010) Accelerating soc platform software debug with intelÕs sven and omar. In:
System, software, SoC and silicon debug S4D conference 2010
14. Brown S (2011) Hardware/software verification with incisive software extensions.http://www. cadence.com/
15. Cadence design systems: cadence palladium.http://www.cadence.com 16. Cadence design systems: incisive debug analyzer.http://www.cadence.com 17. Cadence design systems: incisive management.http://www.cadence.com
18. Cadence design systems: post-processing your ovm/uvm simulation results. http://www. cadence.com
19. Clarke E, Kroening D, Lerda F (2004) A tool for checking ANSI-C programs. In: Jensen K, Podelski A (eds) TACAS: tools and algorithms for the construction and analysis of systems (TACAS 2004), Lecture notes in computer science, vol 2988. Springer, pp 168–176 20. Clarke E, Kroening D, Sharygina N, Yorav K (2005) SATABS: SAT-based predicate abstraction
for ANSI-C. In: TACAS:Tools and Algorithms for the Construction and Analysis of Systems (TACAS 2005), Lecture notes in computer science, vol 3440, pp 570–574. Springer 21. Clarke EM, Grumberg O, Peled DA (1999) Model checking. The MIT Press
22. Constantinides K, Austin T (2010) Using introspective software-based testing for post-silicon debug and repair. In: Design automation conference (DAC), 2010 47th ACM/IEEE, pp 537–542 23. Cordeiro L (2010) Smt-based bounded model checking for multi-threaded software in embed-ded systems. In: Proceedings of the 32nd ACM/IEEE international conference on software engineering-volume 2, ICSE 2010, Cape Town, South Africa, 1–8 May 2010, pp 373–376 24. Cousot P, Cousot R (1977) Abstract interpretation: a unified lattice model for static analysis of
programs by construction or approximation of fixpoints. In: Conference record of the fourth annual ACM SIGPLAN-SIGACT symposium on principles of programming languages, ACM Press, New York, pp 238–252
25. Coverity: Coverity static analysis verification engine (coverity save).http://www.coverity.com/ products/coverity-save/
27. Detlefs D, Nelson G, Saxe JB (2003) Simplify: a theorem prover for program checking. Tech Rep J ACM
28. Dill DL, Tasiran S (1999) Formal verification meets simulation. In: ICCAD ’99: Proceed-ings of the 1999 IEEE/ACM international conference on Computer-aided design, IEEE Press, Piscataway, NJ, USA. Chairman-Ellen M. Sentovich, p 221
29. D’Silva V, Kroening D, Weissenbacher G (2008) A survey of automated techniques for formal software verification. TCAD: IEEE Trans Comput Aided Des Integr Circ Syst 27(7):1165– 1178. doi:10.1109/TCAD.2008.923410
30. Foster HC, Krolnik AC, Lacey DJ (2004) Assertion-based design. Springer 31. Ganai M, Gupta A (2007) SAT-based scalable formal verification solutions. Springer 32. Ganssle J (2006) Total recall.http://www.embedded.com/
33. Goldstein H (2002) Checking the play in plug-and-play. IEEE Spectr 39:50–55
34. Gorai S, Biswas S, Bhatia L, Tiwari P, Mitra RS (2006) Directed-simulation assisted formal verification of serial protocol and bridge. In: DAC ’06: proceedings of the 43rd annual confer-ence on Design automation, ACM Press, New York, USA, pp 731–736. doi:10.1145/1146909. 1147096
35. Gott RM, Baumgartner JR, Roessler P, Joe SI (2005) Functional formal verification on designs of pseries microprocessors and communication subsystems. IBM J. 49(4/5):565–580 36. Grønli TM, Hansen J, Ghinea G, Younas M (2014) Mobile application platform heterogeneity:
Android vs windows phone vs ios vs firefox os. In: Proceedings of the 2014 IEEE 28th inter-national conference on advanced information networking and applications, AINA ’14, IEEE Computer Society, Washington, DC, USA, pp 635–641. doi:10.1109/AINA.2014.78 37. Hanna Z (2014) Challenging problems in industrial formal verification. In: Proceedings of
the 14th conference on formal methods in computer-aided design, FMCAD ’14, FMCAD Inc, Austin, TX. pp 1:1–1:1.http://dl.acm.org/citation.cfm?id=2682923.2682925
38. Hazelhurst S, Weissberg O, Kamhi G, Fix L (2002) A hybrid verification approach: getting deep into the design
39. Ho PH, Shiple T, Harer K, Kukula J, Damiano R, Bertacco V, Taylor J, Long J (2000) Smart simulation using collaborative formal and simulation engines. ICCAD 00:120. doi:10.1109/ ICCAD.2000.896461
40. Holzmann GJ (2004) The spin model checker: primer and reference manual. Addison-Wesley 41. Hung E, Wilton SJE (2014) Accelerating fpga debug: increasing visibility using a runtime reconfigurable observation and triggering network. ACM Trans. Des. Autom. Electron. Syst. 19(2), 14:1–14:23. doi:10.1145/2566668
42. ITRS: International technology roadmap for semiconductors (2007).http://www.itrs.net/ 43. Ivanicic F, Shlyakhter I, Gupta A, Ganai MK (2005) Model checking C programs using
F-SOFT. In: ICCD ’05: proceedings of the 2005 international conference on computer design, IEEE Computer Society, Washington, DC, USA, pp 297–308. doi:10.1109/ICCD.2005.77 44. Kevan T, Managing complexity with hardware emulation.http://electronics360.globalspec.
com/article/4336/managing-complexity-with-hardware-emulation
45. Kropf T (2007) Software bugs seen from an industrial perspective or can formal method help on automotive software development?
46. Lauterbach S, Trace32.http://www.lauterbach.com/
47. Lee EA (2007) computing foundations and practice for cyber-physical systems: a preliminary report. Tech Rep UCB/EECS-2007-72
48. Lettnin D (2010) Verification of temporal properties in embedded software: based on assertion and semiformal verification approaches. Suedwestdeutscher Verlag fuer Hochschulschriften 49. Lettnin D, Nalla PK, Behrend J, Ruf J, Gerlach J, Kropf T, Rosenstiel W, Schönknecht V,
Reitemeyer S (2009) Semiformal verification of temporal properties in automotive hardware dependent software. In: DATE ’09: proceedings of the conference on design, automation and test in Europe
56. Mony H, Baumgartner J, Paruthi V, Kanzelman R, Kuehlmann A (2004) Scalable auto-mated verification via expert-system guided transformations. http://citeseer.ist.psu.edu/ mony04scalable.html
57. Nanshi K, Somenzi F (2006) Guiding simulation with increasingly refined abstract traces. In: DAC ’06: Proceedings of the 43rd annual conference on design automation, ACM Press, NY, USA, pp 737–742. doi:10.1145/1146909.1147097
58. (OSCI), O.S.I.: IEEE 1666 standard systemc language reference manual (LRM) (2005) 59. Parthasarathy G, Iyer MK, Cheng KT (2003) A comparison of BDDs, BMC, and sequential SAT
for model checking. In: HLDVT ’03: Proceedings of the eighth IEEE international workshop on high-level design validation and test workshop, IEEE Computer Society, Washington, DC, USA, p 157
60. Peled D (2002) Comparing symbolic and explicit model checking of a software system. In: In Proceedings of SPin workshop on model checking of software, vol 2318. LNCS, Springer, pp 230–239
61. Pretschner A, Broy M, Kruger IH, Stauner T (2007) Software engineering for automotive systems: a roadmap. In: FOSE ’07: 2007 future of software engineering, IEEE Computer Society, Washington, DC, USA, pp 55–71. doi:10.1109/FOSE.2007.22
62. Qian H, Deng Y (2011) Accelerating rtl simulation with gpus. In: IEEE/ACM international conference on computer-aided design (ICCAD), 2011, pp 687–693. doi:10.1109/ICCAD.2011. 6105404
63. Rigo S, Azevedo R, Santos L (2011) Electronic system level design: an open-source approach. Springer
64. Ruf J, Kropf T (2002) Combination of simulation and formal verification. In: Proceedings of GI/ITG/GMM-workshop Methoden und Beschreibungssprachen zur Modellierung und Veri-fikation von Schaltungen und Systemen. Shaker Verlag
65. Shyam S, Bertacco V (2006) Distance-guided hybrid verification with GUIDO. In: DATE ’06: Proceedings of the conference on design, automation and test in Europe, European design and automation association, 3001 Leuven, Belgium, pp 1211–1216
66. SMT-Exec: Satisfiability modulo theories execution service.http://www.smtcomp.org/ 67. Spillner A, Linz T, Schaefer H (2006) Software testing foundations: a study guide for the
certified tester exam. O’Reilly media
68. Strategies IB, Software verification and development cost.http://www.ibs-inc.net 69. Synopsys: synopsys system-level catalyst.http://www.synopsys.com/
70. Tasiran S, Yu Y, Batson B (2004) Linking simulation with formal verification at a higher level. IEEE Des. Test 21(6):472–482. doi:10.1109/MDT.2004.94
71. Vermeulen B, Goossens K (2011) Interactive debug of socs with multiple clocks. Des Test Comput IEEE 28(3):44–51. doi:10.1109/MDT.2011.42
73. Winterholer M (2006) Transaction-based hardware software co-verification. In: FDL’06: Pro-ceedings of the conference on forum on specification and design languages
74. Zeller A (2005) Why programs fail: a guide to systematic debugging. Morgan Kaufmann 75. Zhao M, Liu Z, Liang Z, Zhou D (2009) An on-chip in-circuit emulation architecture for
Present EDA environments [1, 2] provide various methods for firmware debug. Typically one can use one of the following:
• Simulation with a SystemC model of the hardware. This allows for a very early start of firmware development without any access to hardware and allows to test the functionality of the code assuming the model is accurate. The main limitations are lack of system view and (depending on the model accuracy) lack of hardware timing accuracy (behavioral models).
• Hardware simulation with firmware executing natively on the simulator CPU. This is the simplest method incorporating the actual RTL that allows to prototype the code. It requires some SystemC wrappers to get access to registers and interrupts. It lacks the system view and therefore cannot verify the behavior of the firmware in the presence of other system elements.
• Playback (with ability to play in both directions) of a recorded system simulation session.
• Hardware simulation with a full system model. (This is a synchronous hybrid, where RTL and software are run in the same simulation process). This can be divided into:
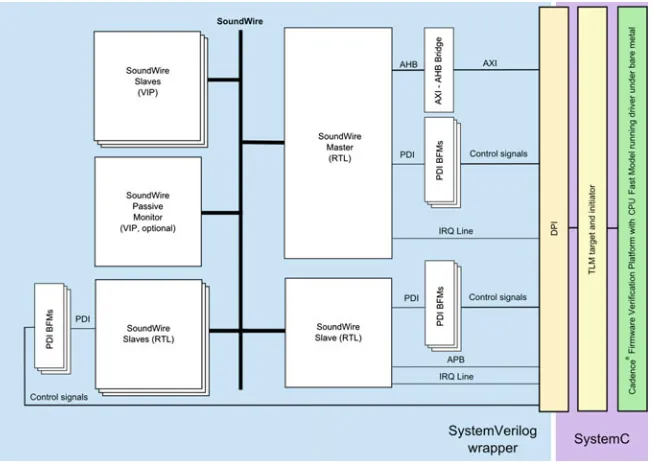
– Using a fast model of the CPU [3]—this allows very fast execution of code (e.g., Linux boot in˜1 min) but lacks cycle accuracy due to TLM to RTL translation. It also slows down significantly when the full RTL simulation starts (all clocks enabled). Example of such a system is presented in Fig.2.1.
– Using a full system RTL—this is generally very slow and only allows to test simple operations (under 10 k CPU instructions) in a reasonable time.
C. Wronka (
B
)Cadence®Design Systems, San Jose, CA, USA
e-mail: [email protected]
J. Kotas
Cadence®Design Systems, Katowice, Poland e-mail: [email protected]
© Springer Science+Business Media, LLC 2017
D. Lettnin and M. Winterholer (eds.),Embedded Software Verification and Debugging, Embedded Systems, DOI 10.1007/978-1-4614-2266-2_2
Fig. 2.1 Diagram showing a generic hybrid hardware simulation or emulation environment with a TLM part including the CPU fast model (top) and the RTL part including an interface IP core (bottom)
• Hardware emulation [4] of the full system. Again this can be divided into:
– Hybrid mode consisting of a fast model CPU and emulation RTL. In the case of interface IP it provides very fast execution, but requires good management of memory between the fast model and the emulation device to assure that the data transfers (typically data written by CPU and later sent to interface) will be efficiently emulated.NOTE: In this mode software is executing asynchronously to RTL and the two synchronize on cross domain transactions and on a set time interval. Effectively the software timing is not cycle accurate with the hardware and depending on setup would remove cache transactions and cache miss memory transactions.
– Full RTL mode where all system is cycle accurate. This is slower (Linux boot can take 10 min), however consistent performance is maintained through the emulation process. This mode allows to test the generic system use cases or replicate problems found during FPGA testing.
– Emulation with no CPU—A PCIe SpeedBridge®Adapter can be used to connect an arbitrary interface IP device to a PC and develop a driver in the PCIe space. The emulation environment allows for access to all internal signals of the IP (captured at runtime, even using a very elaborate condition-based trigger) to debug the issues (whether originating from, software, hardware or the device connected at the other end of the interface.
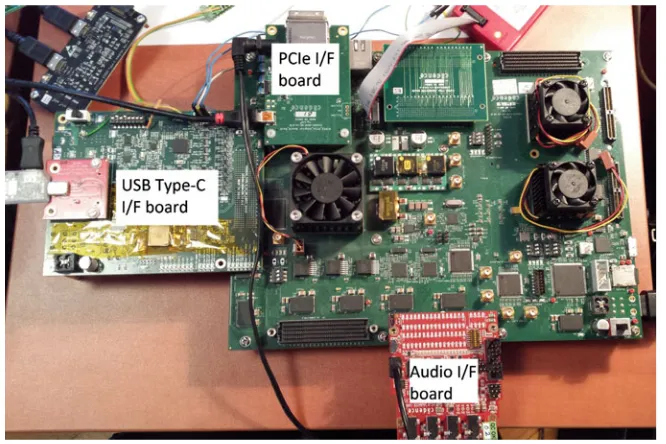
Fig. 2.3 Example Cadence® FPGA board setup used for interface IP bring-up. Please note the
number of connectors and the attached boards. This is required for testing systems consisting of multiple interface IPs connected together (also with a CPU and system memory)
These environment are not very good at bringing up new (unproven) hardware, however they are great for:
– System tests in real time or near real time – Performance tests
– Soak tests.
• Testing in silicon. This is generally considered an SoC bring-up, where all hardware issues should be ironed out, this does not prevent the fact that some tuning may still be done in firmware. The system is running at full speed and there is generally no access to the actual hardware (signals), however there should be a processor debug interface allowing to step through the code.
When debugging firmware for interface IP in simulation or emulation, it is required to connect the interface side of the IP to some entity that is compliant with the interface protocol. To achieve this one can use:
• In simulation:
– Verification IP
– Another instance of IP with the same interface
• In emulation:
– Accelerated Verification IP
– Another instance of IP with the same interface – A SpeedBridge®Adapter to connect to the real world.
2.2
Firmware Debuggability
In many cases the engineer looking after the firmware may not have been the creator of the code, and therefore it is important to provide as much information about the functionality of the code as possible.
The best practices include:
• Self-explaining register name structures or macros • Self-explaining variable names (as opposed to a, b, c, d) • Self-explaining function names
• Especially useful is information about the usage of pointers, as often firmware uses pointers to store routine addresses, it is important to provide sufficient information for a debugging engineer to be able to understand what the code is supposed to do.
There are new systems appearing currently on the market, where majority of IP driver code can be automatically generated from a higher level (behavioral) language [5]. In that case it is important to be able to regenerate the code and trace all changes back to the source (meta code) in order to propagate all debug
20 DRV_I2S_CTRL . TFIFO_RST = 0 ; 21
22 /∗ R e s e t ∗/
23 DRV_I2S_CTRL .TSYNC_RST = 1 ; 24 }
Listing 1 Example code using VayavyaLabs DPS language.
Generated code:
8 INT I2S_MC_IP_SLAVE_start_playback (void) 9 { 17 i f (GET_VALUE( varDRV_I2S_CID_CTRL ,
18 DRV_I2S_CID_CTRL_I2S_STROBE_LPOS , 19 DRV_I2S_CID_CTRL_I2S_STROBE_HPOS) == 0) 20 DRV_I2S_CTRL_ENB_UdfWr( idx , 1 ) ;
21 idx ++;
22 }
23
24 DRV_I2S_CID_CTRL_STROBE_TS_UdfWr ( 1 ) ; 25 DRV_I2S_CID_CTRL_STROBE_RS_UdfWr ( 0 ) ; 26 DRV_I2S_CTRL_TFIFO_RST_UdfWr ( 0 ) ; 27 DRV_I2S_CTRL_TSYNC_RST_UdfWr ( 1 ) ; 28
29 return Y_SUCCESS; 30 }
Using register abstraction as described above allows to detach the code from the register and filed addresses and if any register moves in the structure, the code is not affected.
2.3
Test-Driven Firmware Development for Interface IP
Working with a new piece of IP that is usually just being developed as the initial firmware is created, requites a constant closed- loop work mode in which new versions of code can be tested against new versions of RTL. A typical development flow within an interface IP firmware support team could look like this:
• Hardware team designs the IP
• Firmware engineers participate in the design to feed on the register interface design decisions
• Once a register model is designed and a first RTL implementation is in place with a functional bus connectivity, such IP can immediately be integrated into early firmware development.
One of the interesting methodologies to use in firmware development in test-driven development. This could be considered as a formalization of the hardware bring-up process, where some expectation of functionality is always well defined, and the development/bring-up aims at getting that feature enabled/supported.
The steps of test driven development are
• Design a test that fails
• Implement functionality to pass • Refine for ease of integration.
2.3.1
Starting Development
The first cycle of development is typically hardware focused. The initial test is gen-erally a register read/write operation on the address space of the IP to confirm that it has been properly integrated with the system Fig.2.6.
Fig. 2.4 Diagram showing cooperation between RTL (h/w) and C (s/w) teams to design and bring-up an IP block
• Preparation of a system-level wrapper for the new IP • Integration of that wrapper with the existing system
– Selecting base address
– Providing any control signals that are required by that IP but not available on the available slave bus interfaces
– In the case of interface IPs it is crucial to connect the actual ‘outside world’ interface of the IP (diagram) to a sensible transactor. These can be:
An instance of Verification IP
An instance of a IP core compatible with the interface.
In an ideal world such integration should be seamless as the IP comes with stan-dard bus interfaces and only requires these connected to the systems. In reality the ‘transactor’ part of the test environment can be the most laborious element of the test environment preparation. In early stages this can be delayed until first contact with IP registers has been made, but this typically is a stage that can be passed very quickly (Fig.2.4).
Once all is connected and a binary file is loaded into the system, a couple of software/hardware co-debug cycles encompassing:
• checking slave bus ports access, • checking interrupt generation
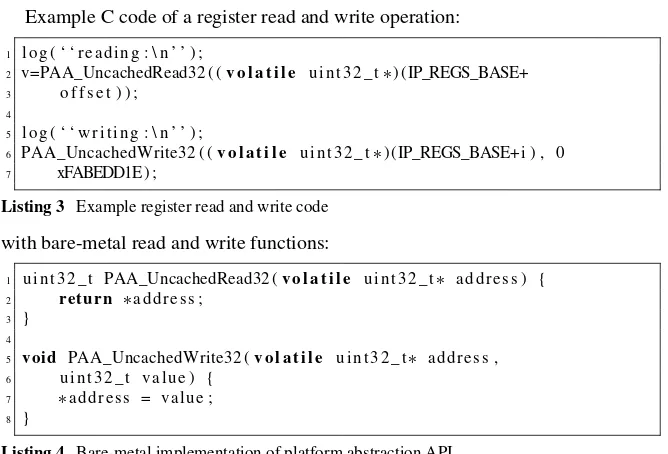
Example C code of a register read and write operation:
1 log ( ‘ ‘ r e a d i n g : \ n ’ ’ ) ;
2 v=PAA_UncachedRead32 ( (v o l a t i l e u i n t 3 2 _ t∗) (IP_REGS_BASE+ 3 o f f s e t ) ) ;
4
5 log ( ‘ ‘ w r i t i n g : \ n ’ ’ ) ;
6 PAA_UncachedWrite32 ( (v o l a t i l e u i n t 3 2 _ t∗) (IP_REGS_BASE+ i ) , 0 7 xFABEDD1E) ;
Listing 3 Example register read and write code
with bare-metal read and write functions:
1 u i n t 3 2 _ t PAA_UncachedRead32 (v o l a t i l e u i n t 3 2 _ t∗ a d d r e s s ) { 2 return ∗a d d r e s s ;
3 } 4
5 void PAA_UncachedWrite32 (v o l a t i l e u i n t 3 2 _ t∗ address , 6 u i n t 3 2 _ t v a l u e ) {
7 ∗a d d r e s s = v a l u e ; 8 }
Listing 4 Bare-metal implementation of platform abstraction API.
An example of a register read and write operation on a slave port is presented on Fig.2.6.
At this stage the firmware debug process typically starts to cross its paths with the hardware verification team. If the IP comes with a machine-readable register description (such as IP-XACT or SysRDL) again it is straightforward to automatically generate system-level test sequences that can be executed immediately on the new design with the benefit of the test code being fully driven by the register design data (Fig.2.5). This constitutes a very basic set of system sanity test cases such as:
• confirm register writable bits are writable • confirm register read only bits are read only.
These are generally covered by the hardware verification team, however the exe-cution of these in a real system allows ironing out issues with bus access and any minor register bank problems.
At this stage a firmware developer can start running any functional test cases on the IP core.
2.3.2
First Functional Tests
In a typical situation of developing a low-level driver for a certain IP there is a number of ‘key features’ that need to be supported to allow for initial system-level integration. These typically are a subset of:
• Initialize IP,
• send data over interface using register interface, • receive data over interface using register interface, • use the master bus interface/trigger a DMA,
2.3.2.1 Initializing IP
Once a verification environment is in place, one can set up a simple routine to perform the initialization of the IP and confirm that it has been performed correctly. A test to confirm that may be
• receiving an interrupt that system is ready • polling a register that system is ready
• in extreme cases it may require to peek into the actual IP signals to see that it has been intialized.
components of the system to be connected properly and there may be cases where the initialization procedure executed by the firmware in a system environment uncovers a hardware connectivity problem. These integration problems can be easily avoided by using automated IP assembly tools [6]. In these cases it is also required to have a working ‘transactor’ at the other end of the ‘external interface’ to assure that link has been established. If the transactor is another instance of IP supporting the same protocol, it is desirable to have a unit test environment, where each IP can be tested in isolation against a known model (e.g., a Verification IP instance).
2.3.2.2 Sending and Receiving Data
Once the IP is initialized and a data channel is in place, it is possible to start transmit-ting data to confirm the system connectivity. In the case of interface IP it is required to have a ‘transactor’ instance able to fulfill the communication protocol requirements to assure that the IP can complete the data transmission. Let’s consider an example of a flash memory controller. The aim of the debug step is to confirm that we can create a working code able to write a page of data in the NAND memory by sending the data word by word through the register interface. To achieve this it is important to have the following prerequisites:
• the controller is initialized • the memory is initialized
• it is required to know the protocol used by the memory controller (in the case of NAND memory it is a sequence of standardized commands (e.g., ONFI) inter-leaved with the desired data.
Let us consider an example operation where a memory page is written using register interface and later read to confirm consistency. Debugging this code in simulation, allows the following:
• stepping through the firmware code
• looking at the register interface to confirm the right data is sent to the flash controller • looking at the memory interface to confirm that the right data is sent and received
to/from the flash memory (model)
• looking at the register interface to confirm that the right data is read from the memory (model)
• accessing a memory (or having debug messages) to confirm the data integrity.
2.3.2.3 Testing the DMA
The simulation environment is a great platform to test the DMA transfers and to prototype the firmware to perform these. DMA transfers can show system problems (e.g., with memory caching) and therefore it is good to be able to see the system memory at the time of the transfer being initiated and the flow of data on the master bus interface to confirm the integrity of the data being transmitted. The diagram below shows the same memory write and read as in previous section, but this time a descriptor requesting each operation is built and after the initial trigger, the IP is expected to:
• read the descriptor
• start reading the memory (using a master bus interface) • start writing the data to the device
• finish reading memory • finish writing the data
• interrupt the processor to notify the operation has completed • perform steps similar to above, but in the other direction.
Once a single DMA has been confirmed to work, it may be required to test a chained DMA operation, in which multiple descriptors are fetched (in a sequence, potentially with partial hardware buffering) to assure the firmware is capable of creating and handling these (Fig.2.7).
Another route may be to test a multi-channel DMA where multiple chains of com-mands are created and executed by the interface IP on multiple connected devices.
2.3.2.4 Sending and Receiving Data on FPGA
The earlier defined steps (already proven in simulation) can be repeated on FPGA to bring-up the basic functionality of the hardware.
The advantage of FPGA testing is speed and for example in the case of NAND flash testing it was possible to run over 2 orders of magnitude more data (500 MB) than in simulation (16 MB). This also allowed to detect issues with the driver with handling large number of data blocks. Further, due to the fact that testing was performed on real memory it was possible to discover that the memory model used was erased by default, which was not the case for the real memory die, and required an update in the memory erase procedure (Fig.2.8).
Fig. 2.8 Enabling the interface on a QSPI IP
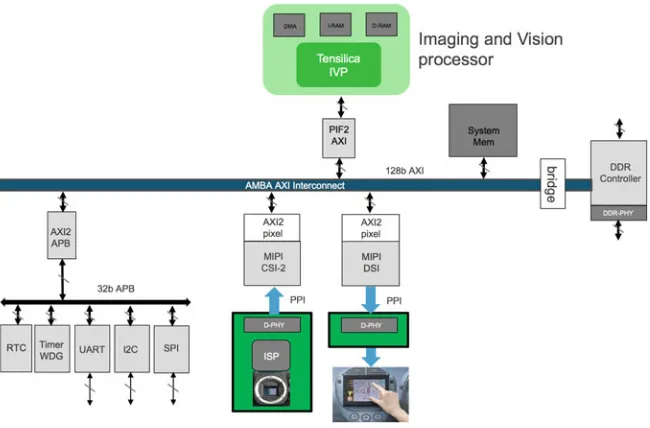
Once these steps are established one can proceed to system bring-up. In most cases such bring-up would start with some basic bare-metal tests, where multiple compo-nent would be used at the same time. For example the UART may need to be used as a debug output (or even input) while bringing up a camera interface (MIPI CSI) IP. Additionally it may be required to initialize the camera using another simple interface (e.g., I2C) while using the MIPI interface to obtain images and place them into the system memory. In that case it is important to understand the full system architecture Fig.2.9as multiple components will be interacting with each other and the CPU will be interacting with all components.
The debug steps in the example above could follow as:
• create a serial port connection for debug messages (run UART) • create an I2C connection with camera and log connection results • initialize camera and log the results
• initialize the MIPI CSI interface
• request the MIPI CSI interface to start transferring data from the camera to the system memory.
• access the memory using a debugger or dump its contents using the UART.
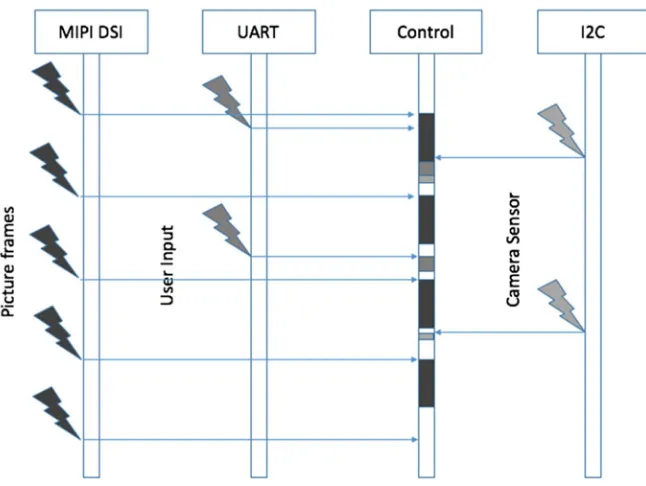
In this example, it would be desirable to have a controlled environment in which the camera would send known data that can be verified (e.g., test mode), whether the correct content has been written into the system memory. Once the system is confirmed to perform all operations in the right sequence, and the right data is copied into memory, it is also required to confirm that the data transfer is well synchronized with the rest of the system, i.e., that once the camera starts sending multiple frames per second, there is sufficient buffering and the frame data is not corrupted. This is a good opportunity to test the interrupts as multiple devices (UART, I2C, MIPI CSI) can trigger an interrupt and it is important to set up the right way of processing interrupts. Example of prioritized interrupt execution is shown in Fig.2.10.
Fig. 2.10 Diagram showing multiple devices generating interrupts at various times. The interrupt priority needs to be set appropriately to assure no interruption in streaming data and user interaction can be compromised in this case, as it is only for set-up and debug purposes
• read from memory by the display component (e.g., MIPI DSI).
Considering a VGA test image is processed in RGB mode the system will need to read 2 MB and write 2 MB of data per image. If that image is delivered at 30 fps, this is 60 MB/s read and 60 MB/s written. One has to consider that the system may need to access the memory at the same time for other purposes (e.g., logging/main-tenance/reading program or other data related to image processing. If the system is running on an FPGA it is required to assure the system architecture enables the required bandwidth. And the FPGA platform itself is an ideal vehicle to prove that this can be achieved.
Once the system is performance proven in FPGA, the scalability to ASIC speeds should be much more simple and only minor software optimizations may be required. The issues to be considered here would be:
• bus access • memory access
• memory bandwidth (bus, controller, module) • memory caching.
Lab example
“In one of our demo designs, the team was presented with an existing FPGA board where the main (and biggest) FPGA chip did not have a direct connection to the DDR memory. The DDR controller was synthesized on a separate (smaller FPGA) that could be connected to the main one using a chip2chip connection. The system described above (with camera, image processor and display) was implemented on that board and the memory bandwidth turned out to be a limiting factor in terms of image resolution and frames per second. A special design using a Xilinx Chip2 AXI construct was used to achieve best performance. This needed further optimizations both on hardware and software level. On the hardware side the important tuning factors were:
• chip2chip clock speed (and synchronous/asynchronous implementation versus the system bus)
• image processor cache size
On the software side it was important to limit memory access and assure that the image blocks (in each on the four data paths) would be sent using a ‘chained’ sequence of DMA operations to best utilize the fabric bandwidth.”
2.3.5
Interface IP Performance in a Full Featured OS Case
Another interesting example could be the Ethernet MAC implementation used as a NIC (network interface card) with a PCIe endpoint. Both cores are connected together and plugged into a PC (diagram below). There are two mirroring set-ups with:
• emulation (using a PCIe SpeedBridge® Adapter and Ethernet SpeedBridge® Adapter)
• FPGA with standard PCIe and Ethernet connectors.
Either of these implementations can be connected to a lab PC running Linux OS and a driver implemented for the interface IP as a PCIe device in Linux can be performance tested and debugged. (The same set-up is used for compliance testing).
In a particular case a feature was added to the Ethernet controller to allow offload-ing the software TCP/IP stack from performoffload-ing ‘coalescoffload-ing’ of received packets into one large packet. Support for this feature was added to the Linux driver and both implementations of the NIC platform were used to test the functionality in a system environment. The FPGA implementation was used to benchmark the CPU savings due to the offload feature and while running these a potential problem with the offloads was discovered. The following steps were used to track the problem with FPGA):
• Additional logging in the Linux driver • Enabling additional kernel logging in Linux
• Using a TCP sniffer (wireshark) to confirm data transfer.
However all these methods did not allow to find the cause of the problem, and therefore the problem needed to be replicated in an emulation environment for full understanding. Moreover, it turned out that some of the problems are inconsistent from one PC to another. After replicating the problem in an emulation environment with full access to all hardware design signals it turned out that:
• The PCIe root-port (host) may reorder packets
• Some PCIe bus parameters influence the occurrence of this issue
• Further to all these, an actual hardware issue was detected with further refinement of the test, that was not related to the PCIe bus.
controllers it is possible to receive these interrupts in embedded systems.
In the case of an embedded MSI interrupt the memory location is hijacked by the interrupt controller to generate an interrupt signal for the CPU. This has required to set the correct configuration of the bus (including protected access line) to work with the interrupt controller and allow devices on the bus to access the given memory location to generate an interrupt. An example device supporting this feature is an xHCI interface core. The Linux driver supports the MSI mode and with the full system running in the simulation environment it was possible to confirm that the IP generates MSI interrupts. After appropriate configuration of addresses, switching the xHCI core into the MSI mode and configuring the GIC to receive these messages.
2.4
Firmware Bring-up as a Hardware Verification Tool
With the current possibility to bring-up an IP quickly in a simulation/emulation in a full system environment, it is possible to use off-the-shelf system tests for early verification of newly developed IP.
This has been applied to two different cores recently in our lab setting.
2.4.1
NAND Flash
An MTD (Memory Technology Device) driver was created for a new NAND flash controller core to enable the usage of MTD-test framework in Linux to perform multiple (existing) system test on an IP that was still in development.
List of MTD tests available in the community1
• mtd_speedtest: measures and reports read/write/erase speed of the MTD device. • mtd_stresstest: performs random read/write/erase operations and validates the
MTD device I/O capabilities.
• mtd_readtest: this tests reads whole MTD device, one NAND page at a time including OOB (or 512 bytes at a time in case of flashes like NOR) and checks that reading works properly.
• mtd_pagetest: relevant only for NAND flashes, tests NAND page writing and reading in different sizes and order; this test was originally developed for testing the OneNAND driver, so it might be a little OneNAND-oriented, but must work on any NAND flash.
• mtd_oobtest: relevant only for NAND flashes, tests that the OOB area I/O works properly by writing data to different offsets and verifying it.
• mtd_subpagetest: relevant only for NAND flashes, tests I/O.
• mtd_torturetest: this test is designed to wear out flash eraseblocks. It repeat-edly writes and erases the same group of eraseblocks until an I/O error hap-pens, so be careful! The test supports a number of options (see modinfo mtd_torturetest) which allow you to set the amount of eraseblocks to tor-ture and how the torturing is done. You may limit the amount of torturing cycles using thecycles_countmodule parameter. It may be very good idea to run this test for some time and validate your flash driver and HW, providing you have a spare device. For example, we caught a rather rare and nasty DMA issues on an OMAP2 board with OneNAND flash, just by running this tests for few hours. • mtd_nandecctest: a simple test that checks correctness of the built-in software
ECC for 256 and 512-byte buffers; this test is not driver-specific, but tests general NAND support code.
This allowed finding a number of issues with the Linux driver, as it was a ready set of ‘tested tests’ so a perfect environment for driver development with a well defined acceptance criteria (passing all tests).
The MTD framework allows to run file-systems (such as JFFS2) on top of the existing stack, giving further system and stress testing capabilities.