1 Indonesian Center for Rice Research, Indonesian Agency for Agricultural Research and Development, Department of Agriculture, Sukamandi,
Subang West Java. [email protected] (* Corresponding Author)
2
Department of Agronomy dan Horticulture, Faculty of Agriculture, Bogor Agricultural University
3 Plant Breeding, Genetics, and Biotechnology Division, International Rice Research Institute (IRRI) 4 Plant Breeding, Genetics, and Biotechnology Division, IRRI.
QTL Mapping of Yield, Yield Components, and Morphological Traits in Rice (Oryza sativa L.) Using SSR Marker
Untung Susanto1*, Hajrial Aswidinnoor2, Jajah Koswara2, Asep Setiawan2, Vitaliano Lopena3, Lina Torizo3 dan Virk S. Parminder4
Diterima 20 Agustus 2008/Disetujui 25 November 2008
ABSTRACT
The experiment was aimed at identifying QTL (quantitative trait loci) controlling ten traits of yield, yield component and plant morphology of rice based on BC1F1 of IR75862-206-2-8-3-B-B-B//IR64 mapping population
consisted of 115 plants. It was arranged in Completely Randomized Design with three replicates. Ninety three SSR markers spread across the twelve rice chromosomes were used to map the QTL. These markers were mostly segregated according to Mendel Law except for fourteen markers. There were eleven QTL detected in eight traits, i.e., heading date, flag leaf length, plant height, panicle length, panicle weight, seed set, weight of 100 grains, and grain weight per plant, meaning that one or two QTL were detected in each trait. These QTL were located at chromosome 2, 3, 4, 6, 11, and 12. Some QTL were located at the same chromosome even at the same location indicating the close association of the traits. It also indicated that there were common QTL which were found across genetic background and specific QTL which were found at specific genetic background. Further study was prospective for the molecular marker application in rice improvement.
Key words: QTL, agronomic traits, SSR, rice
INTRODUCTON
Important traits of plant such as yield and yield related traits are mostly quantitative traits which have continuous phenotypic distribution. It implied that many genes with relatively small effect termed as QTL (quantitative trait loci) controlling the traits. The ability of molecular marker technique to dissect quantitative trait into Mendelian loci (Tanksley, 1993) opens the chance to identify and locate QTL. In turn it will be very useful for plant improvement (Septiningsih et al.,
2003).
Yield and yield related traits have been the major goal of rice breeding and remain important in the future. Studies on agronomic traits have been done and yielded promising result (Jing-hong et al., 2008). Some agronomic traits such as heading date, panicle characteristics, spikelet fertility, grain size as well as the yield have become the focus in some studies (Vergara et al., 1996; Moncada et al., 2001; Septiningsih et al., 2003; Thomson et al., 2003; Cui et al., 2004; Linh et al., 2006; Jing-hong et al., 2008). On the other hand, flag leaf characteristic may significantly contribute to the yield, but less study was done on this particular trait.
QTL study of those agronomic traits will be useful for the application of molecular marker in breeding for the particular agronomic traits and yield as well.
Simple Sequence Repeats (SSR) or micro satellite marker is a marker of choise for rice study and is increasingly used in the recent studies. SSR marker is simple and relatively cheap (PCR based marker), accurate (work into the DNA), could be used for high throughput application (Panaud et al., 1995), also is a co-dominant marker that can detect multi allele in a locus (Powell et al., 1996). A lot of SSR markers have been developed for rice study. McCouch et al. (2002) reported that there were 2240 unique marker loci validated in rice, or approximately one SSR at every 157 kb of rice genome. More SSR could be searched especially after the completion of rice genome sequencing (IRGSP, 2005; Yu et al., 2002). Zhang et al. (2007) reported the availability of another 52,845 SSR markers.
MATERIALS AND METHODS
Plant Material
Selection of parents was conducted in the previous research consisting of elite lines as well as modern and traditional varieties having indica, japonica, and wild relative genetic background. The materials were tested for at least two seasons and sites in the Philippines. IR75862-206-2-8-3-B-B-B and IR64 were selected as parents. IR75862-206-2-8-3-B-B-B is a new plant type line, derived from cross combination of
IR65600-81-5-3-2/Oryza longistaminata//2*IR65600-81-5-3-2.
IR75862-206-2-8-3-B-B-B has mixed characteristics of
indica and japonica rice sub-species. IR64 is an indica
variety and is a popular modern high yielding variety widely adopted by farmers.
Development of mapping population started by single crossing in dry season 2006 (January to June) and continued by backcrossing into IR64 in wet season of 2006 (July to December). Backcross population (BC1F1)
of IR75862-206-2-8-3-B-B-B//IR64 consisting of 115 individual genotypes was used for mapping population.
Field Observation
The backcross population was planted in dry season 2007 (January – July, agronomic trait observation was included) at IRRI Experimental Station. Each 15 plants of parents and F1 population
were included as check. The seed was sown individually and transplanted at 21 days after sowing into field as single seedling per hill with the space of 20 cm x 20 cm. At the maximum tillering stage, the plant was splitted into three identical clones and transplanted according to Completely Randomized design of three replicates (triplicate) at the prepared field with the space of 20 cm x 20 cm. Purple rice (rice plant having purple color in a whole plant) was planted as two rows border around the nursery. Fertilization was done by considering the need of the plant based on site specific nutrient management. Fertilizers were applied four times. Basal aplication was 50 kg/ha of complete fertilizer (14 N 14P 14K), second one was 30 kg N/ha (as Urea) three weeks after transplanting, the third was 40 kg N/ha (as Urea) five weeks after transplanting, and the fourth was 20 kg N/ha (as Urea) at nine weeks after transplanting.
Observation was done on ten agronomic traits, i.e., heading date (number of days required from sowing to the panicles emergence from the leaf sheath of the plant), flag leaf length (the length from the base to the tip of randomly five flag leaves per plant; mm), flag leaf width (the width of five selected flag leaves measured at the middle of the leaf; mm); plant height (the length of stem measured from the soil surface to the tip of highest panicle without any consideration about the awn; cm); panicle length (the length from the base of panicle to the
tip of the last grain or awn of the grain; two panicles were measured from each plant; mm); panicle weight (weight of both panicles from each plants from base of panicle to the tip of the last grain or awn of the grain after removing the flag leaf; mg); number of total grain per panicle (total from number of filled and unfilled grain of each panicle); seed set (percent of filled grain out of the total grain per panicle); grain weight per plants (weight of clean filled grain of each plant); and weight of 100 grains (weight of 100 randomly chosen, clean and filled grains; g).
SSR Analysis
Molecular works were done at GAMMA (Gene Array and Molecular Marker Arrangement) Laboratory of IRRI during the year of 2007. A set of 527 SSR markers were tested to find polymorphic marker between the parents (McCouch et al., 2002). The sequences of each of the primer pairs were downloaded from http://www.gramene.org/microsat/ssr.html.
Molecular works for parental survey (selection of polymorphic markers between parent) as well as for the mapping population (BC1F1 of
IR75862-206-2-8-3-B-B-B//IR64) was done as follows. DNA was extracted from 35 day-old leaves using modified CTAB method (Murray and Thompson 1980). PCR reaction was conducted in 10 µl reaction solution consisting of 50 ng of template DNA, 0.25 µM of each forward and reverse primer, 100 µM of each dNTPs, 1 X reaction buffer (20 mM Tris pH 8.3, 50 mM KCl, 1.5 mM MgCl2, and
Frequency distribution of phenotypic data of each traits and QTL mapping including Single Marker Regression (SMR), Simple Interval Mapping (SIM), and Composite Interval Mapping (CIM) was analyzed using QGene version 4.0 (Nelson, 1997). LOD value of 3 or higher than the threshold value based on 1000 times permutation (Moncada et al., 2001) was used to select the putative QTL.
RESULTS AND DISCUSSION
Markers Segregation and Traits Frequency Distribution
Based on the χ2 test, there were 14 SSR markers, out of the 93 markers, significantly deviated from the Mendel Law showing segregation distortion and skewed to one of the possible genetic constitution (IR64 or heterozygous). RM508, RM204, RM276, RM7193, RM3827 of chromosome 6 and RM248 of chromosome 7, RM3428 and RM5349 of chromosome 11 skewed to IR64 constitution. RM1869 of chromosome 4, RM5432
and RM332 of chromosome 8, RM288 of chromosome 10, RM1240 of chromosome 11, and RM3226 of chromosome 12 skewed to heterozygous constitution.
Skewness might be due to the sterility or incompatibility gene(s) that disturb the viability of gamete to the progeny. It may due to the wide genetic background of parents. Association of the sterility or incompatibility genes with the marker tested caused the distortion of the marker segregation. Segregation distortion was reported in some crosses such as BC2F2
of IR64/O rufipogon (Septiningsih et al., 2003), BC2F2
of Jefferson/O. rufipogon (Thomson et al., 2003), DH population of IR64/Azuceha (Huang et al., 1997), Nipponbare/Kasalath (Harushima et al., 1996), F2
population of Taichung 65/O. glaberrima (Doi et al., 1998), and RIL of LH422/9024 (Xiao et al., 1998).
The frequency distribution of the observed traits along with the predicted value of the parents and F1 is
illustrated in Figure 1. It was seem that the traits were divergently distributed and the frequency mostly accumulated near to IR64 as recurrent parent.
Figure 1. Frequency distribution of some agronomic traits at the BC1F1 population
Note: The code refers to Table 1, FLL=flag leaf length (mm), TG=total grain per panicle (grains) IR64 IR75862 --206 -2 -8-3 -B-B -B
Hdg
FLW
PL
TG
FLL
PH
PW
SS
Wt Wt100
F1
IR64 IR75862 --206 -2 -8-3 -B-B -B HD
FLW
PL PL
TG TG
FLL
PH
PW PW
SS SS
Wt Wt Wt100
Wt100
QTL Analysis
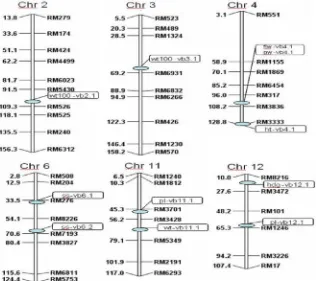
Eleven putative QTL (then termed as QTL) controlling eight agronomic traits were detected (Table 1) located at chromosome 2, 3, 4, 6, 11, and 12 (Figure 2). No of QTL of two traits, i.e., flag leaf length and total number of grain per panicle was detected in this study.
SMR, SIM, and CIM analyses were run to determine the QTL. The methods mostly gave the same result, however CIM analysis was the best analysis to conclude the results, because CIM could remove the background effect from neighboring markers and locate the QTL more precisely.
Table 1. QTL of some agronomic traits of the backcross mapping population
No Trait QTL Name Chr Position
(cM) Marker Donor Additive LOD R
2
1 HD hd-vb12.1 12 16 RM8216-RM3472 IR64 -3.811 3.362* 0.126
2 FLW fll-vb4.1 4 104 RM317-RM3836 IR75862- 1.632 7.489** 0.259
3 PH ph-vb4.1 4 128 RM3333 IR75862- 4.296 3.413* 0.128
4 PL pl-vb11.1 11 48 RM3701-RM3428 IR64 -13.615 3.073* 0.116
5 PL pl-vb12.1 12 62 RM101-RM1246 IR75862- 15.794 3.528* 0.132
6 PW pw-vb4.1 4 104 RM317-RM3836 IR75862- 0.39 3.321* 0.125
7 SS ss-vb6.1 6 34 RM276 IR64 -0.105 9.944** 0.328
8 SS ss-vb6.2 6 68 RM8226-RM7193 IR64 -0.073 4.195** 0.155
9 Wt100 wt100-vb2.1 2 108 RM5430-RM526 IR75862- 0.141 5.24** 0.189 10 Wt100 wt100-vb3.1 3 68 RM1324-RM6931 IR64 -0.142 5.36** 0.193
11 Wt wt-vb11.1 11 62 RM3428-RM5349 IR64 -9.884 4.005** 0.148
Note : HD=heading date(days), FLW=Flag Leaf Width (mm), PH=Plant Height (cm), PL=Panicle length (mm), PW=Panicle Weight (g), SS=Seed Set, Wt100=Weight of 100 grains (g), Wt =Weight of grain per plant (g), Chr=chromosome, LOD=Log of Odd
QTL of Heading Date
QTL of hd-vb12.1 (Table 1) associated with heading dates was detected at chromosome 12 at the position of 16 cM (between RM8216 and RM3472). It contributed to 12.6% of variation and was contributed by IR64 with additive effect of 3.811 day.
Moncada et al. (2001) using Oryza rufipogon
genetic background reported four QTL controlling heading date, located at chromosome 2, 3, and 7 explaining 6-14% of variation. On the other hand, Septiningsih et al. (2003) using population from IR64/O. rufipogon reported six QTL controlling heading date, located at chromosome 2, 7, 11, and 12 explaining 4-12% of variation. Linh et al. (2006) using population from O. sativa/O. minuta reported two QTL controlling heading date or days to heading located at chromosome 6 and 9 explaining a total of 43.2% of variation. Cui et al. (2004) using Zenshan97/ Minghui63 (O. sativa L. ssp. indica) reported six QTL controlling heading date located at chromosome 6, 7, 10, and 11 explaining 59.69% variation. Those studies reported different number and location of QTL detected indicating that different mapping populations or genetic backgrond showed different genetic control of the trait.
QTL of Flag Leaf Width
There was one QTL detected associated with flag leaf width, i.e., fll-vb4.1 (Table 1) at 104 cM of chromosome 4 (RM317-RM3836) explaining 25.9% variation. The additive effect was 1.632 mm to RM3333. It explained 12.8% of variation contributed by IR75862-206-2-8-3-B-B-B with additive effect of 4.296 cm.
Moncada et al. (2001) reported six QTL controlling plant height located at chromosome 1, 2, 4, and 5 explaining 6–21% of variation. On the other hand, Septiningsih et al. (2003) reported five QTL controlling plant height located in chromosome 1, 4, 6, 10, and 11 explaining 6–55% of variation. Cui et al.
(2004) reported four QTL controlling plant height at maturity located at chromosome 3, 4, and 6 explaining 39.76% of variation. You et al. (2006) reported 17 QTL controlling plant height located spreadly at all of the 12 rice chromosomes explaining from 5-23% of variation. All the above mentioned study obtained QTL at
chromosome 4 for the trait. It indicated that there were many QTL controlling plant height. Some QTL may be detected in some genetic background and some may be found only in specific genetic background.
QTL of Panicle Length
Two QTL were detected to be associated with panicle length, i.e., pl-vb11.1 and pl-vb12.1. The
pl-vb11.1 located at 48 cM of chromosome 11 closely
linked to RM3333 contributing 11.6% of variation. The donor for the favorable allele was IR64 with the additive effect of 13.62 cm. The pl-vb12.1 located at 62 cM of chromosome 12 between RM101 and RM1246. It was contributed by IR75862-206-2-8-3-B-B-B with the additive effect of 15.79 cm. Both parents had that there were different mechanisms in controlling panicle length.
QTL for Panicle Weight
The only QTL detected for panicle weight was
pw-vb4.1. It was located in 104 cM of chromosome 4
between RM317 and RM3836. It could explain 12.5% of variation with additive value of 0.39 g and was contributed by IR75862-206-2-8-3-B-B-B.
QTL for Seed Set
Two QTL were detected to be associated with seed set, i.e., tg-vb6.1 and tg-vb6.2. Both were located at chromosome 6 and both having IR64 as donor. The first was located at 34 cM linked to RM276 which explained 32.8% of variation with additive effect of 0.1% of seed set. The second was located at 68 cM between RM8226 and RM7193 which explained 15.5% of variation with additive effect of 0.07% of seed set.
Moncada et al. (2001) reported two QTL controlling the level of sterility located at chromosome 10 explaining around 13% of variation. It was contributed by O rufipogon which increased the level of sterility. Septinigsih et al. (2003) reported three QTL for the traits located at chromosome 1, 2, and 11 explaining 6 to 10% of variation.
QTL for Weight of 100 Grains
in 108 cM of chromosome 2 (between RM5430 and RM 526) having additive effect of 0.14 g and explained 18.9% of variation. The second one was contributed by IR64 located at 68 cM of chromosome 3 (between chromosome 1 might be close to the QTL found in this study (wt100-vs1.1 at 66 cM). Septiningsih et al.
(2003) reported five QTL controlling grain weight located at chromosome 1, 2, 3, and 7 explaining 4 to 11% of variation. Those study detected QTL in chromosome 3. The use of different markers across the study make it difficult to check if it may have been the same QTL detected.
QTL for Grain Weight per Plant
QTL for grain weight per plant, i.e., wt-vb11.1
could be detected. It was located at chromosome 11 at 62 cM (between RM3428 and RM5349) which was contributed by IR64 with additive effect of 9.884 g. It could explain 14.8% of variation.
Moncada et al. (2001) reported two QTL associated with yield per plant located at chromosome 1 and 11. Both were contributed by O rufipogon for increasing the yield which explained 7 – 14% of variation. On the other hand, Septiningsih et al. (2003) reported three QTL associated with yield per plant. Two was at chromosome 1 and one at chromosome 2. They contributed to 3 – 6% of variation.
In general, the number of QTL detected in this study was relatively lower compared to those of other studies such as average of 3.5 QTL per traits (Moncada
et al., 2001) and 3.8 QTL per traits (Septiningsih et al., caused downward bias in the number of QTL involved in a trait. This caused of the power of the QTL significance tests was reduced (Holland, 2005). Small size of mapping population faced more of type II error (missing true QTL) than type I error (getting false replication should also be considered to be related to the few QTL detected.
Some QTL associated with different traits were found at the same chromosome indicating the close association of the traits. It was noticed that fll-vb4.1
associated with flag leaf length and pw-vb4.1 associated with panicle weight were located at the close position at chromosome 4. It might be due to the QTL was close each other or even it was a pleiotropic QTL.
The result of each trait explained above showed that comparative study with other mapping population resulted some QTL controlling specified traits found at the same location across mapping population. It indicated that the particular region might have common QTL and that particular region was considered to be important for the improvement of certain traits. This QTL might work for wide genetic background. On the other hand, there were QTL found only in a specific genetic background. It might be important if the QTL had big effect and stable across environment. Therefore, it could be used for plant improvement at the specific genetic background.
The results indicated that the QTL found in this study was reliable and confirmed some previous QTL studies. Further study to find more QTL and dissect more detail the promising QTL is important for the application of molecular marker technique for plant improvement.
CONCLUSIONS
1. Mostly the markers segregated according to Mendel Law, unless in some regions of the genome. 2. There were 11 QTL associated with eight yield,
yield component, and morphological traits. They were located at chromosome 2, 3, 4, 6, 11, and 12. 3. Comparative study with previous mapping
researches found QTL that were existed across genetic background as well as QTL that were existed only at specific genetic background.
ACKNOWLEDGEMENT
LITERATURES
Cui, K., S. Peng, Y. Ying, S. Yu, C. Xu. 2004. Molecular dissection of the relationship among tiller number, plant height and heading date in rice. Plant Prod.Sci. 7(3):309-318.
Doi, K., A. Yoshimura, N. Iwata. 1998. RFLP mapping and QTL analysis of heading date and pollen sterility using backcross populations between
Oryza sativa L. and Oryza glaberrima Steud.
Breeding Sci. 48:395–399.
Haley, C., L. Anderson. 1997. Linkage mapping quantitative trait loci in plants and animals. P 49-71. In. Dear, P. (Ed.) Genome Mapping - A Practical Approach. Oxford University Press-New York.
Harushima, Y., M. Yano, A. Shomura, M. Sato, T. Shimano, Y. Kuboki, T. Yamamoto, S.Y. Lin, B.A. Antonio, A. Parco, H. Kajiya, N. Huang, K. Yamamoto, Y. Nagamura, N. Kurata, G.S. Khush, T. Sasaki. 1998. A high-density rice genetic isozymes, RAPD and QTL for grain shape, brown planthopper resistance in a doubled haploid rice population. Mol. Breed. 3: 105–113.
[IRGSP] International Rice Genome Sequencing Project. 2005. The map-based sequence of the rice genome. Nature 436: 793 – 800.
Jing-hong, D., F.Ye-yang, W. Ji-rong, Z. Jie-yun. 2008. Dissection of QTLs for yield traits on the short arm of rice chromosome 6. Agricultural Sciences in China 7(5): 513-520.
Linh, L.H., F.X. Jin, K.H. Kang, Y.T. Lee, S.J. Kwon, S.N. Ahn. 2006. Mapping quantitative trait loci for heading date and awn length using an advanced components in an Oryza sativa x Oryza rufipogon
BC2F2 population evaluated in an upland
environment. Theor. Appl. Genet. 102:41–52.
Murray, M.G., Thompson, W.F. 1980. Rapid isolation of high molecular weight DNA. Nucleic Acids Res. 8:4321-4325.
Nelson, J.C. 1997. QGENE: software for marker-based genomic analysis and breeding. Mol. Breed. 3: 239-245.
Openshaw, S., E. Frascaroli. 1998. QTL detection in large and small samples using real data Plant and Animal Genome VI. http://www.intlpag.org/ pag/6/abstracts/141.html, San Diego, CA, pp 127.
Panaud, O., X. Chen, S.R. McCouch. 1995. Frequency of microsatellite sequences in rice (Oryza sativa
L.). Genome 38:1170–1176.
Powell, W., M. Morgante, C. Andre, M. Hanafey, J. Vogel, S. Tingey, A. Rafalski. 1996. The comparison of RFLP, RAPD, AFLP, and SSR (microsatellite) markers for germplasm analysis. Mol. Breed. 2:225–238.
Septiningsih, E.M., J. Prasetyono, E. Lubis, T.H. Thai, T. Tjubaryat, S. Moeljopawiro, S.R. McCouch. 2003. Identification of quantitative trait loci for yield and yield component in an advanced backcross population derived from the Oryza
sativa variety IR64 and the wild relative O.
rufipogon. Theor. Appl. Genet. 107:1419–1432.
Tanskley, S.D. 1993. Mapping polygenes. Annu. Rev. Genet. 27 : 205 – 233.
Thomson, M.J., T.H. Tai, A.M. McClung, X.H. Lai, M.E. Hinga, K.B. Lobos, X. Yu, C.P. Martinez, S.R. McCouch. 2003. Mapping quantitative trait loci for yield, yield components and morphological traits in an advanced backcross population between Oryza rufipogon and the Oryza sativa
cultivar Jefferson. Theor. Appl. Genet. 107:479-493.
Vergara, B.S., A.Tanaka, R. Lilis, S. Puranabhavung. 1996. Relationship between growth duration and grain yield of rice plants. Soil Sci. Plant Nut. 12:31-39.
Xiao, J., J. Li, J. Grandillo, S.N. Ahn, L. Yuan, S.D. Tanksley, S.R. McCouch. 1998. Identification of trait-improving quantitative trait loci alleles from a wild rice relative, Oryza rufipogon. Genetics 150: 899–909.
lines and testcross populations for traits of agronomic importance in rice. Genetics 172:1287-1300.
Yu, J., S.N. Hu, J. Wang, G.K.S. Wong, S.G. Li, B. Liu, Y.J. Deng. 2002. A draft sequence of the rice genome (Oryza sativa L. ssp indica). Science 296:79–92.
Yue, B., X. Wei-Ya, L. Li-Jun, X. Yong-Zhong. 2006. QTL Analysis for flag leaf characteristics and their relationships with yield and yield traits in rice (Abstract) Acta Genetica Sinica 33(9): 824-832.