MAPPING OF QUANTITATIVE TRAIT LOCI FOR HIGH
IRON AND ZINC CONTENT IN POLISHED RICE (
ORYZA
SATIVA
L) GRAIN AND SOME AGRONOMIC TRAITS USING
SIMPLE SEQUENCE REPEATS MARKERS
UNTUNG SUSANTO
GRADUATE SCHOOL
BOGOR AGRICULTURAL UNIVERSITY
BOGOR
DECLARATION OF AUTHENTICATION
Hereby I declare that this dissertation of “Mapping of quantitaive trait loci for high iron and zinc content in polished rice (Oryza sativa L) grain and some agronomic traits using simple sequence repeats markers” is my original work with the guidance from advisory committee and has never been proposed to any other university. Information cited from either published or unpublished reference were explicitly mentioned in the manuscript and listed in the reference at the end part of the dissertation.
Bogor, December 2008
ABSTRACT
UNTUNG SUSANTO: Mapping of quantitative trait loci for high iron and zinc content in polished rice (Oryza sativa L) grain and some agronomic traits using simple sequence repeats markers.
Under supervision of Hajrial Aswidinnoor (as chairman) and Jajah Koswara, Asep Setiawan, and Parminder S. Virk as members of the advisory committee.
Iron and zinc deficiency occurred especially in the poor region of the world causing significant loss due to death, sickness, and decreasing productivity as and life quality. Genetically increasing the iron and zinc content of rice grains is an efficient and effective way to overcome the iron and zinc deficiency problem. Mapping of QTLs (Quantitative Trait Loci) controlling high iron and zinc content in polished rice grains to get markers for Molecular Assisted Breeding (MAS) is prospective to be done since iron and zinc content are quantitative traits that highly affected by environment and its measurement is still costly. Study on polished rice as ste state of people use for their consumption would give more applicable result and study on agronomic and yield related traits would be helpful to incorporate those traits in breeding activity. Simple Sequence Repeats (SSR) markers were used in this study. The objectives of this study were to assess molecular diversity among promising germplasm in related with grain nutritional traits, to identify suitable parents for developing mapping populations, to map QTLs for iron and zinc contents in polished rice grain, and to map QTLs for some agronomic and yield related traits. The experiments were conducted from July 2005 to May 2008 at IRRI (International Rice Research Institute) campus Los Banos, Philippines. Twelve potential genotypes (eight varieties having high iron and zinc content consisted of japonica, intermediate and indica varieties; four varieties having low iron and zinc content consisted of two indica developed varieties and two Korean varieties with specific novelty) were selected for this study. Two mapping populations were then selected for QTL study by implementing Completely Randomized Design with three replications (triplicate of the individual plant). They are BC1F1 of IR75862-206-2-8-3-B-B-B//IR64 (115
individuals; 93 SSR markers) and F2 of Joryeongbyeo/IR64 (107 individual; 73
SSR markers). There were 183 polymorphic markers used for molecular diversity study resulting PIC (polymorphic information content) value ranging from 0.08 to 0.75 and clustering at the similarity level of 54% grouped the parents into three groups. Eleven QTLs related with 8 agronomic traits in the backcross mapping population and 17 QTLs related with 7 agronomic traits in the F2 mapping
population were detected. Analysis of QTL for iron and zinc content could not be done in the F2 population due to sterility problem as consequence of
indica/japonica crossing causing lack of grain sample. In the backcross population, it was detected two QTLs controlling iron content (in chromosome 3 and 6) and two QTLs controlling zinc content (in chromosome 6 and 12). This finding is important information for further studies.
ABSTRAK
UNTUNG SUSANTO: Mapping of quantitative trait loci for high iron and zinc content in polished rice (Oryza sativa L) grain and some agronomic traits using simple sequence repeats markers (Pemetaan.quantitative trait loci terkait dengan kandungan besi dan zinc yang tinggi pada beras sosoh padi (Oryza sativa L) dan beberapa karakter agronomi menggunkan marka simple sequence repeats).
Dibawah bimbingan Hajrial Aswidinnoor (ketua) dan Jajah Koswara, Asep Setiawan, dan Parminder S. Virk sebagai anggota komisi pembimbing.
Defisiensi besi dan zinc terjadi terutama di daerah miskin dunia mengakibatkan kerugian besar terkait kematian, sakit, serta penurunan produktivitas dan kualitas hidup. Perbaikan genetik kandungan besi dan zinc pada beras sosoh (polished rice) merupakan cara yang efisien dan efektif untuk mengatasi permasalahan defisiensi besi dan zinc tersebut. Pemetaan QTL (Quantitative Trait Loci; lokus pengendali karakter kuantitatif) terkait dengan kandungan besi dan zinc yang tinggi pada beras sosoh untuk memperoleh marka yang dapat digunakan dalam pemuliaan dengan alat bantu marka molekuler prospektif untuk dilakukan mengingat kandungan basi dan zinc merupakan karakter kuantitative yang besar dipengaruhi lingkungan dan biaya pengukurannya yang masih relative mahal. Penelitian pada beras sosoh yang biasa dipakai untuk konsumsi manusia akan memberikan hasil yang lebih aplikatif. Sementara itu, penelitian terhadap karakter agronomi dan karakter terkait hasil akan mendukung kegiatan pemuliaan untuk menggabungkan sifat-sifat unggul tersebut. Marka SSR (Simpel Sequence Repeats) digunakan dalam penelitian ini. Tujuan penelitian ini adalah untuk mengkaji diversitas molekuler diantara genotype potensial terkait kandungan nutrisinya, mencari tetua yang pas untuk pemetaan genetik, memetakan QTL pengendali kandungan besi dan zinc yang tinggi pada beras sosoh, dan memetakan QTL karakter agronomi dan karakater terkait hasil. Penelitian dilakukan mulai Juli 2005 sampai Mei 2008 di kampus IRRI (Internacional Rice Research Institute), Los Banos, Pilipina. Dua belas genotipe (delapan varieas dengan kandungan besi dan zinc tinggi yang terdiri atas varietas india, japonica, dan intermediate; empat varietas dengan kandugan besi dan zinc rendah yang terdiri atas dua kultivar indica dan dua varietas dari Korea dengan keistimewaan khusus) digunakan untuk penelitian ini. Dua populasi pemetaan akhirnya dipilih untuk analisa QTL mengikuti Rancangan Acak Lengkap dengan tiga ulangan (dengan membagi tiap tanaman menjadi tiga klon identik saat fase anakan maksimum). Populasi tersebut adalah silang balik generasi pertama (BC1F1) dari IR75862-206-2-8-3-B-B-B//IR64 (115 genotipe; 93
SSR) dan F2 dari Joryeongbyeo/IR64 (107 genotipe; 73 SSR). Sebanyak 183 SSR
teridentifikasi polimorpik dan memberikan nilai PIC (Polymorphic Information Contet) berkisar antara 0.08 dengan 0.75. Klustering pada tingkat kemiripan 54% mengelompokan kedua belas tetua dalam tiga kelompok. Sebanyak 11 QTL terkait dengan 8 karakter agronomi terdeteksi pada populasi silang balik dan 17 QTL terkait dengan 7 karakter agronomi terdeteksi pada populasi F2. Analisa
QTL kandungan besi dan zinc tidak dapat dilakukan pada populasi F2 karena
kurangnya sampel sebagai akibat sterilitas sebagai konsekuensi dari persilangan indica/japonica. Pada populasi silang baling terdeteksi dua QTL pengendali kandungan besi tinggi (pada kromosom 3 dan 6) dan dua QTL pengendali kandungan zinc yang tinggi (pada kromosom 6 dan 12). Penemuan dalam penelitian ini sangat penting untuk penelitian lebih lanjut.
SUMMARY
UNTUNG SUSANTO: Mapping of quantitative trait loci for high iron and zinc content in polished rice (Oryza sativa L) grain and some agronomic traits using simple sequence repeats markers.
Under supervision of Hajrial Aswidinnoor, Jajah Koswara, Asep Setiawan, and Parminder S. virk.
Micronutrient malnutrition is recognized as a massive and rapidly growing public health issue especially among poor people living on an unbalanced diet dominated by a single staple grain such as rice. Among the major micronutrient deficiencies common in rice-consuming countries are: iron and zinc deficiencies. It is estimated that more than 3 billion people in the developing world are iron deficient. Zinc deficiency is more extensive in developing countries where more than 60 per cent of the population is at risk (www.harvestplus.org). The cost of micronutrient deficiencies in terms of lives lost and quality of life are enormous.
Some strategies to address micronutrient deficiencies include supplementation and fortification which are continuing to address this problem. However, breeding staples such as rice with high micronutrient content dubbed as ‘biofortification’ has evolved as a new strategy to address micronutrient malnutrition. Biofortification provides a cost effective and sustainable solution to combat malnutrition (Bouis 2004). Since the poor in many low-income Asian countries consume large amounts of rice, improving its micronutrient content for these two micronutrients shall address to a large extent the micronutrient deficiency-induced health problems.
Genetic variation for iron and zinc in the polished rice grains has been reported by (Virk et al. 2006; 2007). However, genetics of grain iron and zinc content is not known which is a prerequisite for designing efficient breeding strategies aimed at improving nutritional quality of rice.
Edwards & McCouch 2007). Furthermore, a saturated map of SSR (Simple Sequence repeats) markers in rice with 2240 validated and another 52,845 SSR markers is available (McCouch et al. 2002 and Zhang et al. 2007).
In the present study promising germplasm possessing high zinc and iron content along with some nutritionally rich Korean cultivars and some popular indica rice varieties were analyzed using SSR markers and selected parents were
used to develop mapping populations aimed at studying the genetic control of these traits.
The objective of this study, therefore, were to: (1) assess molecular diversity for grain nutritional traits among promising germplasm (2) identify suitable parents for developing mapping populations (3) map QTLs (quantitative Trait Loci) for iron and zinc contents in polished rice grain (4) map QTLs for some agronomic and yield related traits.
Twelve potential genotypes (eight varieties having high iron and zinc content consisted of japonica, intermediate and indica varieties; four varieties having low iron and zinc content consisted of two indica developed varieties, and two Korean varieties with specific novelty) were selected as potential parents. The field experiment was done at IRRI Experiment Field start at Dry Season of 2006 until Dry Season of 2007. Planting at Dry Season and Wet Season of 2006 were dedicated to do single crossing and backcrossing.
Development of mapping and breeding populations resulted 39 single cross populations (include some reciprocals) those were continued in the subsequent selfing generations and 12 backcross populations.
Two populations were selected as mapping population, i.e. (1) IR75862-206-2-8-3-B-B-B/IR64//IR64 (backcross mapping population) consisted of 115 plants. Agronomic traits as well as iron and zinc content were observed in this population; (2) Joryeongbyeo/IR64 (F2 mapping population) consisted of 105
plants. Due to sterility that caused lacking of samples as consequence of indica/japonica crossing, mostly the plant has not enough grain samples for iron
and zinc measurement. Iron content was measured anyway using colorimetric method to the genotypes having enough samples for initial individual screening.
There were 11 QTLs identified controlling eight agronomic traits (heading date, flag leaf width, plant height, panicle length, panicle weight, seed set, weight of 100 grains, and weight per plant) in the backcross mapping population located in chromosome 2, 3, 4, 6, 11, and 12. The LOD value ranged from 3.07 to 9.94 representing 11.6 – 32.8% of total variation of the traits. Either IR64 or IR75862-206-2-8-3-B-B-B had alleles contributed to the particular observed traits.
There were 17 QTLs detected controlling seven agronomic traits (heading date, flag leaf width, plant height, panicle length, panicle weight, total grain per panicle, and weight of 100 grains) in the F2 mapping population. The LOD value
were ranged from 3.12 – 5.94 representing 13 – 22% of total variation of the traits. Mostly IR64 contributed to the excellence of the agronomic traits observed. Joryeongbyeo partially contributed to the traits of flag leaf width and weight of 100 grains.
At back cross population, it was detected two QTLs controlling high iron in polished rice grains were detected in chromosome 3 and 6 having LOD value of 4.72 and 3.28 representing 17.2% and 12.3% of total variation contributed by IR75862-206-2-8-3-B-B-B. There were also identified two QTLs controlling high zinc content in polished rice grains located at chromosome 6 and 13 both having LOD of 2.8 each representing around 10% of total variation contributed partially by IR75862-206-2-8-3-B-B-B (in chromosome 6)and IR64 (in chromosome 12).
Copyright@2008, Bogor Agricultural University
Copyright are protected by law,
It is prohibited to cite all or part of this dissertation without referring to and
mentioning the source. Citation only permitted for the sake of education,
research, scientific writing, report writing, critical writing or reviewing scientific
problems; and citation does not inflict the name and honor of Bogor Agricultural
University.
It is prohibited to republish and reproduce all or part of this dissertation without
MAPPING OF QUANTITATIVE TRAIT LOCI FOR HIGH
IRON AND ZINC CONTENT IN POLISHED RICE (
ORYZA
SATIVA
L) GRAIN AND SOME AGRONOMIC TRAITS USING
SIMPLE SEQUENCE REPEATS MARKERS
UNTUNG SUSANTO
DISSERTATION
SUBMITTED AS PARTIAL FULFILLMENT FOR THE DEGREE OF DOCTOR
AT THE STUDY PROGRAM OF AGRONOMY
THE GRADUATE SCHOOL
BOGOR AGRICULTURAL UNIVERSITY
BOGOR
Examiner in Pre-elimination Test: Dr Ir Miftahudin, MS
Examiner in Closed Defend: Dr Ir Ahmad Junaedi, MSc
Examiners in Open Defend: Dr Ir Aan Andang Daradjat, MS Prof Dr Ir Sriani Sujiprihati, MSc
Dissertation Title : Mapping of quantitative trait loci for high iron and zinc content in polished rice (Oryza sativa L) grain and some agronomic traits using simple sequence repeats markers
Name : Untung Susanto SRN : A361034011 Study Program : Agronomy Program : Doctor (S3)
Approved by, Advisory committee
Dr Ir Hajrial Aswidinnoor, MSc Chairman
Dr Ir Asep Setiawan, MS Prof Dr Ir Jajah Koswara Member Member
Dr Virk S. Parminder, BSc, MSc Member
Approved by,
Coordinator of Dean of the Graduate School Study Program of Agronomy
Dr Ir Munif Ghulamahdi, MS Prof Dr Ir Khairil Anwar Notodiputro, MS
DEDICATION
This Dissertation is dedicated to:
1. My parents Rawin Wirjosumarto (the late) and Tasiwen who had taken all the best efforts for me to have the higher education.
2. My family: Puji Lestari, S.E., M.Si. Ak (wife) for all the invaluable love and sacrificing for me, Afifah Amalia Zahra (2000), Amira Shaliha Zahra (2003), and Akmaluddin Arief Susanto (2006) as flowers grooming my life.
PREFACE
The topic of “Mapping of quantitative trait loci for high iron and zinc content in polished rice (Oryza sativa L) grain and some agronomic traits using simple sequence repeats markers” is part of the research umbrella supported by Harvest Plus. The research became world priority in order to overcome the prevalence of micronutrient disorder in the world especially anemia and zinc deficiency as well as helping poor to face such problem. IFPRI (International Food Policy Research Institute), CGIAR (Consultative Group for International Agricultural Research) in which IRRI (International Rice Research Institute) is included, some universities, and several countries collaborates to face this problem. In Indonesia, Department of Agriculture and Department of Health cooperates in collaboration with IFPRI and CGIAR.
In this opportunity, I would like to express my great gratitude to:
− Dr Ir Hajrial Aswidinnoor, MSc chairman of the advisory committee, Prof Dr
Ir Jajah Koswara, and Dr Ir Asep Setiawan, MS members of advisory committee for their guidance, patience, suggestions, and correction.
− Dr Virk S. Parminder, BSc, MSc as committee member and my advisor in
IRRI, for his full support for my scholarship, for his patient for my consultations, for the guidance and full encouragement for the best of the research.
− Dr Ir Miftahuddin, MS for the suggestion at the Pre-eliminaation test.
− Dr Ir Bambang Sapta Purwoko, MSc, Dr Ir Munif Ghulamahdi, MS, Dr Ir
Ahmad Junaedi, MSc, and Dr Ir Trikusumaningtyas, MSc for the suggestion and correction during closed defense and or open defense.
− Dr Ir Aan Andang Daradjat, MS and Prof Dr Ir Sriani Sujiprihati, MSc for the suggestion and correction during open defense.
− Dr Mark A Bell and continued by Dr Noel Magor, head of IRRI Training
Center, who always encourage scholar for the study and research and take best efforts for the convenience of all IRRI scholars.
− Drs Mahyuddin Syam, MPS IRRI Liaison Scientist for Indonesia, Malaysia,
and Brunei Darussalam who always cares of me and facilitate all I need during my study and research.
− Dr Aparna Das and Dr Deepinder Grewal who guided me a lot along my
molecular and tissue culture lab.
− Dr Mike Thomson and Mr Jerome Bernier for giving and teaching me many
analytical softwares and invaluable discussion.
− Mr Alamgir, Mr Partha and other scholars for always supporting me, giving good atmosphere and sharing the idea and knowledge.
− Mr Vit, Mr Beny, Mr Tony, Mr Lui, Mr. Vio and all people on field that
always guide and help me for field works.
− Tita Lina, Annie, Vanessa, Vanica, and all team members of Dr Virk’s group
for molecular works those always cooperate and encourage my work.
− Tita Mercy that teach me how to analyze iron and zinc content using colorimetric methods. Very welcome for my works during the analysis.
− Mr. Joel Macabenta and Mr. Angelo that greatly helping me in preparing the
samples.
− Analytical Service Laboratory (ASL) that analyze iron and zinc content using ICP method.
− Mam Menchu, Ms. Mayee, Tita Corra, Tita Eloi, Malen, and all GAMMA
Laboratory people who always cheering me up in the lab, and help me so much in my lab works.
− Climate Unit of Crop and Environmental Science Division of International
Rice Research Institute who provided the invaluable data of weather during the experimental period.
− My beloved wife and all my three children who giving me motivation and inspiration, more over for the patience, encouragement, and sacrificing many things during my study away.
− Last, but not least, I also thank to all person who I can not list one by one.
Thank you for all of your cooperation.
BIOGRAPHY
The author was born at Banyumas Central Java at December 18th 1973 as fifth and youngest child of the couple of Rawin Wirjosumarto the late and Tasiwen.
The author graduated from the Faculty of Agriculture General Soedirman University (1998) at his hometown. By the scholarship of URGE (University Research Graduate Education) the author accomplished master study at Study Program of Plant Science with specialization of Plant Breeding at Padjadjaran University (2001) at Bandung. Finally, by the support from IRRI/Harvest Plus Project the author pursued doctoral study at Program Study of Agronomy with specialization of Plant Breeding and Biotechnology at Bogor Agricultural University at Bogor, since January 2004. The author conducted the research at IRRI campus at Los Banos, Philippines from July 2005 to June 2008.
During the doctoral study period, the author was elected as President of Agronomy Graduate Student Association/FORSCA AGR IPB (2005) and General Secretary of AFSTRI (Association of Fellows Scholars Trainee and Residents of IRRI) at 2006. In relation with the dissertation, one group poster was presented at the open house of PBGB (Plant Breeding Genetic and Biotechnology) Division of IRRI (2007), one paper with the title of: “Assessment of genetic diversity of some nutritionally rich Korean varieties, elite lines and popular indica varieties of rice using SSR markers would be published in Crop Improvement Journal, India, and one paper with the title of: “QTL Mapping of Yield, Yield Components, and Morphological Traits in Rice (Oryza sativa L.) Using SSR Marker” is in press at Bulletin Agronomi, Indonesia. While taking study, one paper about application of molecular marker for rice breeding was published in the book of “Buku Padi 1” (2008) published by Indonesian Agency for Agricultural Research and Development.
The author work as a scientist/rice breeder at The Indonesian Center for Rice Research based in Sukamandi since 2000 and had published some scientific as well as popular articles during the job.
LIST OF CONTENT
Page LIST OF TABLES xvi LIST OF FIGURES xvii LIST OF APPENDICES xviii LIST OF ABBREVIATIONS xix LIST OF ABBREVIATION OF SOME OBSERVED TRAITS ………… xx
1. INTRODUCTION 1
2. REVIEW OF LITERATURES 3 2.1. Variation of Iron and Zinc Contents in Rice Grain 3 2.2. Genetics and Breeding for High Iron and Zinc Content in Rice
Grain 3
2.3. Genetic Basis of Mapping Genes/QTLs 6 2.4. Molecular Markers and QTL Mapping 8 2.5. The Physiology of Iron and Zinc in Rice Plants 13 3. MATERIALS AND METHODS 15 3.1. Summary of Various Experimental Activities 15 3.2. Identification and Selection of Promising Donor Genotypes 16 3.3. Materials 17 3.3.1. Production of F1 Hybrids 17
3.3.2. Production of F2 and Backcross Populations 18
3.6.3. Quantitative Trait Loci 26 4. RESULTS AND DISCUSSIONS 27 4.1. Assessment of Molecular Diversity 27 4.2. Mapping Populations 29 4.3. Analysis of Agronomic Traits and QTL Mapping 30 4.3.1. Analysis of Agronomic Traits 31 4.3.2. Quantitative Trait Loci for Agronomic Traits 36 4.3.3. Quantitative Trait Loci for Iron and Zinc Content in Polished
Rice Grain 43 5. CONCLUSIONS AND RECOMMENDATIONS 48 LITERATURES CITED 49
APPENDICES 54
LIST OF TABLES
Page 1. A brief description of selected genotypes 18 2. List of F1 successful crosses in Dry Season of 2006 19
3. List of F2 populations developed 20
4. List of Backcross Populations 21 5. List of crosses from which RILs production is in progress
(WS 2008 as F5) 22
6. Expected Components of Variances in a Completely Randomized
Design 26
7. Mean of Some Agronomic Traits and Micronutrient Contents of
Backcross Mapping Population, F1, and Parents 32
8. Mean of Some Agronomic Traits and Micronutrient Content of F2
Mapping Population, F1, and Parents 32
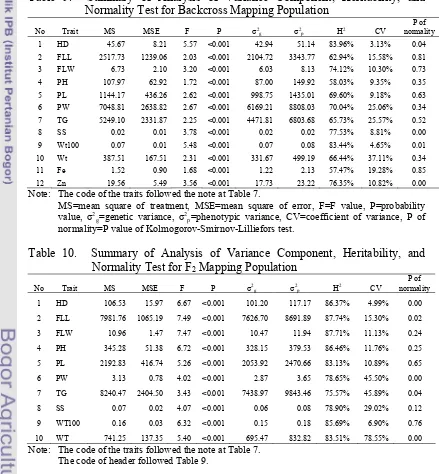
9. Summary of Analysis of Variance Component, Heritability, and
Normality Test for Backcross Mapping Population 34 10. Summary of Analysis of Variance Component, Heritability, and
Normality Test for F2 Mapping Population 34
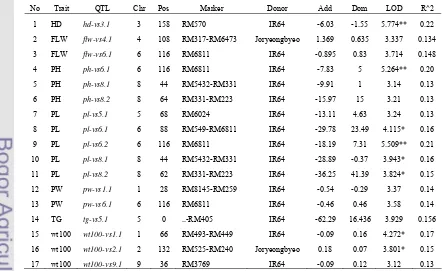
11. Quantitative Trait Loci detected for several Agronomic Traits in Backcross Mapping Population 38 12. Quantitative Trait Loci Detected for Several Agronomic Traits in
F2 Mapping Population 38
13. Comparison of Milling Degrees of Some Standard Varieties Using
Grainman and Kett Mills 44 14. Quantitative Trait Loci of Iron and Zinc Content of Backcross Mapping
LIST OF FIGURES
Page 1. Flow Chart of the Research Activities 15 2. Dendrogram of 12 Rice Genotypes Derived from UPGMA Cluster
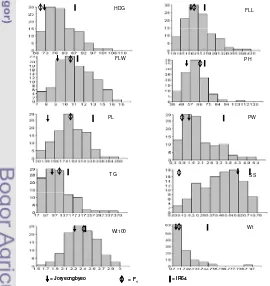
Analysis Using Dice Coefficient Based 29 3. Frequency Distribution of Several Traits in Backcross Population 33 4. Frequency Distribution of Several Traits in F2 Population 33
5. Location of QTL Detected for All Observed Trait in Backcross and F2
Mapping Population 46
LIST OF APPENDIX
1. Timeline of the Research Activities 55 2. Procedure of Making Crosses and Developing RIL Populations 57 3. The IRRI Standard Practices for Growing Rice Plant for Experiment 59 4. Molecular Analyses 61 5. Confirmation of Hybridity of F1s Using SSR Marker 69
6. Number of Alleles, Their Chromosomal Locations and Polymorphic
Information Content (PIC) Value Across 12 Rice Genotypes 73 7. Characteristics of SSR Markers Used in the Mapping Populations 80 8. Methods of Iron and Zinc estimation in Polished Rice Grains 82 9. Pictures Showing Some Activities in Action 93 10. Mean Data for Various Traits for Backcross and F2 Mapping
Populations 97 11. Marker Segregation in Backcross and F2 Mapping Populations 103
12. Quantitative Trait Loci for Some Agronomic Traits Detected in Backcross and F2 Mapping Populations 108
13. Quantitative Trait Loci for Iron and Zinc Contents in Polished Rice
LIST OF ABBREVIATIONS
Add Additive
AFLP Amplified Fragment Length Polymorphism BC Back Cross
CAPS Cleaved Amplified Polymorphic Sequence Chr Chromosome
CIM Composite Interval Mapping cM centi Morgan
DH Doubled haploid DNA Deoxyribo Nucleic Acid dNTPs Deoxynucleotides triphosphate Dom Dominant
ICP Inductively Coupled Plasma IDA Iron Deficiency Anemia
MAS Marker-Aided Selection, Marker-Assisted Selection MW Molecular Weight
NADP Nicotinamide-Adenine Dinucleotide Phosphate PCR Polymerase Chain Reaction
PMC Pollen Mother Cell Pos Position
QE Interaction of QTL x Environment QTL Quantitative Trait Loci
RAPD Random Amplified Polymorphic DNA RFLP Restriction Fragment Length Polymorphism RIL Recombinant Inbred Lines
SIM Simple Interval mapping SMR Single Marker Regression SSR Simple Sequence Repeats UV Ultra Violet
LIST OF ABBREVIATION OF SOME OBSERVED TRAITS
Fe Iron Content of polished rice grains FLL Flag Leaf Length
FLW Flag Leaf Width HD Heading Date PH Plant Height Hv Harvesting Date PL Panicle length PW Panicle Weight SS Seed Set
TG Total of grain number per panicle Wt Weight of grain per plant
Wt100 Weight of 100 grains
I. INTRODUCTION
Micronutrient malnutrition is recognized as a massive and rapidly growing public health issue especially among poor people living on an unbalanced diet dominated by a single staple grain such as rice. Among the major micronutrient deficiencies common in rice-consuming countries are: iron and zinc deficiencies. It is estimated that more than 3 billion people in the developing world are iron deficient. The problem for women and children is more severe because of their physiological need. Iron deficiency during childhood and adolescence impairs physical growth, mental development and learning capacity. On the other hand in adults, it reduces the capacity to perform physical tasks. Billions of people are at risk for zinc deficiency. Zinc deficiency is more extensive in developing countries where more than 60 per cent of the population is at risk (www.harvestplus.org). Zinc is a component of more than 300 enzymes that are needed to repair wounds, maintain fertility, synthesize protein, and boost immunity among many functions important in human health. Symptoms of zinc deficiency are subtle and often include stunted growth, eczema, hair loss, delayed sexual maturation and impaired mental development (Mares-Perlman et al. 1995). The cost of micronutrient deficiencies in terms of lives lost and quality of life are enormous.
Some strategies to address micronutrient deficiencies include supplementation and fortification which are continuing to address this problem. However, breeding staples such as rice with high micronutrient content dubbed as ‘biofortification’ has evolved as a new strategy to address micronutrient malnutrition. Biofortification provides a cost effective and sustainable solution to combat malnutrition (Bouis 2004). Since the poor in many low-income Asian countries consume large amounts of rice, improving its micronutrient content for these two micronutrients shall address to a large extent the micronutrient deficiency-induced health problems.
The recent development of DNA markers in rice has provided powerful tools in assessment of genetic variation. Microsatellite markers are the markers of choice for many breeding and genetic applications including assessment of genetic diversity because of several reasons such as abundance, higher degree of polymorphism, cost-effectiveness, codominance and wide genomic distribution among others (Panaud et al. 1995, Akagi et al. 1996, Lapitan et al. 2007 and Edwards & McCouch 2007). Furthermore, a saturated map of SSR (Simple Sequence repeats) markers in rice with 2240 validated and another 52,845 SSR markers is available (McCouch et al. 2002 and Zhang et al. 2007).
In the present study promising germplasm possessing high zinc and iron content along with some nutritionally rich Korean cultivars and some popular indica rice varieties were analyzed using SSR markers and selected parents were
used to develop mapping populations aimed at studying the genetic control of these traits.
Objectives of the study were to:
• Assess molecular diversity for grain nutritional traits among promising
germplasm.
• Identify suitable parents for developing mapping populations
• Map QTLs (Quantitative Trait Loci) for iron and zinc contents in polished
rice grain.
• map QTLs for some agronomic and yield related traits.
Hypotheses:
• Existence of ample molecular variation in the materials used in this study. • Polymorphic SSR markers are widely distributed on the rice genome, suitable
for QTL mapping studies.
• Quantitative Trait Loci for grain iron and zinc contents in polished rice grains
exist.
II. REVIEW OF LITERATURES 2.1. Variation of Iron and Zinc Contents in Rice Grain
In 1992 The International Rice Research Institute (IRRI) began to examine the effect of soil characteristics on the iron content of rice grain. This effort was expanded in 1995 as a part of a program of the Consultative Group for International Agriculture Research (CGIAR) aimed at improving the iron and zinc contents in rice grains (Gregorio et al. 2000).
Senadhira (1997) and Htut et al. (2001) reported from preliminary studies at IRRI that variation of grain iron and zinc contents existed in rice and was large enough to undertake breeding for enhanced high iron and zinc content in rice grains. Similar results were also reported by Gregorio et al. (2000), Gregorio (2002) and Welch and Graham (2002) from the evaluation of nearly 7,000 samples. The iron content ranged from 6.3 ppm to 24.4 ppm with a mean value of 12.2 ppm and zinc varied from 13.5 ppm to 58.4 ppm with a mean value of 25.4 ppm in brown rice (beras pecah kulit, Indonesian). Popular cultivars contained about 12 ppm iron and about 25 ppm zinc in brown rice. Some traditional varieties have double these amounts. A comparison of aromatic and non aromatic varieties grown under similar conditions showed that aromatic rices were consistently higher in grain iron content and often also in zinc content. Hanarida et al. (2002) also evaluated 251 rice genotypes (local varieties, advanced lines, and improved varieties) and reported high variability for iron (6.8 ppm – 18.6 ppm) and zinc (16.5 ppm – 43 ppm) contents in rice grains. Furthermore, Hanarida (2003) reported iron content between 7.1 ppm and 26 ppm and zinc content between 16 and 122 ppm from a set of 440 accessions.
2.2. Genetics and Breeding for High Iron and Zinc Content in Rice Grain
results showed that the rice grain iron content is a quantitative trait. Therefore, selection in the later generations would be more fruitful.
Analysis of combining ability indicated a high and significant general combining ability. This suggests that some donor parents might yield superior progenies with a range of recipient parents possessing high iron content. Specific combining ability is also present indicating specific combination between parents (e.g. Azucena x Basmati 370) would produce higher iron content in the F1
progeny. The presence of reciprocal effects suggest the importance of the choice of female parent. For example, Tong Lang Mo Mi produced higher-iron content in the progenies when used as female parent (Gregorio & Htut 2003). Furthermore, they reported that grain iron analysis of selected F1 crosses
showed very high iron, suggesting the high potential of these crosses to produce recombinant with high iron content.
Gregorio et al. (2000) studied the genetics of iron content using four traditional high iron rice varieties, three advanced lines and three released varieties (IR36, IR64, IR72) and reported highly significant differences between the crosses and parents. It clearly indicated that selection among F1 progenies is
possible. The genetic analysis of variance revealed the presence of additive gene action in addition to a significant non-additive genetic variance. Environmental effects were also present, but their magnitude was smaller than the genetic effects. The narrow sense heritability of the traits were found to be moderately low (43%) and broad-sense heritability is relatively high (88%) which provided further confirmation of the importance of a non-additive type gene action.
Based on the above inheritance studies, it is apparent that selection during breeding should be practiced in a later generation (such as F5), when the
Because of the influence of environment and cultural practices on iron content, selection should be done in an optimum environment such as application of N and P to maximize genetic variability (Gregorio et al. 2000).
Breeding can improve the nutritional quality of crops. The philosophy of breeding for nutritional improvement is well developed and perceived. However, an important requirement is that improved varieties with nutritional characteristics must meet farmer’s agronomic criteria. When increasing micronutrients such as iron and zinc in the grains, improvement of both nutritional and agronomic traits should be practiced. High micronutrient content in the seed will certainly permit rapid crop establishment, especially in nutrient-deficient soil. The seed is the main mineral nutrient source for seedlings and the seed iron content is high in plants adapted to soils that are low in available iron (Gregorio & Htut, 2003).
If these micronutrients could be incorporated through breeding in a staple food crop such as rice, expenditures for a micronutrient intervention program could decrease markedly. Although rice is not considered to be a major mineral supplier, any increase in its mineral content could help significantly reduce the iron- and zinc-deficiency problem (Gregorio & Htut, 2003).
A high iron trait can be combined with high yielding traits. This has already been demonstrated by breeders at IRRI. They crossed a high-yielding variety (IR72) with a tall, traditional variety (Zawa Bonday) from India. From which they identified an improved line (IR68146-3B-2-2-3) with a high content of grain iron (about 21 ppm in brown rice). This elite line has good tolerance to rice tungro virus and acceptable grain quality. The yield is about 10% below than IR72, but in compensation, maturity was earlier. This variety has good tolerance to soil deficient in minerals such as phosphorous, zinc and iron. It has no seed dormancy and has excellent seedling vigour, suggesting that it would be a good direct seeded rice (Gregorio et al. 2000).
More than 100 crosses were made and advanced in the IRRI breeding nurseries. Early generation selection was done for yield, good plant type, and resistance to diseases, but no selection was done for high micronutrient till the later generation, F or F . The aim in this breeding program is to develop high-6 7
yielding adaptable varieties with enhanced iron and zinc in the grain (Gregorio & Htut 2003).
A previously genotyped rice population was used to tag the genes (QTLs) for the high-Fe trait in brown rice. A total of 180 polymorphic markers (including 146 restriction fragment length polymorphism, RFLP, 8 isozymes, 14 random amplified polymorphic DNA, RAPD, and 12 cloned genes) on a linkage map of doubled-haploid-derived lines from the cross between IR64 and Azucena. hree QTLs were located on chromosome 7, 8, and 9 and explaining 19% to 30% variation for iron content. Three QTLs for aroma were also reported on chromosome 3, 7, and 8 explaining 16% to 38% variation. Thus, these QTLs for high iron and aroma have been suggested to be linked (Gregorio et al. 2000).None of the above studies mapped genes/QTLs in polished rice grains. Quantitative Trait loci for zinc content in germinating seeds was located on chromosome 5 (Avendano, 2000) in a study involving 93 F RILs and 31 SSR markers. 8
2.3. Genetic Basis of Mapping Genes/QTLs
Stoskopf et al. (1993) explained that a cross between homozygous parents will result in F1 with the same degree of uniform heterozygosity for each locus
but with homogeneous phenotype. Selfing of F results F1 2 that have the
maximum amount of variability among segregating population. The amount of variability in the F2 generation is determined by the number of segregating genes
(the number of genes that are different between the two parents), and gene linkage. As the number of different genes distinguishing the parents increases, the number of possible genotypes expected in the F2 generation increases, as
could be seen in the formula:
= 3n Number of different genotypes in F2
n= number of heterozygous loci.
For example, if there are 10 heterozygos loci, there would be 59,049 different genotypes. F2 population provides a huge variability for selection for the desired
traits for breeding and it provides also the maximum variation for mapping purposes. Harushima et al. (1988) reported a genetic map of rice (Oryza sativa L.) using 186 F2 plants from a single cross between Nipponbare (japonica) and
cM. The high-resolution of the genetic map permitted for the characterization of meiotic recombinations in the whole genome. Positive interference of meiotic recombination was detected both by the distribution of recombination number per each chromosome and by the distribution of double crossover intervals..
F2 population was used for mapping of heading date and awn length in a
cross between Hwaseongbyeo and WH29001. WH29001 was advanced backcross line having introgression segment from Oryza minuta. The 197 F2
plants and 197 F3 families were evaluated and two QTLs were reported by Linh et
al. (2006). Li et al. (2007) reported the utilization F2 population to fine map the
mutant of semi-sterility and anther indehiscence that controlled semisterility in some crosses.
plants could be planted to get F
F2 3 and the subsequent selfing generations to
get homozygous and stabile lines to be used for mapping (Recombinant Inbred Lines) or breeding (advanced elite lines). By selfing in subsequent generations, the homozygocity of the loci increase and after m generation of selfing, the proportion of homozygous individuals from n segregating loci is given by
m
For qualitatively inherited traits such as vertical resistance, maturity, and dwarfing genes, the genetic composition in any inbred generation can be obtained by expanding the binomial
For example if there were four loci heterozygous, there would be 88.1% of plant homozygous for all the four loci at F6 generation. With the increase in the
number of heterozygous loci, more number of generations are needed to fix all the loci (Stoskopf et al. 1993).
F1 population could also be crossed to the recurrent parent termed as
backcrossing. The proportion of genes from the donor parents is reduced by one half following each generation of backcrossing. The content of donor parent is given by the relationship (1/2)n, where n is equal to the number of backcrosses to the recurrent parents. On the other hand, the proportion of homozygosity in a particular generation, m, is given by the relationship
m m
2 1 2 −
Backcrossing results in effective recombination only in the gametes of the hybrid progeny and not in the gametes coming from recurrent parent. The lack of effective recombination in the recurrent parent is due to the homozygous nature of that parent in a self-fertilized species. Backcrossing could be used to incorporate traits from donor parent with good enough recovery of the recurrent parent feature (Stoskopf et al. 1993).
Backcross population has been used as a mapping population. Xiao et al. (1998) reported that 300 families of BC2 population (V20A/O.
rufipogon//V20B///V20B////Ce64) had been used to map 68 QTLs for 12
agronomically important traits. A set of 122 RFLP and microsatellite markers was used to identify the QTLs. Mei et al. (2005) reported the utilization of 254 RILs of Lemont/Teqing and two backcross hybrid BC F1 1 of that RIL to study the
gene action controlling several traits, such as heading date, plant height, flag leaf length, flag leaf width, panicle length, and spikelet fertility. Backcrossing has also been used to introgress traits assisted by molecular marker termed as Molecular Assisted Backcrossing (Hospital 2005).
2.4. Molecular Markers and QTL Mapping
There are three kinds of markers, morphological (plant traits), biochemical (proteins and isozymes), and molecular (DNA/RNA). These have been used to construct genetic maps and marker assisted selection. Morphological markers are limited in number, influenced by the environment, developmental stage and sometimes have pleiotropic effects. Isozymes markers offer more polymorphism but their number is limited. Scoring of both of these marker types depends on gene expression, which may be sensitive to environmental influence, genetic background, stage of plant development, and tissue type. Both types of markers have limited abundance (Van Den Berg et al. 1997).
pleiotropic effects and are unaffected by the environment and express at all developmental stages. Majority of DNA polymorphisms are selectively neutral. The genetic variation can result from of a simple point mutation, DNA insertion/deletion event or change in repeat copy number at some microsatellites or termed as SSR (Brar 2002). The most commonly used molecular markers are: SSR, AFLP, and RAPD (Sasaki 2002).
The first generation of molecular markers-RFLP (Restriction Fragment Length Polymorphisms) were discovered in 1974. RFLP markers are developed by extracting nuclear DNA and digesting it with a restriction enzyme. The resulting restriction fragments are separated according to size by electrophoresis, denatured, and transferred onto a solid support such as a nitrocellulose or nylon filter. The DNA fragments are then hybridized with radioactive- or hapten-labelled probe DNAs. The results are visualized by X-Ray film or fluorescence. Different DNA gives specific product, and it is genetically inherited (Van Den Berg et al. 1997). However, this technique requires large amount of DNA, and is relatively tedious and expensive.
The potential of using markers for the construction of complete genetic linkage maps was recognized soon after. The power of RFLPs resides in their ability to directly reveal differences in the nucleic acid base sequences of homologous chromosomes. Unlike scoring of conventional morphological and biochemical markers, scoring of RFLPs does not depend on gene expression. RFLPs are numerous, insensitive to the influence of environment and genetic background, developmentally stable, often inherited in a simple Mendelian fashion, and alleles are usually co-dominant (Van Den Berg et al. 1997).
The invention of PCR technique ushered in the availability of markers for practical applications. PCR is the technique involving denaturization, annealing and amplifcation of DNA in the presence of dNPTs, Taq polymerase primers and buffer. The process is generally repeated thirty times typically in a thermocycler and produces more than 1 x 10⁹ copies of amplified DNA fragments (Innis et al. 1990).
Random Amplified Polymorphic DNA (RAPD) technique uses a single primer that bind to specific sites of DNA and amplifies sequences flanked
between primer binding sites. Primers are typically decamers and don’t require sequence information and several sets of primers are readily available from biotechnological companies such as Operon. The amplified products are separated according to the length of fragment by electrophoresis. The DNA fragments are stained by ethidium bromide, and visualized by exposure to ultra violet light (Waugh 1997, Karp et al. 1997).
Another PCR based approach is called AFLP and is in fact a combination of RFLP and RAPD. Firstly DNA is restricted by two-restriction enzymes follwed by ligation with adapters. Using appropriate primers, the restricted DNA is amplified with PCR. Amplicons are stained and visualized similar to RAPD technique (Karp et al. 1997).
Simple sequence repeats (SSR) markers generate variation based on the variable number of simple-sequence DNA repeats. Primers are designed to get the simple sequence repeats as PCR amplification product. SSR markers need prior sequencing of the DNA to design primer pairs in conserved regions. SSR markers are co-dominant, contrary to RAPD which are dominant in nature. SSR markers can distinguish different alleles of a locus that make it more powerful. Therefore, SSRs have become the markers of choice for a wide spectrum of genetic, population, and evolutionary studies (Powell et al. 1996).
Simple Sequence Repeats markers are simple, tandem repeated of di- to tetra-nucleotide sequence motifs flanked by unique sequences. They are valuable as genetic markers because they are co-dominant, detect high levels of allelic diversity, and easily and economically assayed by PCR techniques. SSR is a co-dominant marker like RFLP, but is much easier to detect by the PCR and allows detection of more alleles than RFLP (Sasaki 2002).
provide evidence that amplification in wild relatives of Oryza sativa is generally reliable (McCouch et al. 1997).
Simple Sequence Repeats markers have been established by screening a genomic library with a synthetic DNA containing a target repeat, and then by designing PCR primers flanking repeat sequences from the positive clones. As the genomic sequence of rice is gradually generated, more SSR markers should be easily found and widely used. Currently, a total of 2240 unique experimentally validated SSR markers are available in rice, or approximately one SSR every 157 kb (McCouch et al. 2002).
The total number of co-dominant markers such as RFLP, SSR or CAPS (Cleaved Amplified Polymorphic Sequence) so far published is about 5000. This means that the average marker density within the rice genome is one marker in every 80 kb (Sasaki 2002). Recently, 18,828 SSR markers have been identified and annotated on rice genome International Rice Genome Sequencing Project (2005).
Genetic maps are constructed using mapping populations such as F2,
Backcross, Doubled Haploid, and Advanced Backcross population or Recombinant Inbred Lines (RIL). Mapping populations are derived from parents those are genetically distinct, such as japonica and indica varieties. This combination is generally chosen to generate more polymorphism. Sasaki (2002) reported that the frequency of polymorphism observed within the cross of japonica varieties decreased to 10–30% compared to that obtained between
crossing japonica and indica rice varieties.
Molecular markers are of great value in applying genetic technologies to crop improvement such as determining genetic diversity, marker assisted selection, gene-pyramiding, QTL mapping, map-based cloning of important genes, monitoring introgression from exotic and wild species germplasm, DNA fingerprinting of crop germplasm and pathogen populations (Brar 2002). One of the most important applications of DNA markers and molecular linkage maps is to dissect the genetic variation of quantitative traits into individual Mendelian factors through QTL mapping analyses (Li 2001).
Quantitative Trait Loci mapping can be defined as the marker-facilitated genetic dissection of variation of complex phenotypes through appropriate experimental design and statistical analyses of segregating materials. In QTL mapping, genes controlling genetic variation of quantitative traits in segregating populations are resolved into individual Mendelian factors by detecting marker-trait associations. The primary objective of a QTL mapping experiment is to understand the genetic basis of specific quantitative traits by determining the number, locations, gene effects, and actions of loci involved and their interactions with other loci (epistatic) and with environments (QTL x environment, or QE, interactions). Another major purpose of QTL mapping is to identify DNA markers diagnostic for particular phenotypes of interest so that marker-aided selection (MAS) can be used to efficiently manipulate progenies carrying alleles for target traits grown under non target environments (Li 2001).
Most important traits dealt with by plant breeders are quantitative in nature. The classical multiple-factor hypothesis considered the continuous variation of quantitative traits as the collective effects of many genes, each with a small effect (Mather & Jinks 1982). Most of the yield traits are polygenically inherited and are strongly influenced by the environment. Therefore, determination of genotypic values from phenotypic expression is not precise and selection strategies must take into account low heritability. Breeders generally select for yield when uniform breeding lines are obtained. Up to now, it has not been possible to select for individual QTL having positive effect on yield in segregating populations. Recently individual QTL for yield component traits have been tagged with molecular markers in rice. Quantitative Trait Loci for several traits in rice such as blast resistance, salinity tolerance, submergence tolerance and root traits (length, thickness, dry weight and root shoot ratio) have also been identified and tagged using linked molecular markers (Khush & Virk 2002).
traits such as yield can be facilitated via molecular marker technology (Khush & Virk 2002).
Although each marker system is associated with some advantages and disadvantages, the choice of marker system is dictated to a large measure by the intended application, convenience and the cost involved. High throughput approaches have also been developed, thus making it possible to scale-up the use of some of these markers.
2.5. The Physiology of Iron and Zinc in Rice Plants
In green leaves, 80% of the iron is localized in the chloroplast regardless of the iron status of the plant. In plant cells, iron is located and accumulated in the stroma of plastids as phytoferritin. It is characterized by high metabolic activity. Iron also has important function in solute transportation (e.g. phloem loading). The rhizodermal transfer of iron in deficient roots are most likely the sites of H+ -efflux pumps and the release of phenolic compounds. After the supply of iron is restored, the transfer cell degenerates within 1 or 2 days. Iron deficiency is a worldwide problem in crop production in calcareous soil. Iron toxicity is the second most severe yield-limiting factor in wetland rice (Marschner 1986).
Iron is an important component in many plant enzyme systems, such as cytochrome oxidase (electron transport) and cytochrome (terminal respiration step). Iron is a component of protein, ferridoxin. Iron is required for nitrate (NO ) and sulfate (SO ) reduction, nitrogen (N3 4 2) assimilation, and energy (NADP)
production. Iron is a catalyst or part of an enzyme system associated with chlorophyll formation. Iron affects to protein synthesis and root tip meristem growth. The majority of plant iron is in the ferric (Fe3+) form as ferric phospoprotein, although the ferrous (Fe2+) ion is believed to be the metabolically active form (Jones 1998).
Zinc is known to have various physiological functions in higher plants. There are appoximtely 300 enzymes in which Zn is an integral component. In these enzymes Zn has catalytic (e.g. carbonic anhydrase, carboxipeptidase, alkaline phosphatase, and phospholipase) or structural (e.g. alcohol dehydrogenase, Cu-Zn superoxidase dismutase, and RNA polymerase) function (Marschner 1986).
Beside Zn-containing enzymes, Zn is either essential for the activity, or modulates the activity of some enzymes, including dehydrogenases, aldolases, isomerases, transphosphorilases, and Zn-dependent inorganic pyrophosphatase (Zn-IPPase).
The physiological basis for micronutrient (include iron and zinc) efficiency in crop plants and the process controlling the accumulation of micronutrient in seed is not understood with any certainty. There are several barriers to overcome in genetically modifying plants to accumulate more micronutrient in their edible parts. These barriers to micronutrient uptake and distribution in plants are the result of tightly controlled homeostatic mechanism that regulate micronutrients uptake and distribution in plants assuring adequate but non toxic levels of these nutrient to accumulate in plant tissues. The first and most important barrier to micronutrient uptake reside at the root-soil interface. To increase micronutrient metal uptake by roots, the available levels of the micronutrient in the rhizosphere must be increased to allow for more absorption by root cell such as by stimulating root-cell H+, metal chelating compounds and reductants release rates, and increasing root absorptive area such as number and extent fine roots and roots hairs. Second, the root cell plasma membrane absorption mechanism must be sufficient and specific enough to allow for the accumulation of micronutrient minerals once they enter the apoplast of root cell from the rhizosphere. Third, once taken up by root cells, the micronutrients must be located efficiently to edible plant organs. For seed and grain, phloem sap loading, movement and unloading rates are important characteristics to consider increasing micronutrient metal accumulation in seed and grain (Welch & Graham 2002).
III. MATERIALS AND METHODS 3.1. Summary of Various Experimental Activities
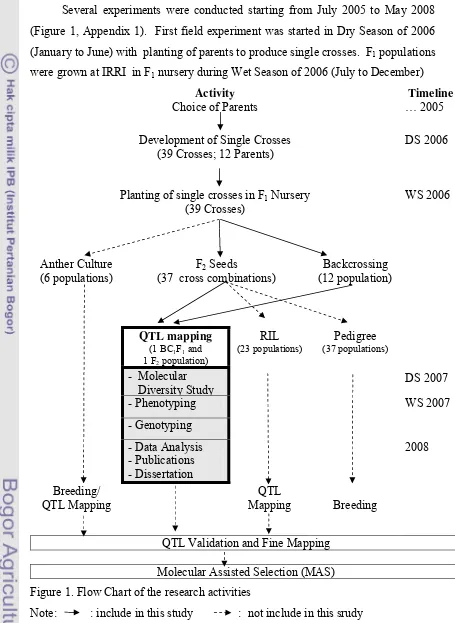
Several experiments were conducted starting from July 2005 to May 2008
(Figure 1, Appendix 1). First field experiment was started in Dry Season of 2006
(January to June) with planting of parents to produce single crosses. F1 populations
were grown at IRRI in F1 nursery during Wet Season of 2006 (July to December)
Activity Timeline
Choice of Parents … 2005
Development of Single Crosses (39 Crosses; 12 Parents)
DS 2006
Planting of single crosses in F1 Nursery
(39 Crosses)
Anther Culture (6 populations)
F2 Seeds
(37 cross combinations)
Backcrossing
QTL Validation and Fine Mapping
Molecular Assisted Selection (MAS)
Figure 1. Flow Chart of the research activities
to do backcrossing and producing F2 seeds. Planting of mapping populations were
conducted during Dry Season of 2007.
Hybridization and maintenance of the crossed plants until harvesting were
done in the screen house. Deoxyribo Nucleic Acid (DNA) of the parents and
mapping population was extracted in Dry Season 2007. Deoxyribo Nucleic Acid
sample of parents were used for screening of polymorphism using SSR markers.
Deoxyribo Nucleic Acid sample of the individuals of mapping populations was
used for genotyping using selected polymorphic markers. Sample preparation and
measurement of iron and zinc content was done in Dry Season of 2008.
Field experiment was conducted at IRRI (International Rice Research
Institute) Experimental Farm. Molecular analyses were done in GAMMA (Gene
Array and Molecular Marker Application) Laboratory, and measurement of iron
content using colorimetric method was done at Irrigated Rice Breeding Group
Laboratory and ASL. The field was located at IRRI campus, Los Banos. It was
located at latitude of 14o North, longitude of 121o East, and at an elevation of 21
meter above sea level.
Weather data were collected when the mapping populations were planted
(December 2006 to June 2007). The average rainfall during that period was 67.83
mm. The maximum, minimum, and mean of the daily temperature were 33.4, 25.1,
and 29.3oC respectively. The day length was between 11.2 and 12.8 hours during
this period. The average humidity was 83.72%. The maximum wind flow was 2.8
ms-1 during January to April 2007 (Climate Unit, Crop and Environment Science
Division, IRRI).
Tungro incidence was observed in the F2 mapping population. The infected
seedlings were removed and plant protection was provided as needed in
coordination with Experimental Farm Office.
3.2. Identification and Selection of Promising Donor Genotypes Background
Starting mid 1990s various brown rice samples were analyzed for various
minerals including iron and zinc content by Inductively Coupled Argon Plasma
Atomic Emission Spectroscopy (ICP-AES). However, rice is consumed primarily
variation for iron and zinc content in the polished rice grains. Therefore, IRRI
shifted its entire screening work to polished rice starting 2004. Scientists at IRRI
evaluated 15 promising genotypes in replicated trials at two locations (IRRI,
PhilRice (Maligaya)) and in 3 seasons (2004WS, 2005DS, 2005WS). The range of
average iron content in the polished rice was from 2.97 to 7.4 ppm with an average
of 4.75 ppm, while for zinc content the range is from 14.33 to 23.26 ppm with an
average of 20.02 ppm. These results suggested that ample genetic variation exists in
the germplasm and it would be worthwhile to breed for enhancing the iron and zinc
content in the rice grains (Virk et al. 2006; 2007).
Selection of Donor Genotypes
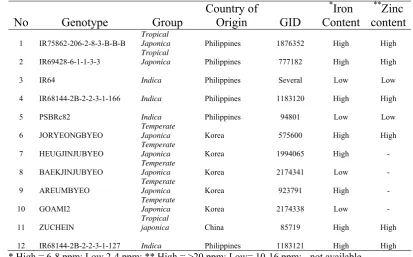
A total of twelve rice genotypes were used in this study (Table 1). Four
promising elite breeding lines namely IR75862-206-2-8-3-B-B-B,
IR69428-6-1-1-3-3, IR68144-2B-2-2-3-1-166 and IR68144-2B-2-2-3-1-127 were identified from a
multi-environmental evaluation study by Virk et al. (2006; 2007). Two popular
indica varieties namely IR64-released in 1985 and PSBRc82
(IR64683-87-2-2-3-3)-released in the Philippines in 2000 were also included as potential recipient
genotypes. In addition 2 temperate japonica varieties namely Joryeongbyeo and
Areumbyeo with high zinc content (Virk et al. 2006) and 3 nutritionally known
Korean rice varieties namely Heugjinjubyeo, Baegjinjubyeo and Goami2 (Lee et al.
2006; 2007). Lastly, a promising entry namely Zuchein from China possessing high
iron and zinc content in the brown rice was identified from previous screening
conducted at IRRI (Gregorio, Personal communication) was also included in this
study.
3.3. Materials
3.3.1. Production of F1 Hybrids
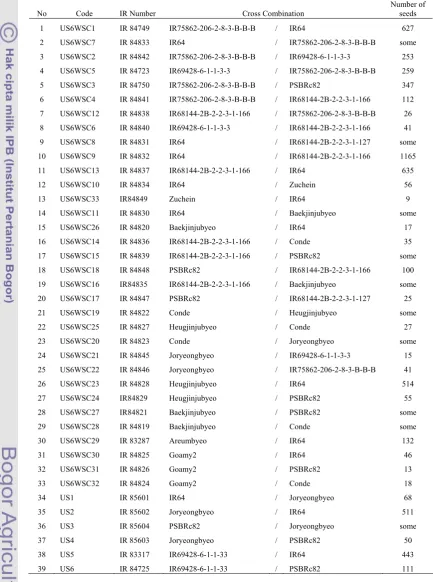
A set of 39 F1 crosses including reciprocals were produced (Table 2). The
parents of these F1s included micronutrient rich donor lines and high yielding
popular varieties (as explained in the previous section).
Table 1. A brief description of selected genotypes
Japonica Philippines 1876352 High High
2 IR69428-6-1-1-3-3
Tropical
Japonica Philippines 777182 High High
3 IR64 Indica Philippines Several Low Low
4 IR68144-2B-2-2-3-1-166 Indica Philippines 1183120 High High
5 PSBRc82 Indica Philippines 94801 Low Low
6 JORYEONGBYEO
Temperate
Japonica Korea 575600 High High
7 HEUGJINJUBYEO
12 IR68144-2B-2-2-3-1-127 Indica Philippines 1183121 High High
* High = 6-8 ppm; Low 2-4 ppm; ** High = >20 ppm; Low= 10-16 ppm; - not available
3.3.2. Production of F2 and Backcross Populations
F1 plants were planted in F1 nursery and were sekefed to produce F2 seeds. In
addition F1 plants were crossed to their respective recurrent parents to produce
seeds of backcross populations as explained below.
Preparation of the land, seeds, and establishment of plants was as per IRRI’s
standard practices (Appendix 3).
1. One row of each of the parents (as check) were planted next to the F1
populations. Recurrent parents were planted in three staggerred sowings to
synchronize flowering, i.e. two weeks before, together, and two weeks after the
F1 were planted.
2. When the seedling growth was around 2 cm (or two weeks old), one young leaf
was collected from each seedling for DNA extraction using “quick and dirty”
method (Collard et al. 2007; Appendix 4). Deoxyribo Nucleic Acid was
extracted from 15 plant of each F1 population.
3. The hybridity of F1 plants was tested using polymorphic SSR markers
(Appendix 5). SSR markers are co-dominant in nature (Powell et al. 1996) and
heterozygous F1s. Accidental selfed plants are expected to show only the
maternal allele. Accidental selfed plants were discarded.
Table 2. List of F1 successful crosses in Dry Season of 2006
No Code IR Number Cross Combination
Number of seeds
1 US6WSC1 IR 84749 IR75862-206-2-8-3-B-B-B / IR64 627
2 US6WSC7 IR 84833 IR64 / IR75862-206-2-8-3-B-B-B some
3 US6WSC2 IR 84842 IR75862-206-2-8-3-B-B-B / IR69428-6-1-1-3-3 253
4 US6WSC5 IR 84723 IR69428-6-1-1-3-3 / IR75862-206-2-8-3-B-B-B 259
5 US6WSC3 IR 84750 IR75862-206-2-8-3-B-B-B / PSBRc82 347
6 US6WSC4 IR 84841 IR75862-206-2-8-3-B-B-B / IR68144-2B-2-2-3-1-166 112
7 US6WSC12 IR 84838 IR68144-2B-2-2-3-1-166 / IR75862-206-2-8-3-B-B-B 26
8 US6WSC6 IR 84840 IR69428-6-1-1-3-3 / IR68144-2B-2-2-3-1-166 41
9 US6WSC8 IR 84831 IR64 / IR68144-2B-2-2-3-1-127 some
17 US6WSC15 IR 84839 IR68144-2B-2-2-3-1-166 / PSBRc82 some
18 US6WSC18 IR 84848 PSBRc82 / IR68144-2B-2-2-3-1-166 100
19 US6WSC16 IR84835 IR68144-2B-2-2-3-1-166 / Baekjinjubyeo some
20 US6WSC17 IR 84847 PSBRc82 / IR68144-2B-2-2-3-1-127 25
21 US6WSC19 IR 84822 Conde / Heugjinjubyeo some
22 US6WSC25 IR 84827 Heugjinjubyeo / Conde 27
23 US6WSC20 IR 84823 Conde / Joryeongbyeo some
24 US6WSC21 IR 84845 Joryeongbyeo / IR69428-6-1-1-3-3 15
25 US6WSC22 IR 84846 Joryeongbyeo / IR75862-206-2-8-3-B-B-B 41
26 US6WSC23 IR 84828 Heugjinjubyeo / IR64 514
27 US6WSC24 IR84829 Heugjinjubyeo / PSBRc82 55
28 US6WSC27 IR84821 Baekjinjubyeo / PSBRc82 some
4. True F1 plants were crossed to its resppective recurrent parents to produce
BC1F1 seeds. The crossing technique is described in Appendix 2.
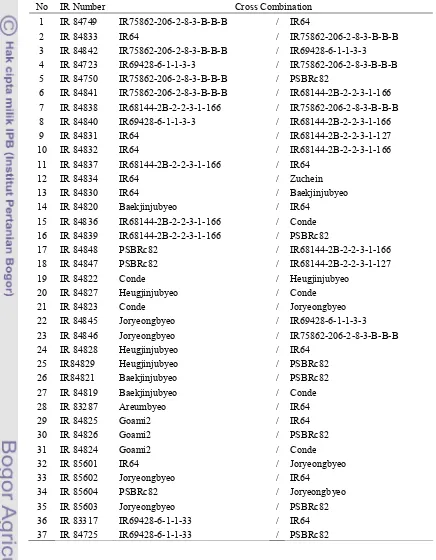
Table 3. List of F2 populations developed
No IR Number Cross Combination
1 IR 84749 IR75862-206-2-8-3-B-B-B / IR64
2 IR 84833 IR64 / IR75862-206-2-8-3-B-B-B
3 IR 84842 IR75862-206-2-8-3-B-B-B / IR69428-6-1-1-3-3
4 IR 84723 IR69428-6-1-1-3-3 / IR75862-206-2-8-3-B-B-B
5 IR 84750 IR75862-206-2-8-3-B-B-B / PSBRc82
6 IR 84841 IR75862-206-2-8-3-B-B-B / IR68144-2B-2-2-3-1-166
7 IR 84838 IR68144-2B-2-2-3-1-166 / IR75862-206-2-8-3-B-B-B
8 IR 84840 IR69428-6-1-1-3-3 / IR68144-2B-2-2-3-1-166
9 IR 84831 IR64 / IR68144-2B-2-2-3-1-127
15 IR 84836 IR68144-2B-2-2-3-1-166 / Conde
16 IR 84839 IR68144-2B-2-2-3-1-166 / PSBRc82
17 IR 84848 PSBRc82 / IR68144-2B-2-2-3-1-166
18 IR 84847 PSBRc82 / IR68144-2B-2-2-3-1-127
19 IR 84822 Conde / Heugjinjubyeo
20 IR 84827 Heugjinjubyeo / Conde
21 IR 84823 Conde / Joryeongbyeo
22 IR 84845 Joryeongbyeo / IR69428-6-1-1-3-3
23 IR 84846 Joryeongbyeo / IR75862-206-2-8-3-B-B-B
24 IR 84828 Heugjinjubyeo / IR64
25 IR84829 Heugjinjubyeo / PSBRc82
26 IR84821 Baekjinjubyeo / PSBRc82
F2 seeds from all the 39 F1 populations except two crosses namely US6
WSC16 and US6WSC33.were harvested (Table 3). One F2 population developed
from a cross between Joryeongbyeo and IR64 was selected as a mapping
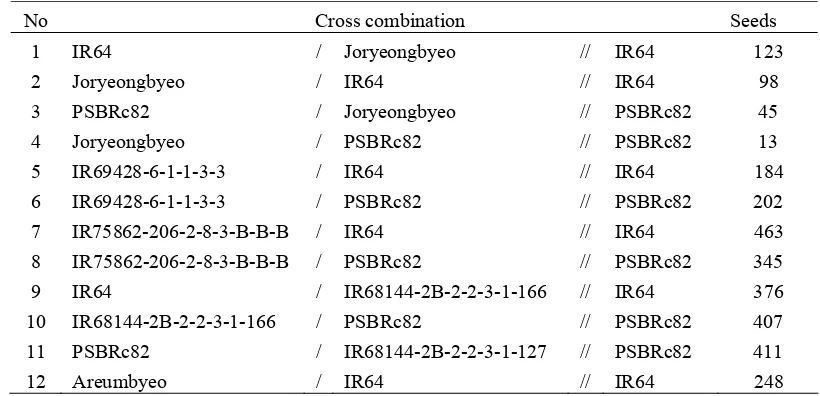
population. A set of 12 backcross populations were developed (Table 4).
Table 4. List of Backcross Populations
No Cross combination Seeds
1 IR64 / Joryeongbyeo // IR64 123
2 Joryeongbyeo / IR64 // IR64 98
3 PSBRc82 / Joryeongbyeo // PSBRc82 45
4 Joryeongbyeo / PSBRc82 // PSBRc82 13
5 IR69428-6-1-1-3-3 / IR64 // IR64 184
6 IR69428-6-1-1-3-3 / PSBRc82 // PSBRc82 202
7 IR75862-206-2-8-3-B-B-B / IR64 // IR64 463
8 IR75862-206-2-8-3-B-B-B / PSBRc82 // PSBRc82 345
9 IR64 / IR68144-2B-2-2-3-1-166 // IR64 376
10 IR68144-2B-2-2-3-1-166 / PSBRc82 // PSBRc82 407
11 PSBRc82 / IR68144-2B-2-2-3-1-127 // PSBRc82 411
12 Areumbyeo / IR64 // IR64 248
One backcross population, IR75862-206-2-8-3-B-B-B/IR64//IR64 (BC1F1
seeds) was selected to be used as a mapping population. The remaining 11
backcross populations are being used by the breeding team at IRRI for the
development of anther culture derived doubled haploids or single seed recombinant
inbred lines.
3.3.3. Development of RIL Populations
RILs are being developed by the breeding team at IRRI, for mapping and
breeding purposes. The target was to develop 200 RILs for each of the population.
RILs from 23 populations are at F5 stage (Table 5). The procedure of developing
RILs population is explained in Appendix 2.
Table 5. List of crosses from which RILs production is in progress (WS 2008 as F5)
No. IR Number Cross Combination
No. of
8 IR 84842 IR75862-206-2-8-3-B-B-B / IR69428-6-1-1-3-3 280
9 IR 84750 IR75862-206-2-8-3-B-B-B / PSBRc82 280
10 IR 84841 IR75862-206-2-8-3-B-B-B / IR68144-2B-2-2-3-1-166 246
11 IR 84723 IR69428-6-1-1-3-3 / IR75862-206-2-8-3-B-B-B 260
12 IR 84840 IR69428-6-1-1-3-3 / IR68144-2B-2-2-3-1-166 260
13 IR 84833 IR64 / IR75862-206-2-8-3-B-B-B 260
14 IR 84832 IR64 / IR68144-2B-2-2-3-1-166 280
15 IR 84839 IR68144-2B-2-2-3-1-166 / PSBRc82 264
16 IR 84847 PSBRc82 / IR68144-2B-2-2-3-1-127 280
17 IR 84845 Joryeongbyeo / IR69428-6-1-1-3-3 265
18 IR 84846 Joryeongbyeo / IR75862-206-2-8-3-B-B-B 240
19 IR 84828 Heugjinjubyeo / IR64 244
20 IR84829 Heugjinjubyeo / PSBRc82 220
21 IR 83287 Areumbyeo / IR64 215
22 IR 84825 Goami2 / IR64 147
23 IR 84826 Goami2 / PSBRc82 200
3.3.4. Mapping Populations
Following two populations from the above materials were selected as mapping
populations.
1. IR75862-206-2-8-3-B-B-B/IR64//IR64 (backcross mapping population, BC1F1).
A total of 463 seedlings were raised for this population. However, because of
poor germination and seedlings death 120 plants could be transplanted.
2. Joryeongbyeo/IR64 (F2 mapping population).
A total of 300 seeds were seeded. However because of poor seedling viability
178 plants could be transplanted.
Both populations were grown along with 15 plants of parents and F1 as
control. Planting of the materials was executed as follows:
1. Seed preparation, seedling, transplanting and maintaing the plants used the
implemented. Leaf collection for DNA extraction was done around two weeks
after transplanting.
2. At the maximum tillering stage, the plants were splitted into three equal plants
and transplanted into field following Completely Randomized Design with
three replications (clone from splitted plant as replication) and with a planting
space of 20 cm x 20 cm.
3. Sticks were used as needed to support the plants from lodging caused by strong
wind. Bird net was applied to keep the grains from birds.
4. Each mature plant was harvested separately by cutting from the base of the
stem to measure the plant height. Sun drying for five sunny days was sufficient
to get the grain moisture content of around 14%.
5. The grains were kept free from contaminants such as dust, water, and other
material that might be affecting the accuracy of measurements.
6. The grains were threshed manually and cleaned removing unfilled grains, then
kept in unfumigated seed storage until ready for iron and zinc measurements.
3.4. Molecular Methods
Details of DNA extraction, quantification, preparation of working solutions,
PCR protocol and visualization of PCR products are explained in Appendix 4.
3.4.1. Analysis of Molecular Diversity
A set of 288 SSR markers widely distributed on the rice genome were used in
this study (McCouch et al. 2002). The sequences of each of the primer pairs were
downloaded from http://www.gramene.org/microsat/ssr.html. However out the
288 SSR markers surveyed only 183 were polymorphic. The information on the
chromosomal locations, mapped positions and repeat motifs etc. for these 183 loci
is given in Appendix 6.
3.4.2. Genotyping of Mapping Populations
Based on the screening of polymorphic marker for diversity study, as many
as 95 SSR markers were selected for backcross mapping population (Appendix 7).
Similarly, a set of 74 SSR markers were selected for F2 genotyping mapping
population (Appendix 7). The scoring system was as follows.