Refer to Important disclosures in the last page of this report
StockDataTarget price (Rp) Rp4,200
Prior TP (Rp) Rp3,950
Shareprice (Rp) Rp3,920
Upside/downside (%) +7.1
Sharesoutstanding (m) 111 Marketcap. (US$ m) 29
Phillips Morris Indonesia 92.5%
Public 7.5%
Estimate Change; Vs. Consensus
2018F 2019F PT Indo Premier Sekuritas [email protected] +62 21 5793 1168
Modest Improvement
Profit grew 3.8% driven by price rises, volume recovery
Lower gross margin due to 15% excise tax hike for 2018
Upgrade earnings on higher cigarette price increase this year
Maintain Buy with higher TP of Rp4,200 (from Rp3,950)
Result in-line
.HM Sampoerna reported earnings of Rp9.6tn in 9M18 (+3.8%
yoy), in-line with our/consensus estimates while revenue grew +7% mainly driven
by cigarette price rises (ASP: +7% yoy). According to the company, cigarette
sales grew 1% yoy to 26.5bn sticks in 3Q18vs25.0bn in 2Q (1Q: 23bn). This was
in-line with industry trend of improving 3Q18 sales (80.3bn; +1.4% yoy) after
negative growth in 1H18. We suspect the sales turnaround could be due to major
events such as Asian Games and the end of fasting season. Worth to note that
this also a catalyst that Indonesian economic environment is remain strong during
9M18.
Lower gross margin
.HMSP’s gross profit margin (GPM) of 23.6% in 9M18was
slightly lower compared to last year (9M17: 24.3%) due to significant increase in
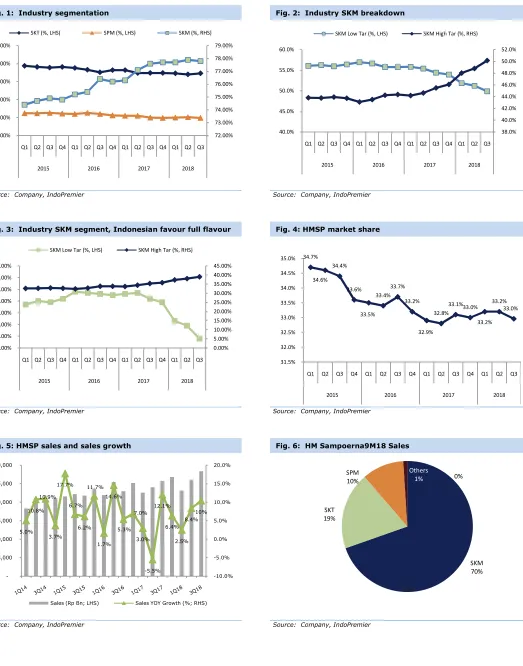
cigarette excise tax of 15% in 2018. Machine-rolled cigarettes (SPM) contributed
71%, which was higher, compared to last year (68%), which we believe can be
attributed to Dji Sam Soe Magnum Mild 16s variant that continued to perform
strong in 3Q18 with 9.4% market share ytd.
Upgrade earnings
. We upgrade our FY18F earnings by 3% as we revise up our
FY18F selling price increase to 6% from 5.5% previously. This is the result from
our findings in modern trade (MT) that they increased selling prices of HM
Sampoerna products in less than four weeks. We believe that selling price of
several products will increase higher-than-inflation.Our findings also show that the
recent trend towards e-cigaretteshas started to diminish as our findings show that
people are shifting back to conventional cigarettes due to regulated e-cigarettes
segment and expensive price point. We believe HM Sampoerna will be one of the
beneficiaries of the shifting.
Maintain BUY, upgrade TP toRp,4,100
.We maintain our Buy call for HMSP and
upgrade TP 4,200, which implies FY19F P/E of 33.5x. We believe that industry
volumes will recover despite increasing competition going forward. We expect
strong economy environment as major catalyst for the industry. Key risks for our
call are slowing macro-economy condition and higher than expected excise tax
Revenue (RpBn) 95,467 99,091 103,920 110,538 116,544 EBITDA (RpBn) 16,745 16,977 17,444 19,166 20,527
Source : HMSP,IndoPremier Share Price Closing as of : 26-October-2018
2
Refer to Important disclosures in the last page of this report
Fig. 1: Industry segmentation Fig. 2: Industry SKM breakdown
Source: Company, IndoPremier Source: Company, IndoPremier
Fig. 3: Industry SKM segment, Indonesian favour full flavour Fig. 4: HMSP market share
Source: Company, IndoPremier Source: Company, IndoPremier
Fig. 5: HMSP sales and sales growth Fig. 6: HM Sampoerna9M18 Sales
Source: Company, IndoPremier Source: Company, IndoPremier
72.00%
2015 2016 2017 2018
SKT (%, LHS) SPM (%, LHS) SKM (%, RHS)
2015 2016 2017 2018
SKM Low Tar (%, LHS) SKM High Tar (%, RHS)
2015 2016 2017 2018
SKM Low Tar (%, LHS) SKM High Tar (%, RHS)
2015 2016 2017 2018
5.0%
Sales (Rp Bn; LHS) Sales YOY Growth (%; RHS)
3
Refer to Important disclosures in the last page of this report
HMSP Result summary
9M18
9M17
yoy(%)
3Q18
2Q18
qoq(%)
% to
Ours
% to Cons
Total Sales (in RpBln)
Gross Profit (in RpBln)
Earnings (in RpBln)
Total Sales (in RpBln)
Gross Profit (in RpBln)
Earnings (in RpBln)
4
Refer to Important disclosures in the last page of this report
Year To 31 Dec (RpBn) 2016A 2017A 2018F 2019F 2020F
Income Statement
Net Revenue 95,467 99,091 103,920 110,538 116,544
Cost of Sales (71,612) (74,875) (79,387) (83,517) (87,480)
Gross Profit 23,855 24,216 24,534 27,022 29,064
SG&A Expenses (7,834) (8,104) (7,940) (8,773) (9,520)
Operating Profit 16,020 16,112 16,594 18,249 19,544
Net Interest 832 791 775 775 775
Forex Gain (Loss) 0 0 0 0 0
Others-Net 159 (9) (9) (9) (9)
Pre-Tax Income 17,011 16,894 17,360 19,015 20,310
Income Tax (4,249) (4,224) (4,340) (4,754) (5,078)
Minorities 0 0 0 0 0
Net Income 12,762 12,670 13,020 14,261 15,233
Balance Sheet
Cash & Equivalent 5,056 7,501 6,015 6,237 6,335
Receivable 4,996 3,781 4,518 4,806 5,067
Inventory 19,442 18,023 19,847 20,879 21,870
Other Current Assets 4,153 4,875 3,469 3,596 3,711
Total Current Assets 33,647 34,180 33,848 35,517 36,982
Fixed Assets - Net 6,895 6,891 6,991 7,024 6,991
Goodwill 60 60 60 60 60
Non Current Assets 1,843 1,947 1,947 1,947 1,947
Total Assets 42,508 43,141 42,909 44,611 46,043
ST Loans 0 0 0 0 0
Payable 3,871 3,666 0 4,176 4,374
Other Payables 2,537 2,787 2,392 2,517 2,636
Current Portion of LT Loans 21 29 29 29 29
Total Current Liab. 6,428 6,482 6,391 6,722 7,039
Long Term Loans 66 81 81 81 81
Other LT Liab. 1,839 2,465 2,465 2,465 2,465
Total Liabilities 8,333 9,027 8,936 9,267 9,585
Equity 21,549 21,531 20,914 20,914 20,914
Retained Earnings 12,626 12,582 13,058 14,430 15,544
Minority Interest 0 0 0 0 0
5
Refer to Important disclosures in the last page of this report
Year to 31 Dec 2016A 2017A 2018F 2019F 2020F
Cash Flow
Net Income (Excl.Extraordinary&Min.Int) 12,762 12,670 13,020 14,261 15,233
Depr.& Amortization 595 598 850 917 983
Changes in Working Capital 126 624 (860) (1,229) (1,158)
Others (3,443) 1,144 559 (1,161) (662)
Cash Flow From Operating 10,040 15,036 13,569 12,788 14,396
Capital Expenditure (1,252) (698) (950) (950) (950)
Others 854 815 800 800 800
Cash Flow From Investing (398) 117 (150) (150) (150)
Loans (608) 23 1 0 0
Equity (19) (18) 0 0 0
Dividends (10,352) (12,527) (12,543) (12,890) (14,119)
Others 361 600 (642) (25) (25)
Cash Flow From Financing (10,618) (11,922) (13,185) (12,915) (14,144)
Changes in Cash (976) 3,231 234 (277) 102
FinancialRatios
Gross Margin (%) 25.0 24.4 23.6 24.4 24.9
Operating Margin (%) 16.8 16.3 16.0 16.5 16.8
Pre-Tax Margin (%) 17.8 17.0 16.7 17.2 17.4
Net Margin (%) 13.4 12.8 12.5 12.9 13.1
ROA (%) 31.7 29.6 30.3 32.6 33.6
ROE (%) 38.6 37.1 38.2 41.1 42.4
ROIC (%) 40.6 39.4 40.5 43.3 44.5
Acct. Receivables TO (days) 18.6 16.2 14.6 15.4 15.5
Acct. Receivables - Other TO (days) 0.0 0.0 0.0 0.0 0.0
Inventory TO (days) 3.7 4.0 4.2 4.1 4.1
Payable TO (days) 18.0 18.4 17.6 17.8 17.8
Acct. Payables - Other TO (days) 0.0 0.0 0.0 0.0 0.0
Debt to Equity (%) 0.3 0.3 0.3 0.3 0.3
Interest Coverage Ratio (x) 0.0 0.0 0.0 0.0 0.0
Net Gearing (%) (14.5) (21.7) (17.4) (17.3) (17.1)
Head Office
PT INDO PREMIER SEKURITAS
WismaGKBI 7/F Suite 718
Jl. Jend. Sudirman No.28
Jakarta 10210 - Indonesia
p +62.21.5793.1168
f +62.21.5793.1167
INVESTMENT RATINGS
BUY : Expected total return of 10% or more within a 12-month period HOLD : Expected total return between -10% and 10% within a 12-month period SELL : Expected total return of -10% or worse within a 12-month period
ANALYSTS CERTIFICATION.
The views expressed in this research report accurately reflect the analysts personal views about any and all of the subject securities or issuers; and no part of the research analyst's compensation was, is, or will be, directly or indirectly, related to the specific recommendations or views expressed in the report.
DISCLAIMERS