Refer to Important disclosures in the last page of this report
Industry vol. might stay low as 1H18’s result was not too impressive
SKM-LT faces increasing troubles from public smoking ban and vaping
Capitalizing HMSP’s flagship brand to capture bigger customer base
Re-initiate at BUY with TP of Rp3,950 (based on target P/E of 32.5x)
Minimal sign of recovery. Industry volume was in negative growth territory since 1H16, albeit moderating, declining only by 1.5% yoy in 1H18 (vs. -6.7% in 1H17). Volume declined by 0.7% in 2Q18 (vs. 1Q18: -2.4%; 2Q17: -9.4%), signaling minor improvement in cigarette consumption. Industry volume is expected to pick-up in 2H18 by 10% from 144.5bn in 1H18, mimicking general trend from last year (2H17: +9.5%), as manufacturers are pilling-up inventories for year-end to avoid possibility of higher excise in fiscal budget 2019 which to be announced next month, with expectation for 10% hikes in excise for 2019F (vs. 2018: 10.0%; 2017:10.5%; 2016: 14.2%).
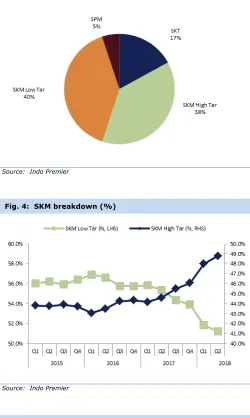
SKM-LT volume growth slumped. We still expect industry volume to drop further, by -1.5% FY18F (vs-0.9% FY17), due to further volume decline in the hand-rolled share dropped to 40.1% of market in 1H18 (vs. 42.6% in 1H17). The decline might be due to the impact of public smoking ban that restrict people from smoking in social environments and rising popularity of vaping, particularly in the urban areas.
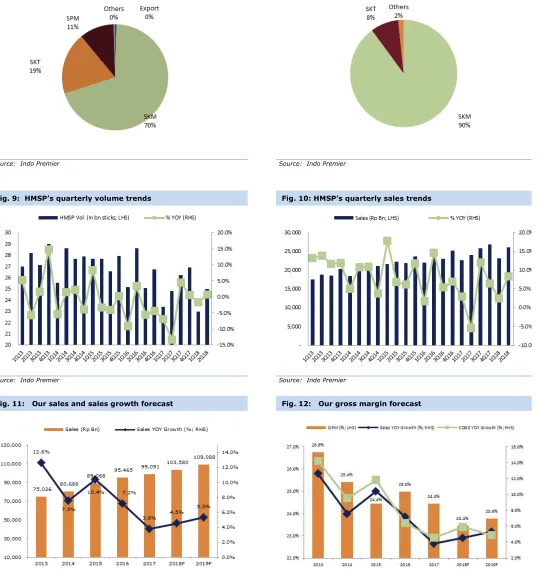
Aiming for bigger share. HMSP managed to book better-than-industry-performance, recording +0.9% volume growth in 2Q18 (vs. 1Q18:-1.7%; 2Q17: -13.3%), bringing 1H18 volume to 48mn sticks, or -0.4% yoy (vs 1H17: -10.3%). Sales improved by 8.4% in 2Q18 (vs 2.5% in 1Q18; 2Q17: -5.5%), which indicated HMSP’s strong pricing power to keep positive sales growth trends. HMSP’s market share increased to 33.2% in 1H18 from 32.9% last year, in-line with improvement in market share of Dji Sam Soe (DJJ). DJJ is HMSP’s flagship in the SKT category, only last year HMSP launched DJJ Magnum Mild 16s variant under its SKM category. While, it is our view that HMSP’s position might not too favorable compare to GGRM, due to HMSP’s lower exposure to SKM-FF category (HMSP: 40% vs GGRM: 60%), we view HMSP’s strategy to use DJJ in the SKM category as a positive catalyst. We expect HMSP’s position in the SKM to improve, as HSMP has larger products portfolio, complementing its two pioneer’s brands, Sampoerna A (SKM-FF) and Sampoerna U (SKM-LT), while at the same time creating mid-price-SKM-product to capture bigger customer based.
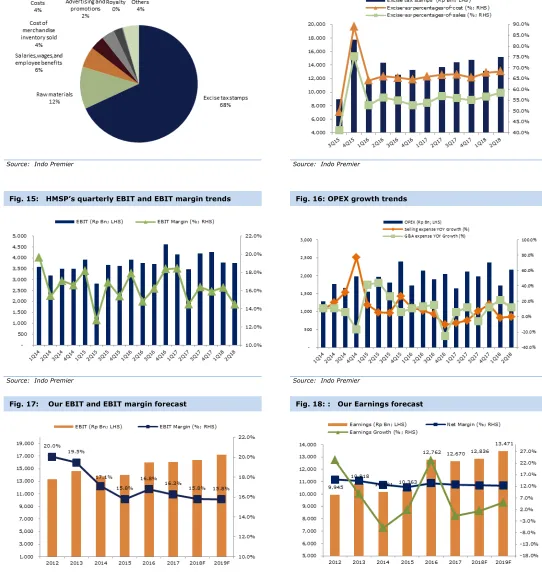
Valuations. We re-initiate coverage with BUY rating and TP of Rp 3,950, which is based on our target P/E of 32.5x, in-line with HMSP’s 5 years average. We expect sales growth of 4.3%/5.3% FY18F/FY19F (vs. CAGR 7.1% over FY14-FY17) and GPM of c.24% (vs. 25% over FY15-FY17), assuming 9% average increase in excise for FY19F in our model. We expect HMSP’s EBIT margin to remain at c.16%, in-line with HMSP’s 3 years average, as we expect company to maintain its selling expense stable, as evident in OPEX-to-sales ratio that continued to decline to 7.9% in 1H18 (vs 8.3% over FY15-FY17). HMSP’s share price has underperformed the overall market index due to industry weak sales growth. Today, stock traded at 1.5-SD below HMSP’s trading average. Thus, any positive news could trigger share price acceleration, in our view.
HM Sampoerna
(
HMSP IJ
)
15 August 2018
Re-initiate coverage
BUY
Year To 31 Dec 2016A 2017A 2018F 2019F 2020F
Revenue (RpBn) 95,467 99,091 103,580 109,088 115,016
EBITDA (RpBn) 16,745 16,977 17,199 18,112 19,421
Source : HMSP, IndoPremier Share Price Closing as of : 14-August-2018
2
Refer to Important disclosures in the last page of this report
Fig. 1: Indonesia’s cigarette production Fig. 2: Industry breakdown (%) as of 2Q18
Source: Indo Premier Source: Indo Premier
Fig. 3: Industry segmentation (%) Fig. 4: SKM breakdown (%)
Source: Indo Premier Source: Indo Premier
Fig. 5: HMSP’s market share Fig. 6: HMSP’s market share in each segment
3
Refer to Important disclosures in the last page of this report
Fig. 7: HMSP’s sales breakdown as of 1H18 Fig. 8: GGRM’s sales breakdown as of 1Q18
Source: Indo Premier Source: Indo Premier
Fig. 9: HMSP’s quarterly volume trends Fig. 10: HMSP’s quarterly sales trends
Source: Indo Premier Source: Indo Premier
Fig. 11: Our sales and sales growth forecast Fig. 12: Our gross margin forecast
4
Refer to Important disclosures in the last page of this report
Fig. 13: HMSP’s cost structure as of 1H18 Fig. 14: HMSP’s excise expense trends
Source: Indo Premier Source: Indo Premier
Fig. 15: HMSP’s quarterly EBIT and EBIT margin trends Fig. 16: OPEX growth trends
Source: Indo Premier Source: Indo Premier
Fig. 17: Our EBIT and EBIT margin forecast Fig. 18: : Our Earnings forecast
5
Refer to Important disclosures in the last page of this report
Year To 31 Dec (RpBn) 2016A 2017A 2018F 2019F 2020F
Operating Profit 16,020 16,112 16,349 17,195 18,438
Net Interest 832 791 775 775 775
Cash & Equivalent 5,056 7,501 5,868 5,598 5,654
Receivable 4,996 3,781 4,503 4,743 5,001
Inventory 19,442 18,023 19,824 20,787 21,777
Other Current Assets 4,153 4,875 3,462 3,568 3,681
Total Current Assets 33,647 34,180 33,657 34,696 36,113
Fixed Assets - Net 6,895 6,891 6,991 7,024 6,991
Goodwill 60 60 60 60 60
Non Current Assets 1,843 1,947 1,947 1,947 1,947
Total Assets 42,508 43,141 42,718 43,790 45,174
ST Loans 0 0 0 0 0
Payable 3,871 3,666 0 4,157 4,355
Other Payables 2,537 2,787 2,390 2,506 2,625
Current Portion of LT Loans 21 29 29 29 29
Total Current Liab. 6,428 6,482 6,384 6,692 7,009
Long Term Loans 66 81 81 81 81
Other LT Liab. 1,839 2,465 2,465 2,465 2,465
Total Liabilities 8,333 9,027 8,929 9,238 9,555
Equity 21,549 21,531 20,914 20,914 20,914
Retained Earnings 12,626 12,582 12,875 13,638 14,705
Minority Interest 0 0 0 0 0
Total SHE + Minority Int. 34,175 34,113 33,789 34,552 35,619
Total Liabilities & Equity 42,508 43,140 42,718 43,790 45,174
6
Refer to Important disclosures in the last page of this report
Year to 31 Dec 2016A 2017A 2018F 2019F 2020F
Cash Flow
Net Income (Excl.Extraordinary&Min.Int) 12,762 12,670 12,836 13,471 14,403
Depr. & Amortization 595 598 850 917 983
Changes in Working Capital 126 624 (821) (1,105) (1,152)
Others (3,443) 1,144 559 (1,164) (669)
Cash Flow From Operating 10,040 15,036 13,425 12,119 13,564
Capital Expenditure (1,252) (698) (950) (950) (950)
Others 854 815 800 800 800
Cash Flow From Investing (398) 117 (150) (150) (150)
Loans (608) 23 1 0 0
Equity (19) (18) 0 0 0
Dividends 10,352 12,527 12,543 12,708 13,336
Others 361 600 (642) (25) (25)
Cash Flow From Financing 10,087 13,132 11,902 12,683 13,311
Changes in Cash 19,728 28,285 25,177 24,652 26,725
Financial Ratios
Gross Margin (%) 25.0 24.4 23.4 23.8 24.3
Operating Margin (%) 16.8 16.3 15.8 15.8 16.0
Pre-Tax Margin (%) 17.8 17.0 16.5 16.5 16.7
Net Margin (%) 13.4 12.8 12.4 12.3 12.5
ROA (%) 31.7 29.6 29.9 31.1 32.4
ROE (%) 38.6 37.1 37.8 39.4 41.1
ROIC (%) 40.6 39.4 40.0 41.6 43.2
Acct. Receivables TO (days) 18.6 16.2 14.6 15.5 15.5
Acct. Receivables - Other TO (days) 0.0 0.0 0.0 0.0 0.0
Inventory TO (days) 3.7 4.0 4.2 4.1 4.1
Payable TO (days) 18.0 18.4 17.6 17.8 17.8
Acct. Payables - Other TO (days) 0.0 0.0 0.0 0.0 0.0
Debt to Equity (%) 0.3 0.3 0.3 0.3 0.3
Interest Coverage Ratio (x) 0.0 0.0 0.0 0.0 0.0
Net Gearing (%) (14.5) (21.7) (17.0) (15.9) (15.6)
Head Office
PT INDO PREMIER SEKURITAS Wisma GKBI 7/F Suite 718 Jl. Jend. Sudirman No.28 Jakarta 10210 - Indonesia p +62.21.5793.1168 f +62.21.5793.1167
INVESTMENT RATINGS
BUY : Expected total return of 10% or more within a 12-month period HOLD : Expected total return between -10% and 10% within a 12-month period SELL : Expected total return of -10% or worse within a 12-month period
ANALYSTS CERTIFICATION.
The views expressed in this research report accurately reflect the analysts personal views about any and all of the subject securities or issuers; and no part of the research analyst's compensation was, is, or will be, directly or indirectly, related to the specific recommendations or views expressed in the report.
DISCLAIMERS