CHAPTER III RESEARCH METHOD A. The Location of Research
This research conducted at class VII of Madrasah TsanawiyahIslamiyah YPIBatangKuis in 2016/2017 Academic Year. This school is located on Jl. MesjidJamikDusun 1 No. 59 DesaBintangMeriahKecamatanBatangKuis, Kabupaten Deli serdang. The researcher choosenMTs.Islamiyah YPI BatangKuis as location of research, because;
1. The data which is needed in this research can be found in this school, 2. The number of students in sufficient to be a representative sample,
3. This school is the Islamic school. This is one of the requirement from my faculty to conduct the research in the Islamic school.
B. The Population and Sample 1. Population
Populasiadalahkeseluruhanobjek yang akanditeliti.1 (Population is the whole of objects that will be researched). In addition, according to Arikunto, “Population is all members of the research subject”.2In this research, the population was
the seventh grade ofMTs.Islamiyah YPI that consists of 60 students in two classes. It could be seen from the table:
Table 3.1
The Population of Research
Number Class Students
1 VII-1 32
2 VII-2 28
Total 60
2. Sample
1SyahrumSalim, (2007), MetodologiPenelitianKuantitatif,Bandung:Citapustaka Media, page:113
2SuharsimiArikunto, (2006), ProsedurSuatuPenelitianSuatuPendekatanPraktik, Jakarta:BinaAksara, page:130 27
“Sampling atausampleberarticontoh, yaitusebagiandariseluruhindividu yang menjadiobjekpenelitian”.3 (Sample it’s
mean an example, a part of all individuals that will be an object in research). Experiment researchers start with the total
population and work down to the sample. According to Louis, “the sample isthe smaller class or subset of the
population”.4If the research subject less than 100 is better to take all of it. So, it is regarded as a population research. But, if
the research subject more than 100, the researcher can take 10 – 15% or 20 – 25% from the population.5
In this research, the researcher was took 60 students. The researcher uses the random access sampling to get the sample because the class has the same quality and homogeny, there are no classification.
Table 3.2
The Sample of Research
Number Class Students
1 VII-1 (Experimental Class) X 32
2 VII-2 (Control Class) Y 28
Total 60
C. The Design of Research
This research is a quantitative research. According to Syahrum and Salim, a quantitative research is an empirical research that consist of statistical data.6 It means that the writer was collected and analyzed the data statistically. This
research will use experimental design. Experimental design is a quantitative research design that aims to get the correlational of cause and effect clearly between some factors of causes with the problem or condition. .
In experimental research, there were two groups of sample namely control group and experimental group. Both of groups were given pre-test and post-test. Pre-test was administered to each group before giving treatment. The
3Mardalis, (2007), MetodePenelitianSuatuPendekatan Proposal,Jakarta:BumiAksara, page:55 4 Louis Cohen, dkk, (2007), Research ethod in Education,London:Routledge, page:100 5SuharsimiArikunto, Op.Cit., page:134
6Syahrum and Salim, Op.Cit, page:4
experimental group was taught by using semantic clustering technique while control group was taught without using clustring technique. The research design was showed in Table 3.1 as following :
Tabel 3.3 Research Design
Group Treatment Class
Experimental
group TestPre Applying clustering Technique Post Test VII – 1 Control group
Pre Test
Without Clustering Technique
Post
Test VII- 2
D. The Operational Definition
This research has two variable, they were independent variable and dependent variable.
1. Independent variable of this research was Clustering Technique in teaching vocabulary. This strategy was applied to know the effect of Clustering Technique on students’ vocabulary mastery in seventh grade at MTs.Islamiyah YPI BatangKuis in 2016/2017 Academic Year.
2. Dependent variable was students’ vocabulary mastery. It was hoped that the students can express their idea in mastery vocabulary in English language.
E. The Instrument for Collecting Data
In collecting the data from field of the research, the researcher used the test. A test in term, ia a method of
measuring a person’s ability, knowledge or performance in given domain. The aim of using the test is in accordance with the context, such diagnostic evaluation, selection and promotion, because everyone has different ability, personality, interest and behaviour. In this case, the researcher used writing test to measured students’ vocabulary mastery. In this test, the researcher will give 25 questions in multiple choices.
F. The Score of Test
The scores of the test were calculated by applying the formula:
S = RN X 100%
In which : S = Score of the test
R = Number of the correct answer N = Number of the test items
G. The Technique for Collecting Data
The procedure of the research were divided into pre-test, treatment, post-test, and scoring the test. Each of this session was discussed now.
1. Pre-test
The pre-test was conducted to discover the homegencity of the sample and the mean score of each group. In other
words, it was used to measure the students’ ability in mastery vocabulary before applying the treatment. Before starting the experiment, a pre-test was administered to the samples of both groups with the same items. The kind of the researcher gave was an essat test. Then their test was checked and collected as the pre-test data and gave the score.
2. Treatment
The treatment was conducted after the administration of the pre-test. The experimental group and control group were taught by using the same materials but different instruments. In the experimental group, the researcher used semantic
clustering technique on students’ mastery vocabulary, and control group was taught by using lecturing technique.
a. Teaching Presentation in the Experimental Class
The treatment was conducted after the administration of pre-test. The teacher taught the presentation to the experimental group by the following procedures.
Tabel 4.4
Steps
Experimental Group (Applying clustering Technique)
1 Pre-Test Pre-Test
Teacher greets the students.
Teacher gives an opinion
2 Treatment Treatment
Giving Information
Teacher shows or tells the learning objectives.
Teacher present the material.
Grouping
Students are divided into some groups.
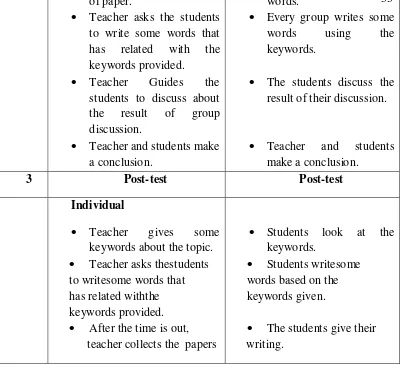
Teacher gives some piece of paper.
Teacher asks the students to write some words that has related with the keywords provided.
Teacher Guides the students to discuss about the result of group discussion.
Teacher and students make a conclusion.
Students listen to the teacher.
Students listen to the teacher.
Students sit in group.
Students look at the key words.
Every group writes some words using the keywords.
The students discuss the result of their discussion.
Students sit in group.
Students look at the key
of paper.
Teacher and students make a conclusion.
Teacher asks thestudents to writesome words that has related withthe
b. Teaching Presentation in The Control Class
The teaching learning process that was applied in the control group by using lecturing technique can be described as follows:
Table 1.5The Treatment for Control Group
Steps
Experimental Group
(using without Clustering Technique)
Teachers Activity Students Activity
1 Pre-Test Pre-Test
Teacher greets the students.
Teacher gives an opinionabout related topic.
Teacher asks the students to write some word to be a descriptive
The students give a response for the tescher's greeting The students lisen to the teacher's.
The student listen to the teacher’s
explanation.
The students write a descriptive text based on the topic provided.
text.
2 Treatment Treatment
Giving Information
Teacher explain about descriptive text.
Teacher gives the example of descriptive text.
Discuss the format ofdescriptive text with the students and ask some students to analysis.
Give chance to the students to asks somequestion
Reviews again about the descriptive text.
Students listen to the teacher and write teacher's explanation on their note book.
Students read the example
Explain the generic structureof that text.
Asks question to theteacher.
Pay attentions to the teacher.
3 Post-test Post-test descriptivetext based on the topic provide before.
Give their writing.
Pay attention.
3. Post-test
After giving treatment to the students, the researcher gave the students a post-test in order to the see the result wheter the technique was effective or not. The test of post-test was similar to the test that was given in the pre-test. H. The Technique for Analyzing Data
In this research, the data will be obtained from the experiment and control class. To significantly whether there is effect of applying clustering technique on the students’ vocabulary mastery, the researcher should do requirement test at the first by using normality and homogencity test.
1. Normality Test
To test the normality of data, the researcher will useLiliefors test with the following steps:
Calculating mean and deviation standart by the formula:
34
𝑋̅ = ∑ 𝑋𝑛
S = √𝑛 ∑ 𝑋12 − (∑ 𝑋1)2
Perception x1,x2... xn made permanent number zi, z1, z2, ...zn by using formula:
Zi = 𝑥𝑖− 𝑥̅
𝑆
To find out S (Zi) we use the formula: S (Zi)
=
𝐹𝑐𝑢𝑚𝑛
Here, after calculating a proportion Z1, Z2 ... Zn, the smaller equals to Zi. Counting the difference F(Zi) – S(Zi), and ten determine its absolute price.
Taking the biggest price among absolute price of the difference and mentioning the price by L0.
If L0 < L obtained from the critical coefficient test, the Liliefors with the real level α = 0,05, hence the distribution is normal. 7
2. Homogencity Test
To the test variants of both homogenous samples, variants equality test, that is:
F = 𝑇ℎ𝑒 𝑏𝑖𝑔𝑔𝑒𝑠𝑡 𝑣𝑎𝑟𝑖𝑎𝑛𝑡𝑠
𝑇ℎ𝑒 𝑠𝑚𝑎𝑙𝑙𝑒𝑠𝑡 𝑣𝑎𝑟𝑖𝑎𝑛𝑡𝑠
Here, its criterion is F observation< Ft, then both samples was homogenous.
3. Hypothesis Test
The data will be analyzed by using t-test formula. The formula is:
t =
𝑀𝑥−𝑀𝑦√(𝑑𝑥2+ 𝑑𝑦2𝑛𝑥+𝑛𝑦−2)(𝑛𝑥1 +𝑛𝑦1 )
Mx= the mean score of experiment group My = the mean score of control group
dx = the deviation standard of experimental group dy = the deviation standard of control group nx = the total sample of experimental group ny = the total of control group8
7Sudjana, (2015), MetodaStatistika, Bandung: Tarsito. Page. 466