ECONOMIC EFFICIENCY OF SOYBEAN FARMING
(CASE STUDY IN MLORAH VILLAGE REJOSO
DISTRICT NGANJUK REGENCY)
Rini Dwiastuti
1, Indah Mustiko Ningsih
21 Lecturer of Agricultural Economics Department, Agricultural Faculty, University of Brawijaya 2 Graduate Student of Agricultural Economics Department, Faculty of Agriculture, Universitas of Brawijaya
*corresponding author: [email protected]
ABSTRACT: Since 1992, domestic soybean production was unable to fulfill national consumption, which led to the import decision by government. Domestic farmers have not been interested in cultivating soybean due to its relatively expensive production costs; despite its output price also has less competitiveness to the imported soybean. One strategy to reduce the dependence of imported soybean is by improving the efficiency of soybean farming . Efficiency of soybean production in this research represents the farmers’ ability in having minimum cost to produce certain level of soybean production. This study aims to analyze factors that affect production costs and to estimate the economic efficiency score. Cobb Douglas Stochastic Frontier Cost Function; then, the best models is chosen using Akaike Information Criterion (AIC) and Schwarz Information Criterion (SIC). While, the second objective used actual production cost ratio and minimum production cost ratio. The research finding showed that land lease, fertilizer price, pesticide price, price of drilled wells irrigation, and the amount of output had positive effect to the production costs. Meanwhile, seed price and labor wage had negative effect. In conclusion, farmers still could not achieve economic efficiency, thus, there is a chance to save production cost in order to achieve full economic efficiency.
Keywords: soybean production, stochastic frontier cost function, economic efficiency
INTRODUCTION
Soybean is one of strategic food crops in Indonesia. Soybean consumption increases as the increase of population. It is due to soybean is the main ingredient to produce tempe (soybean cake) and tahu (tofu) which become daily consumption of Indonesian. Soybean consumption in 2012 reaches up to 2,946,000 tons (Ministry of Agriculture, 2014). Meanwhile, since 1992, domestic soybean production was unable to fulfill national consumption, which led to the import decision by government. In 2012, 72.25 percentof total national consumption fulfilled through import activity.
The decreasing of farmers’ interest in cultivating soybean are proved by the decrease of production during the period of 1992-2013. The expensive cost of production is one that caused this happened.
Local soybean production is the main ingredient of tofu, thus majority of local soybean consumer is tofu producer. It is due to local soybean contains high protein, thus it results in more solid tofu. Panca (2012) stated that according
to Badan Penelitian Tanaman Kacang-kacangan
dan Umbi-umbian Malang (Agency for
Leguminosae and Araceae Plant Research of Malang) in 2012, content of protein in local soybean is 4 percent higher than imported soybean. In this sense, local production of soybean is potential for growing more in order to fulfill domestic need. Evaluation regarding efficiency of soybean production is imperative for this reason.
distribution assumption [u_i~N^+ (0,σ_u^2)] of it. While, Stevenson (1980) used truncated-normal
distribution assumption [u_i~N^+ (μ,σ_u^2)].
Theoretically, there are many distribution assumptions of error term – normal-half normal, normal-truncated, normal-exponential, and gamma distribution. Each distribution assumption results in different efficiency score. Inappropriate way of selecting distribution assumption will lead to the bias efficiency score. This research analyzed economic efficiency through three distribution assumption (normal-half normal, normal-truncated, normal-exponential), then selected model with the best score based on Akaike Information Criterion (AIC) and Schwarz Information Criterion (SIC) score.
East Java Province is the center of soybean production in Indonesia. Soybean production in East Java contributed for 31 percent of total soybean production in Indonesia (Central Agency of Statistics, 2013). Nganjuk Regency is one regency in East Java, which produces soybean. Potential area to selected as center of soybean production in Nganjuk Regency is Rejoso District (Ministry of Agriculture of Nganjuk Regency, 2014). Farmers in Rejoso District grew of 29.2 percent of soybean in 2013.
Based on economic efficiency concept, producers try to use minimum production cost in order to produce certain output (Coelli, et al., 1998). The objective of this research was to analyze factors that affect production cost and to estimate economic efficiency score of soybean farmers.
RESEARCH METHODS
Research Location and Respondents
Research location was determined by purposive method, which was in Mlorah Village. The village has the largest soybean cultivation area in Nganjuk Regency, which was 405.37 ha. Data collection was conducted on May-July 2014.
The research population was 834 farmers. Research sample was taken by stratified random sampling method (Parel, et al., 1973), which is conducting stratification based on land area. There are three stratifications, low farming size (x≤0.5 ha), medium farming size (0.5 ha <x≤ 1 ha), and large farming size (x>1 ha). These stratifications
were considering heterogeneous farmer’s
production cost in each stratification. The Sample size taken from those three stratifications was 34 farmers. Besides, data collection was conducted
through interview and documentation. The data analysis are used two-steps analysis as follow: 1. Factors analysis that affect production cost of
soybean in Mlorah Village
Cobb Douglas Stochastic Frontier cost function is applied and the specification is follows:
……(1)
Where:
= production cost (IDR) of farmer to-i = constant/intercept
= parameter of input prices = land lease price (IDR/m2)
= seed price per planting period (IDR/kg) = fertilizer price per planting period (IDR
/kg)
= pesticide price per planting period (IDR /mL)
= labor wage per planting period (IDR /HOK)
= price of drilled well irrigation per planting period (IDR /hour) = parameter of soybean production of
farmer to-k
= amount of soybean production (kg) = random variable that assumed to have
iid|n (0, ) score
= variable that assumed as inefficient production cost and assumed to have iid|n (0, ) score
= farmer to-i1, i = 1, 2, … 34
There are three distribution assumptions of error term that estimated by MLE, normal-half normal, normal-truncated, normal-exponential, and gamma distribution. This following is estimation according Khumbhakar and Lovell (2000):
a. Normal-Half Normal
Log likelihood and economic efficiency score based on Normal-Half Normal distribution assumption obtained from this equation below:
normal cumulative distribution and density function.
b. Normal-Truncated Normal
The following is formula to find economic efficiency score based on Normal-Truncated Normal distribution assumption:
( )
∑ ( ) ∑ (4)
{ }
[ [ ̃ ]
( ̃ ) ] { ̃ }…….. (5)
Where = cost efficiency/economic efficiency of farmer to-i (i=1,2,..34), L= likelihood function,
√ , =average , ,
,
, [ ] and [ ] = standard of normal cumulative distribution and density function.
c. Normal-Exponential
Economic efficiency score based on Normal-Exponential distribution assumption as follows:
( )
∑ ∑ ……….. (6)
{ }
[ ( )
( )] { }………. (7)
Where = cost efficiency/economic efficiency of farmer to-i (i=1,2,..34), L = likelihood function, I = number of sample, A = ̃ and ̃ = ),
, =
and , [ ] and
[ ] = standard of normal cumulative distribution and density function.
The next step was to choose the best model. The best method selection was performed based on Akaike Information Criterion geometry (Schwarz, 1978). Criteria to the best
model is model with smallest AIC and SIC score. Formula to calculate AIC and SIC score as follows:
∑ ̂ ……….. (8)
( ) |∑ ̂ |……… (9)
Where:
= number of estimated parameter in the model = number of observation
= 2.718 = residual
The next step was interpreting factors that affect production cost. The first hypothesis stated that land lease price, seed price, fertilizer price, pesticide price, price of drilled well irrigation, labor wage, and amount of production affected to the production cost. It was tested by using t-test. The following is hypothesis of t-test:
where tstatistics ≤ ttable, then land lease price, seed
price, fertilizer price, pesticide price, price of drilled well irrigation, labor wage, and amount of production had no effect to the production cost.
where tstatistics > ttable, then land lease price, seed
price, fertilizer price, pesticide price, price of drilled well irrigation, labor wage, and amount of production affected to the production cost.
2. Analysis of Economic Efficiency of Soybean Agribusiness in Mlorah Village
After the best model found, the next step was calculating economic efficiency score. Economic efficiency (also called as Cost Efficiency-CE) is about 0 to the 1 (0 < CE ≤ 1). The following is the research hypothesis:
showed economic efficiency
showed economic inefficiency
If CE score is equal to 1, then the farming is in full economic efficiency. However, if the score is not equal with 1 then the farming still inefficient economically. Economic efficiency score which closes to 1 shows the more efficient the farming is. The calculation of economic efficiency to the soybean agribusiness in Mlorah Village as follows:
∑
∑ .(10)
Where:
= economic efficiency (cost efficiency) of farmer to-i
= actual cost production of farmer to-i (IDR)
= parameter of input price = input price
γ = parameter to the amount of production
Y = amount of production
= random variable which describes
economic inefficiency
= variable that assumed as inefficient of
cost production and assumed to have iid | N (0, ) score
= farmer to-i, i = 1, 2, …, 34 = input price to-l, l = 1, 2, …, 6
RESULTS AND DISCUSSION
Analysis of Factors that Affect Soybean Production in Mlorah Village
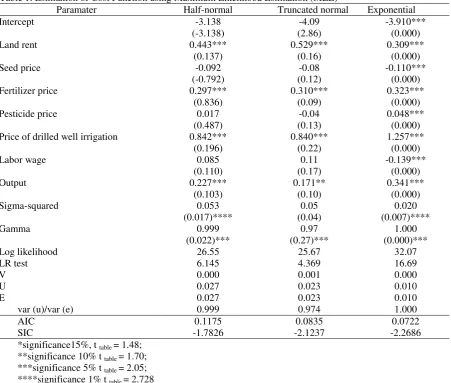
There were three distribution assumption of error term that used in this research, half normal, truncated normal, and exponential. Table 1 shows the result of estimation to the stochastic frontier
cost function. When the model appropriateness viewed from how many independent variable affected to the production cost, then the exponential distribution assumption had the highest number of significant variable. Unfortunately, this research viewed model appropriateness based on AIC and SIC score. Criteria to the best model established by the model with smallest AIC and SIC score. Model which meets the criteria above then used to estimate economic efficiency score.
The smallest AIC score was in exponential distribution assumption for 0.0722. and the smallest SIC score was -2.2686, which was exponential distribution. It showed that from the three models, the best or the most appropriate model was cost function based on exponential distribution. Therefore, exponential distribution assumption would be used to interpret the economic efficiency due to it had the smallest AIC and SIC score.
Table 1. Estimation of Cost Function using Maximum Likelihood Estimation (MLE)
Paramater Half-normal Truncated normal Exponential
Intercept -3.138 -4.09 -3.910***
(-3.138) (2.86) (0.000)
Land rent 0.443*** 0.529*** 0.309***
(0.137) (0.16) (0.000)
Seed price -0.092 -0.08 -0.110***
(-0.792) (0.12) (0.000)
Fertilizer price 0.297*** 0.310*** 0.323***
(0.836) (0.09) (0.000)
Pesticide price 0.017 -0.04 0.048***
(0.487) (0.13) (0.000)
Price of drilled well irrigation 0.842*** 0.840*** 1.257***
(0.196) (0.22) (0.000)
Labor wage 0.085 0.11 -0.139***
(0.110) (0.17) (0.000)
Output 0.227*** 0.171** 0.341***
(0.103) (0.10) (0.000)
Sigma-squared 0.053 0.05 0.020
(0.017)**** (0.04) (0.007)****
Gamma 0.999 0.97 1.000
(0.022)*** (0.27)*** (0.000)***
Log likelihood 26.55 25.67 32.07
LR test 6.145 4.369 16.69
V 0.000 0.001 0.000
U 0.027 0.023 0.010
E 0.027 0.023 0.010
var (u)/var (e) 0.999 0.974 1.000
AIC 0.1175 0.0835 0.0722
SIC -1.7826 -2.1237 -2.2686
*significance15%, t table = 1.48;
**significance 10% t table = 1.70;
***significance 5% t table = 2.05;
****significance 1% t table = 2.728
The result of regression analysis which performed using MLE method based on
There were seven variables that affected to the minimum production cost – land lease price, seed price, fertilizer price, pesticide price, price of drilled well irrigation, labor wage, and amount of production. Estimation of Cost Function which performed using Maximum Likelihood Estimation (MLE) presented in Table 1 above.
Factors that affect production cost explained as follow:
1. Land rent
Land is the important factor in cultivating soybean. However, it is not all farmers in Mlorah Village owned the land cultivation. There is 32.35 percent from total respondents as tenant. Land rent affected significantly to the cost production. Regression coefficient to the land rent price was 0.309 which means that land rend price increases by 1 percent then production cost will increase for 0.309 per cent. The addition of production cost was quite high if there is an increase of land rent. It was because the land rent contributed for 24.8 percent of total production cost.
2. Seed Price
Based on Table 1, seed price affected to the production cost. Seed is main input in soybean farming, the increase of seed price will result in the decrease of production cost. It was proved with coefficient score of seed price variable for -0.110. It means that when seed price increases by 1 percent then production cost will decrease for 0.110 percent. However, there is no much plausible reason regarding this coefficient.
3. Fertilizer Price
Table 1 shows that fertilizer price affected positively to the production cost. Coefficient score of fertilizer price variable was 0.323 which means every increase of fertilizer price by 1 percent, it will increase production cost of 0.323 percent. In 2012 to 2013, there was relatively no increase of subsidized fertilizer price. In 2013, fertilizer price of Urea, Phonska, Za, SP-36 were IDR 1,800; IDR 2,300; IDR 1,400, and IDR 2,000, respectively.
4. Pesticide Price
Production cost also affected by pesticide price. Coefficient of pesticide price was 0.048 which means every increase of pesticide price by 1 per cent, it will result in the increase of production cost for 0.048 per cent. Worm is the most pest attacking soybean production. Although the price of this pesticide was relatively expensive, IDR 125,000 per 250 mL, farmers keep using that type of pesticide to avoid the risk of harvest failed.
5. Price of Drilled Well Irrigation
Table 1 presents the price of drilled well irrigation which affected positively to the production cost with coefficient of 1,257. Price of drilled well irrigation had highest coefficient among other independent variables. If the price of drilled well irrigation increases by1 percent then production cost will increase for 1.257 percent. Land area about 840 ha in Mlorah Village only owned drilled wells for 15 units. Price of drilled well irrigation was about IDR 12,000 (for land which closes to the drilled well installation) – IDR 15,000 per hour (for land which far from drilled well installation). Drilled well irrigation contributed to 12 percent of total production cost. Therefore, to fulfill irrigation needs of soybean land and save production cost then it needed to add drilled wells or increasing coverage of irrigation infrastructure.
6. Labor Wage
Labor wage affected negatively to the production cost. Coefficient score of labor wage variable was IDR 5,000. Farmers tended to reduce the number of labor when there is wage increasing. The reduction of labor would lead to the decrease of production cost.
7. Output of Production
The output of production is related to input utilized. Farmers might increase the amount of production by increasing input utilization. The increase of input utilization would affect to the increase of production cost. Therefore, there was relationship between amounts of production to the production cost. Based on regression test, amount of production affected positively to the production cost. It was showed by regression coefficient score of 0.341. If the amount of production increases by 1 percent then production will increase for 0.341 per cent. However, if the production decreases by 1 per cent, then production cost will also decrease for 0.341 per cent.
Analysis of Economic Efficiency to the Soybean Agribusiness in Mlorah Village
cost to produce certain output. The best or most appropriate assumption distribution of cost function based on AIC and SIC method was exponential distribution. Based on Table 1, it is found that soybean farmers in Mlorah Village had not achieved economic efficiency yet. Hypothesis, which stated that soybean farming is still not
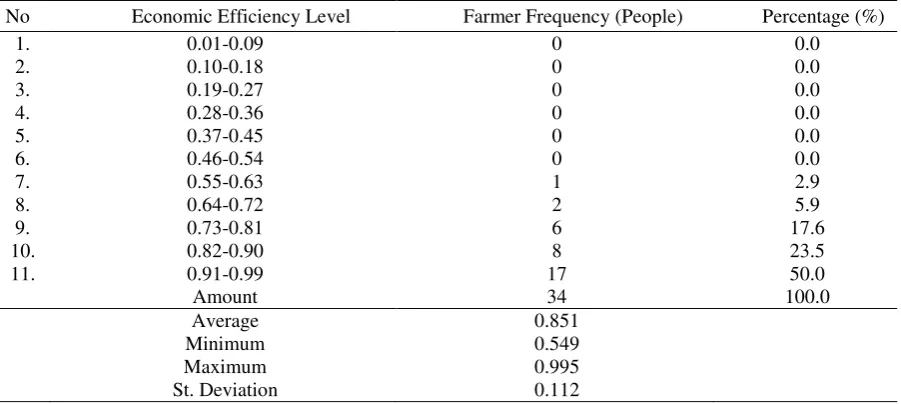
achieved full economic efficiency, is proven. It is based on the result of economic efficiency scores, which are not equal to 1. One factor which causes this problem (could not achieve full economic efficiency) was due to other factors out of farmers’ control. Table 2 presents distribution of economic efficiency based on exponential distribution.
Table 2. Distribution of Economic Efficiency Based on Half Normal Distribution Assumption
No Economic Efficiency Level Farmer Frequency (People) Percentage (%)
1. 0.01-0.09 0 0.0
2. 0.10-0.18 0 0.0
3. 0.19-0.27 0 0.0
4. 0.28-0.36 0 0.0
5. 0.37-0.45 0 0.0
6. 0.46-0.54 0 0.0
7. 0.55-0.63 1 2.9
8. 0.64-0.72 2 5.9
9. 0.73-0.81 6 17.6
10. 0.82-0.90 8 23.5
11. 0.91-0.99 17 50.0
Amount 34 100.0
Average 0.851
Minimum 0.549
Maximum 0.995
St. Deviation 0.112
Table 2 presents that 50 percent farmers are in the farming efficiency level of 0.91-0.99. It showed that farmers in Mlorah Village almost achieved economic efficiency or almost applied minimum production cost to produce certain product. The average farming efficiency is 0.889. If farmers who place in the average economic efficiency level are able to achieve the highest economic efficiency level then they will able to save production cost of 11.0 percent (1-88.9/0.995).
CONCLUSION
1. Factors that affected positively to the cost production were land rent, fertilizer price, pesticide price, price of drilled well irrigation, and amount of production. While, seed price and labor wage affected negatively to the production cost. Price of drilled well irrigation had the highest coefficient score among other independent variables where the price of drilled well irrigation increased by 1 percent which lead to the increase of production cost for 1.257 percent.
2. Soybean farmers in Mlorah Village had not achieved economic efficiency. It means that farmers with average of economic efficiency level still had a chance to save production cost in order to achieve full economic efficiency.
SUGGESTION
1. If the farmers want to decrease production cost, then farmers need to consider price of drilled well irrigation. Soybean farmers should make water reservoir as water reserve of plant irrigation when the river irrigation has no longer sufficient to irrigate their soybean cultivation land.
2. In the attempt to decrease production cost in Mlorah Village, government should establish subsidy programme of drilled well installation by considering ground water ability in supplying irrigation water in the future.
REFERENCES
Aigner, D., Lovell, C. A. K., and Schmidt, P. 1977. Formulation and Estimation of Stochastic Frontier Production Function Models. Journal
of Econometrics, 6(1), 21–37.
http://doi.org/10.1016/0304-4076(77)90052-5.
Badan Pusat Statistik. 2013. Produksi Kedelai Provinsi Tahun 2000-2013. www.bps.go.id. Diakses tanggal 4 April 2015.
Agriculture: A Review of the Frontier Function Literature.
Coelli, T., Rao, D. . P., and Battese, G. E. 1998. An Introduction to Efficiency and Productivity
Analysis. London: Kluwer Academic
Publisher.
DeLeeuw, J. 1992. Akaike (1973) Information Theory and an Extension of the Maximum Likelihood Principle. (N. L. Johnson, Ed.) (pp. 599–609). New York: Springer-Verlag.
Dinas Pertanian Kabupaten Nganjuk. 2014. Data Realisasi Luas Tambah Panen Tahun 2013 Kecamatan Rejoso Kabupaten Nganjuk. Kabupaten Nganjuk.
Kementerian Pertanian. 2014. Produksi Kedelai
Tahun 2013.
http://aplikasi.pertanian.go.id/bdsp/newlok.as p. Diakses tanggal 3 April 2015.
Kumbhakar, S. C., & C. A. K. Lovell. 2000. Stochastic Frontier Analysis (pp. 1–332). Cambridge. Cambridge University Press.
Ogundari, K., S. O. Ojo, & I. A. Ajibefun. 2006. Economies of Scale and Cost Efficiency in
Small Scale Maize Production: Empirical Evidence from Nigeria. Social Science, 13(2): 131–136.
Panca, E. H. 2012. Kedelai Lokal Lebih Kaya Protein.
www.tribunnews.com/2012/07126/kedelai-lokal-lebih-kaya-protein/. Diakses 9 April 2015.
Parel, C. P., Caldito, G. C., Ferrer, P. L., Guzman, D., Sinsioco, C. S., & Tan, R. H. 1973. Sampling Design and Prosedures. New York, Singapore: The Agricultural Development Council Inc.
Pemerintah Kabupaten Nganjuk. 2012. Profil Kabupaten Nganjuk. Kabubapten Nganjuk.
Schwarz, G. E. 1978. Estimating the Dimension of a Model. The Annals of Statistics, 6(2), 461– 464.