2 (2) 111 - 119 ©UB 2013 University of Brawijaya Malang, Indonesia http://apmba.ub.ac.id
Comparative Study between Capital Asset Pricing
Model and Arbitrage Pricing Theory in Indonesian
Capital Market during Period 2008-2012
Leo Julianto
Bandung Institute of Technology, Bandung, Indonesia
Abstract
For decades, there were many models explaining the returns earned emerged in order to fulfil the curiosity had by human. Since then, various studies and empirical findings in many countries’ stock market showedthat the empirical findings of market return explanation and the return of assets meet the different results in both clarify of model and identification of significant determinant variables.Therefore, many comparative studies between models were accomplished. In this study, the author attempts to do comparative study between two models, APT and CAPM, in Indonesian Capital Market during period 2008 until 2012. Besides, the author also attempts to find how much inflation, interest rate, and exchange rate describe the returns earned in each sector existed in Indonesia Capital Market. As the result, the author find out that CAPM has bigger explanation power than APT in Indonesian Capital Market during period 2008-2012. Besides, the author also found that among macroeconomic factors, there are only two macroeconomic factors that can affect certain samples significantly. They are change in BI rate, which affect AALI, ANTM, ASII, TLKM, UNTR, and change in exchange rate, which affect INDF and TLKM significantly.
Keywords
Indonesian Capital Market, APT, CAPM, Inflation, Interest Rate, Exchange Rate Received: 2 September 2013; Accepted: 4 November 2013; Published Online: 1 January 2014
Introduction
For decades, financial knowledge has been trying to codify various findings and scientific efforts with the aim to explain the return earned by human from investment activities for both its dynamics and determinant. Markowitz (1952) pioneered the efforts to explain the acquisition of return by defining portfolio theory and asset optimization constraint
limit. Different framework was developed in another time by Eugene F. Fama (1970) who found that events and public news affected the return earned. Appearance of William F. Sharpe (1964) via his finding,
market. Unlike Sharpe (1964), Ross (1976) attempted to describe return as an output from dynamics of macroeconomic variables through its Arbitrage Pricing Theory (APT) model. Various studies and empirical findings about comparative studies between APT and CAPM in many countries’ stock market showedthat the empirical findings of market return explanation and the return of assets meet the different results in both the clarify of model and the identification of significant determinant variables. Likewise, in this study, the author attempts to do comparative study between those two models, APT and CAPM, and to identify how much inflation, interest rate, and exchange rate describe the stock price movement in nine sectors of Jakarta Stock Exchange in Indonesian Capital Market during period 2008 until 2012.
Literature Review
Capital Asset Pricing Model
Capital Asset Pricing Model (CAPM) is a model introduced by Jack Treynor (1961,1962) and William Sharpe (1964). This model described return of an asset as a function of risk-free asset plus beta multiplied by the market premium. Mathematical way of describing CAPM is as follow.
The advantage point of this model is this model can be used easily because it simplifies the complicated systematic risk, which describes the whole market risk, into risk premium while the disadvantage point of this model is that this model has too many unrealistic assumptions.
Some Proposing View of CAPM Some researchers have found that CAPM can explain the returns phenomenon significantly in their own countries.
Margellos, Athanasios S (1998) attempt to test the conditional version of CAPM model ability, which allowed β to vary overtime, to explain the cross-sectional variation of monthly returns data on French (1992) methodology was used to test the unconditional CAPM. The result of this study showed that conditional CAPM model could explain the returns earned quite good (R2 of 38.99%). As for the result of this study, theresearchers found that CAPM can explain the returns earned well in the small Icelandic Stock Market and the beta coefficientcould explain returns better than on larger foreign stock markets.
Disadvantaging View of CAPM
Arbitrage Pricing Theory
Arbitrage Pricing Theory (APT) was introduced after CAPM. APT was firstly proposed by Ross (1976) and it was tested by Gehr (1978), Roll and Ross (1980), and Chen, Roll and Ross (1986).
APT model is said better than CAPM model by several researchers such as Dhankar et al (2005). At least, APT brings more macroeconomic factors into considerations in predicting the return while CAPM just add one macroeconomic factor into consideration, the excess market premium. Since APT has more factors, meaning that this model take one step closer to reality.
Proposing View of APT
Many researchers found that Arbitrage Pricing Theory can explained return in a country significantly, even there are researchers found that APT had better explaining power of return than CAPM. After APT was introduced by Ross (1976), Chen, Roll, and Ross (1986) tried to test whether asset pricing was influenced by macro-economic variables or not. In their research, they used many macro-economic factors, which are; inflation, industrial production, risk premium, term structure, market indices, consumption, oil price. As the conclusion, the researchers found that stock returns were exposed to systematic economic news, that they are priced in accordance with their sensitivities with macro-economic variables.
Disadvantaging View of APT
Even though many researchers believed that APT has closer to reality assumptions than its predecessor model, CAPM,
there are still researchers who found that APT couldn’t explain the return earned significantly. Mauri (2006) attempted to study the application of APT in Russia Stock Market. In this study, researcher used 20 biggest equities of the year 2005 in Russia. For the samples, researcher used the observation data during period January 1999 to March 2006 in form off monthly basis data. The macroeconomic variables used were unanticipated shocks to money supply, unanticipated inflation, unanticipated change in oil price, unanticipated changes to the exchange rate and unanticipated shocks to industrial production.
Methodology
In this study, the author attempts to do comparative study between those two models, which are APT and CAPM, in Indonesian Capital Market during period 2008 until 2012. This objective can’t be made into hypothesis since it doesn’t use statistical tools directly. The author use R2 comparison between APT and CAPM in each nine sectors.
Figure 1. Samples
No. Sector Stocks Stocks code
1 Aggriculture Astra Argo Lestari AALI
2 Mining Aneka Tambang ANTM
3 Basic Industry and Chemicals Holcim Indonesia SMCB 4 Various Industries Astra International ASII 5 Consumer Goods Industry Indofood SuksesMakmur INDF
6 Property and Real Estate KawasanIndustriJababeka KIJA
7 Infrastructure, Utility, and Transportation Telekomunikasi Indonesia TLKM
8 Finance Bank BCA BBCA
9 Trade, services, and investments United Tractor UNTR
In this study, the author employed regression analysis under OLS in order to find out which model that can describe returns earned in all samples better. For CAPM, simple regression is used since there is only one independent variable conducted in CAPM, which is market premium. For the APT, the macroeconomic variables used are change in inflation rate, change in GDP rate, and change in foreign exchange rate denominated in rupiah. In this study, within regression analysis, the author employed F-test and T-test statistic in order to find out whether CAPM or APT that can explain assets significantly and to find how much change in inflation, BI rate, and exchange rate affect assets in all nine sectors existed in Indonesia. Besides, since regression is used, assumption tests must be done in order to avoid type 1 and type 2errors.
Assumption tests done in this study are multicollinearity, autocorrelation, and heteroskedasticity test.
Findings
For assumption test, this study has passed all three assumption test, which are multicollinearity, heteroskedasticity, and autocorrelation.
CAPM F-Test
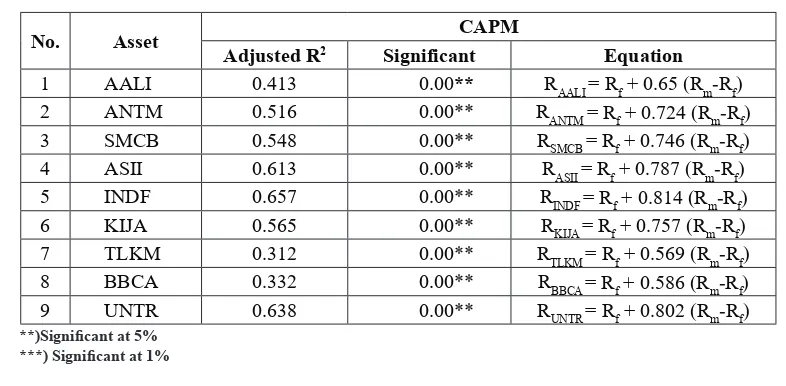
For this test, F-test is employed in order to know if market return within CAPM framework can explain asset return significantly. Besides, R2 is also employed in order to know how much market returns within CAPM framework affect the assets. Below is the result of the regression analysis between market return as the independent variable and the assets return as the dependent variable
Figure 2. CAPM F-test
No. Asset Adjusted R2 SignificantCAPM Equation
1 AALI 0.413 0.00** RAALI = Rf + 0.65 (Rm-Rf) 2 ANTM 0.516 0.00** RANTM = Rf + 0.724 (Rm-Rf)
3 SMCB 0.548 0.00** RSMCB = Rf + 0.746 (Rm-Rf)
4 ASII 0.613 0.00** RASII = Rf + 0.787 (Rm-Rf) 5 INDF 0.657 0.00** RINDF = Rf + 0.814 (Rm-Rf)
6 KIJA 0.565 0.00** RKIJA = Rf + 0.757 (Rm-Rf) 7 TLKM 0.312 0.00** RTLKM = Rf + 0.569 (Rm-Rf) 8 BBCA 0.332 0.00** RBBCA = Rf + 0.586 (Rm-Rf) 9 UNTR 0.638 0.00** RUNTR = Rf + 0.802 (Rm-Rf) **)Significant at 5%
CAPM is concluded can explain the return significantly in all nine sectors represented by nine assets because all nine regression shown 0.00 F-test significant result. In terms of R2, the highest R2 is shown by INDF which has 0.657 R2. It means that market return can explain 65.7% of INDF return while the rest, which is 34.3%, is still caused by indeterminate factors which are not tested in this research. The smallest R2 is shown by TLKM which has 0.312 R2. It means that market return can only explain 31.2% of TLKM return while the rest, which is 68.8%, is still caused by indeterminate factors which are not tested in this research.
APT F-Test
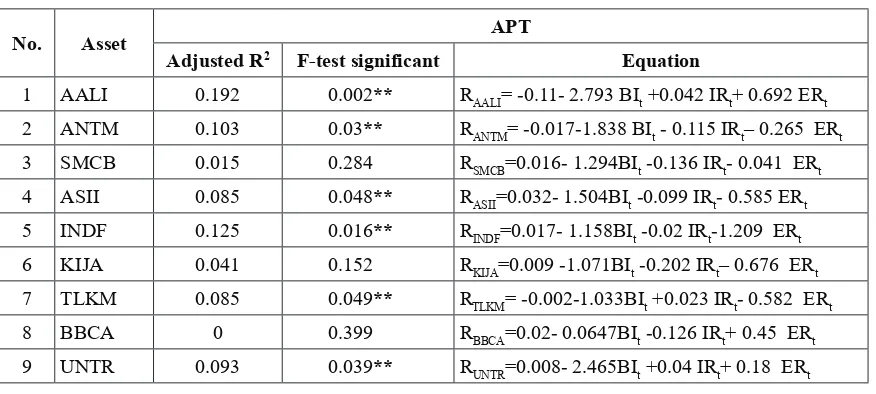
In this research, three macroeconomic variables, which are change in inflation rate, change in BI rate, and change in exchange rate in base of how rupiah a value of one US dollar, are used to explain the returns pattern of nine stocks chosen as samples. In this APT test, F-test is also used. F-test is used in order to find out the relationship between the dependent variable, which is each of assets chosen as samples, and the three independent variables simultaneously. The purpose of simultaneous analysis is to check if there is at least one independent variable that is related strongly with the dependent variable. Below are the results of the simultaneous regression using F-test.
Figure 3. APT F-test
No. Asset APT
Adjusted R2 F-test significant Equation
1 AALI 0.192 0.002** RAALI= -0.11- 2.793 BIt +0.042 IRt+ 0.692 ERt 2 ANTM 0.103 0.03** RANTM= -0.017-1.838 BIt - 0.115 IRt– 0.265 ERt
3 SMCB 0.015 0.284 RSMCB=0.016- 1.294BIt -0.136 IRt- 0.041 ERt
4 ASII 0.085 0.048** RASII=0.032- 1.504BIt -0.099 IRt- 0.585 ERt 5 INDF 0.125 0.016** RINDF=0.017- 1.158BIt -0.02 IRt-1.209 ERt
6 KIJA 0.041 0.152 RKIJA=0.009 -1.071BIt -0.202 IRt– 0.676 ERt 7 TLKM 0.085 0.049** RTLKM= -0.002-1.033BIt +0.023 IRt- 0.582 ERt
8 BBCA 0 0.399 RBBCA=0.02- 0.0647BIt -0.126 IRt+ 0.45 ERt
9 UNTR 0.093 0.039** RUNTR=0.008- 2.465BIt +0.04 IRt+ 0.18 ERt **) Significant at 5%
***) Significant at 1%
APT in this study is concluded can only explain the return significantly in six assets. They areAALI, ANTM, ASII, INDF, TLKM, and UNTR.They can be concluded have a significant relationship with three macroeconomics variable because their F-test significant values are less than the critical value, which is 0.05 In terms of R2, among the assets that have significant relationship with three
the rest, which is 91.5%, is still caused by indeterminate factors that are not tested in this research.
APT T-Test
For answering the research question no. 2 in this research, which is how much do
the change in inflation, interest rate, and exchange rate describe the stock price movement in all of Indonesian sectors, t-test is used to measure how significant each of the three macroeconomics variables tested explain each of samples tested. Results for the t-test are shown in figure 4.
Figure 4. APT T-test
No. Assets BIt IRt ERt
1 AALI
Significant 0.01*** 0.78 0.128 Std. Error 0.763 0.151 0.448
t-test 1.546 0.281 -3.66
2 ANTM
Significant 0.023** 0.464 0.569 Std. Error 0.788 0.156 0.463 t-test -0.573 -0.738 -2.332
3 SMCB
Significant 0.179 0.475 0.942 Std. Error 0.95 0.188 0.558 t-test -0.073 -0.72 -1.362
4 ASII
Significant 0.061** 0.53 0.21 Std. Error 0.787 0.156 0.462 t-test -1.268 -0.632 -1.912
5 INDF
Significant 0.134 0.897 0.009*** Std. Error 0.762 0.151 0.447 t-test -2.703 -0.13 -1.519
6 KIJA
Significant 0.294 0.319 0.26 Std. Error 1.012 0.201 0.594 t-test -1.138 -1.005 -1.058
7 TLKM
Significant 0.041** 0.819 0.049** Std. Error 0.493 0.098 0.582
t-test 2.013 0.23 -2.097
8 BBCA
Significant 0.912 0.274 0.189 Std. Error 0.577 0.114 0.339 t-test 1.329 -1.104 -0.111
9 UNTR
Significant 0.007*** 0.82 0.728 Std. Error 0.877 0.174 0.515
Based on Figure 4, analysis that can be made are as follow,
• In agriculture sector, which is represented by AALI, only BI rate that affect AALI significantly.
• In mining sector, which is represented by ANTM, only BI rate that affect ANTM significantly.
• In various industries, which is represented by ASII, only BI rate that can affect ASII significantly.
• In consumer goods sector, which is represented by INDF, only exchange rate that can affect INDF significantly. • In infrastructure, utility, and
transportation sector which is represented by TLKM, only BI rate and exchange rate that can affect TLKM significantly.
• In trade service and investment sector, which is represented by UNTR, only BI rate that affect UNTR significantly. • Comparative Analysis between APT
and CAPM
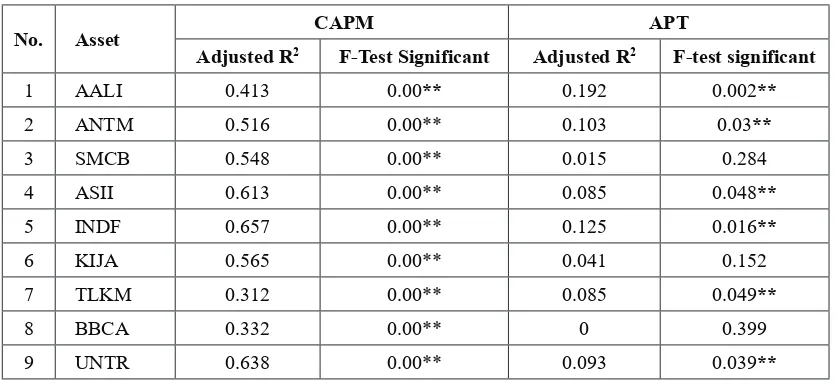
The main purpose of this research is to answer the question which models can describe the expected return of stocks in Jakarta Stock Exchange better? Is it CAPM or APT? To answer this question, the author use coefficient of determination as a tool to analyze which model that could explain the returns earned pattern in all nine asset samples which represent the nine sectors existed in Indonesia. Following table is a combine of table 4 and 5 which is needed to make comparative analysis easier.
Figure 5. Comparative Analysis
No. Asset CAPM APT
Adjusted R2 F-Test Significant Adjusted R2 F-test significant
1 AALI 0.413 0.00** 0.192 0.002**
2 ANTM 0.516 0.00** 0.103 0.03**
3 SMCB 0.548 0.00** 0.015 0.284
4 ASII 0.613 0.00** 0.085 0.048**
5 INDF 0.657 0.00** 0.125 0.016**
6 KIJA 0.565 0.00** 0.041 0.152
7 TLKM 0.312 0.00** 0.085 0.049**
8 BBCA 0.332 0.00** 0 0.399
9 UNTR 0.638 0.00** 0.093 0.039**
**) Significant at 5% ***) Significant at 1%
Based on figure 5, the author found that Capital Asset Pricing Model outperformed Arbitrage Pricing Theory model in all nine samples representing nine sectors in Indonesia in terms of both R2 and significant level. In terms of F-test significant value, CAPM has significant effect in all samples
• In this research, the author only use nine stocks chosen, which represent nine sectors in JKSE, in order to give big picture how much APT and CAPM describe the returns earned. For further research, it can use more samples to give a real prediction to each nine sectors in Indonesia.
• In this research, the author only do comparative between APT and CAPM. For further research, it can test other models such as fama three factor and five factor models in JKSE.
Notes on Contributor
Leo Julianto is a student at Institutional of Technology Bandung, Jawa Barat, Indonesia.
References
Chen, Roll, Ross, (1986), Economic Forces and Stock Market, The Journal of Business, 59.3:383-403. Dhankar, Singh, Rohini, (2005), Arbitrage
Pricing Theory and the Capital Asset Pricing Model-Evidence From the Indian, Journal of Financial Management & Analysis, 4.2:15-26. Eugene, F.F, (1970), “Multiperiod
C o n s u m p t i o n - I n v e s t m e n t Decisions.” American Economic Review, The journal of Finance. Fama, Eugene F., and Kenneth R. French,
(1992), The cross-section of expected stock returns, Journal of Finance 47, 427–465.
Harry Markowitz, (1952). “Portfolio Selection,” Journal of Finance, American Finance Association. Margellos, Athanasios, (1998), The
conditional CAPM and the cross section of expected returns: Evidence for the Canadian market, Finding, which is shown above in table,
shows that Capital Asset Pricing Model outperform Arbitrage Pricing Theory model in all samples which represent all sector in Indonesia. In terms of F-test significant value, based on both R2 and F-test significant, CAPM is concluded better than APT in explaining the returns earned pattern ofthe entire nine asset samples representing nine sectors existed in Indonesia Capital Market.
Conclusions and Recommendations Conclusions
In this study, the author aim to identify the most suitable model between CAPM and APT that can describe the stock returns better in nine sectors of Jakarta Stock Exchange during period January 2008 until December 2012. Based on the result founded in this study, the author find out that CAPM outperformed APT in all nine samples in terms of both APT and CAPM, which represent nine sectors in JKSE, in terms of both R2 and F-test significant. Besides, the author also found that among macroeconomic factors, there are only two macroeconomic factors that can affect certain samples significantly. They are change in BI rate, which affect AALI, ANTM, ASII, TLKM, UNTR, and change in exchange rate, which affect INDF and TLKM significantly.
Recommendations
Here are some recommendations regarding further research,
ProQuest Dissertations and Theses,
n/a.
Paavola, Mauri I, (2006), Tests of the Arbitrage Pricing Theory using macroeconomic variables in the Russian equity market.
Ross, S.A, (1976), The arbitrary theory of capital asset pricing, Journal of Economic Theory, 13, pp. 341–360 Ross, S.A; Westerfield, R.W; Jaffe, Jeffrey,
(2010), Corporate Finance: 371-391, Singapore, McGraw Hill. Theriou et al, (2005), The Cross-Section
of Expected Stock Returns: An Empirical Study in the Athens Stock Exchange, Journal of Managerial Finance, 31:58.
Treynor, J. L, (1961), Market Value, Time, and Risk, Unpublished manuscript, Rough Draft 8/8/61, 95-209.
Treynor, J. L, (1962), Toward a Theory of Market value of Risky Assets, Unpublished manuscript, Rough Draft, date by Mr Treynor to the fall of 1962. A final version was published in 1999, in asset Pricing and portofolio Performance Robert A. Korajczyk (Editor) London: Risk Books, pp. 15-22.
Wang, Z, (1996), The Conditional CAPM and the Cross-Section of Expected Returns, The Journal of Finance. 51(1)3-53.