CHAPTER IV
DATA PRESENTATION AND RESEARCH FINDINGS
This chapter discussed the data which had been collected from the research in the field of study. this case consisted of description of the data, normality and homogeneity test using Kolmogorov-Smirnov in SPSS 18.0 program and discussion.
A. Presentation of the Data
1. The Result of Pre-Test Score of the Control and Experiment Group
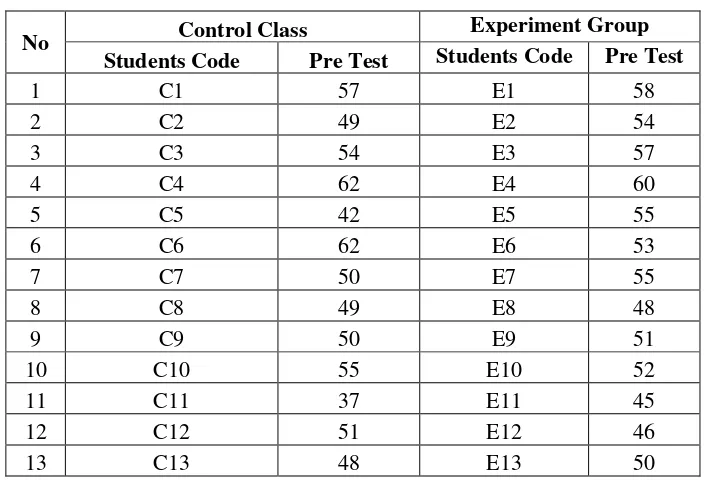
The Pre-Test was conducted to the control group in X-5 on April 23rd, 2016, at 08.00-09.30 am and Pre-test was conducted to the Experiment Group in X-3 at 09.50-11.30 am. The students wrote the text on paper and chose the topic to develop their idea in a text. The Pre-test scores of the classes were presented in Table 4.1.
Table 4.1 The Pre-Test Score of Control Group
No Control Class Experiment Group
Students Code Pre Test Students Code Pre Test
14 C14 58 E14 49
15 C15 55 E15 58
16 C16 63 E16 60
17 C17 55 E17 59
18 C18 59 E18 57
19 C19 66 E19 55
20 C20 55 E20 53
21 C21 61 E21 59
22 C22 53 - -
SUM 1191 - 1134
Highest Score 66 - 60
Lowest Score 37 45
Mean 54.14 - 54
Median 55 - 55
Modus 52.23 - 55
Standard Deviation 6.958 - 4.539
Based on the result of research in class X-5 as control group, the highest pre- test score of student control class was 66 and the lowest score of control class was 37 with the sum of the data was 1191, the mean was 54.14, the median was 55 and modus was 52.23. Then,based on the pre-test in X-3 as Experiment Group, the
1191
1134
66 37 54.14 55 52.23 60 45 54 55 55
Control Class Experiment Class
Chart 4.1 The Result of Pre-Test Score of the Control and Experiment Group
highest score 60 and the lowest score was 45 with the sum 1134, the mean was 54, the median was 55 and modus 55.
2. The Result of Post-Test Score of the Control Group and Experiment
Group
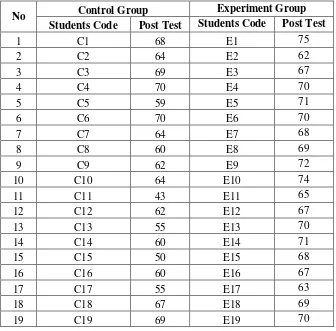
The Post-Test was conducted to the control group in X-5 on May 21st, 2016, at 08.00-09.30 am and The Post-Test was conducted to the control group in X-5 on May 21st, 2016, at 09.30-11.30 am. The students wrote the text on paper and chose the topic to develop their idea in a text.The Post-test scores of the classes were presented in Table 4.1.
Table 4.2 The Post-Test Score of Control Group and Experiment Group
No Control Group Experiment Group
Students Code Post Test Students Code Post Test
20 C20 61 E20 70
21 C21 71 E21 67
22 C22 63 - -
SUM 1366 - 1445
Highest Score 71 - 75
Lowest Score 43 - 62
Mean 62.09 - 68.81
Median 62.50 - 69
Modus 59.57 - 70
Standard Deviation 6.921 - 3.172
Based on the result of research in class X-5 as Control group, the highest post- test score of student control group was 71 and the lowest score of control class was 43 with the sum of the data was 1366 mean was 62.09 and modus was 59.57. Then, based on the result of research in class X-3 as Experiment group, the highest post- test score of student experiment group was 75 and the lowest score of control class was 62 with the sum of the data was 1445 mean was 68.81 and modus were 70.
1366 1445
71 43 62.09 62.5 59.57 75 62 68.81 69 70
Control Class Experiment Class
Chart 4.2 The Post-Test Score of Control Group and Experiment Group
3. Comparison Result of Pre-Test and Post-Test Score of Experiment
Group
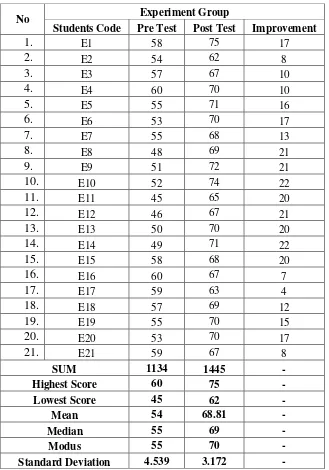
The comparison between students’ pre-test and post-test after doing the experiment can be seen in the following Table 4.5.
Table 4.3 The Comparison Result of Pre-Test and Post- Test Score of Experimental Group
No Experiment Group
Students Code Pre Test Post Test Improvement
Based on the data above, the mean of pre-test were 54 and 68.81 in post-test. It could be concluded that the students writing ability of experiment class was increased from pre-test to post-test.
4. Testing the Normality and Homogeneity
a. Normality Test
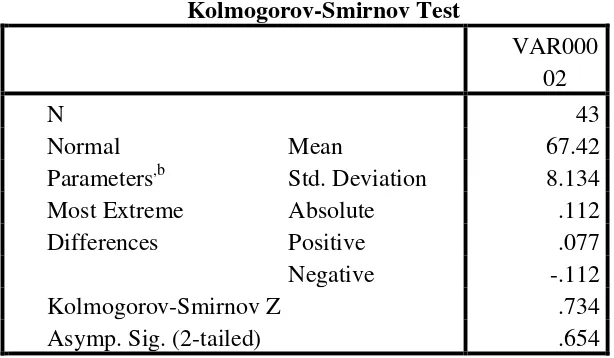
The criteria of the normality test of post-test if the value of (probability value/critical value) was higher than or equal to the level of significance alpha defined, it means that the distribution was normal. This study used SPSS 18 to measure the normality of the data.
1134
1445
60 45 54 55 55 75 62 68.81 69 70
Pre-test Post-test
Chart 4.3 The Comparison Result of Pre-Test and Post- Test Score of Experimental Group
1) Testing Normality of Post Test Experimental and Control Group
Table 4.4 Testing Normality of Post Test Experimental and Control Group
Kolmogorov-Smirnov Test
VAR000 02
N 43
Normal Parameters,b
Mean 67.42
Std. Deviation 8.134 Most Extreme
Differences
Absolute .112
Positive .077
Negative -.112
Kolmogorov-Smirnov Z .734
Asymp. Sig. (2-tailed) .654
a. Test distribution is Normal. b. Calculated from data.
b. Homogeneity Test
2) Testing Homogeneity of Post Test Experimental and Control Group
The criteria of the homogeneity test of post-test were if the value of (probability value/critical value) was higher than or equal to the level of significance alpha defined (r = a), it means that the distribution was homogeneity.
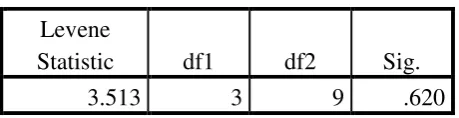
Table 4.5 Testing Homogeneity of Post-Test Experimental and Control Group
Test of Homogeneity of Variances
Levene
Statistic df1 df2 Sig.
3.513 3 9 .620
Based on the calculation using SPSS 18 above, the value of (probably value/critical value) from post test of the experimental and control group on Homogeneity of Variances in sig column is known that p-value was 0.620. The data in this study fulfilled homogeneity since the p-value is higher 0.500> 0.05.
1. Testing Hypothesis Using Manual Calculation
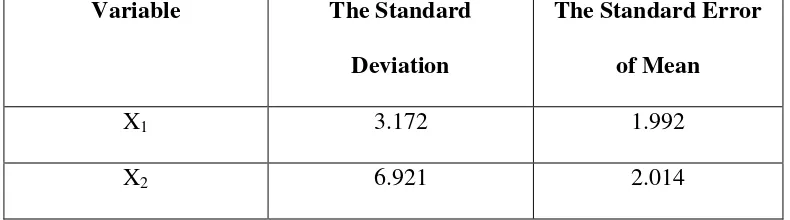
Table 4.16
The Standard Deviation and Standard Error of X1 and X2
Variable The Standard
Deviation
The Standard Error
of Mean
X1 3.172 1.992
X2 6.921 2.014
X1 = Experimental Group X2 = Control Group
The table showed the result of the standard deviation calculation of X1 was 3.172 and the result of the standard error mean calculation was 1.992. The result of the standard deviation calculation of X2 was 6.921 and the result of the standard error mean calculation was 2.014.
The next step, the writer calculated the standard error of the difference mean between X1 and X2 as follows:
Standard error of mean of score difference between Variable I and Variable II
SEM1– SEM2 = SEM12 + SEM22
SEM1 – SEM2 = √( ) ( ) SEM1 – SEM2 = √
SEM1– SEM2 = 4.832712
SEM1– SEM2 = 4.8
The calculation above showed the standard error of the differences mean between X1 and X2 was 2.8. Then, it was inserted to the ttest formula to get the value of t test as follows:
to =
–
to=
–
to =
to = 4.08686
to = 4.086
Then, the writer interpreted the result of t-test; previously, the writer accounted the degree of freedom (df) with the formula:
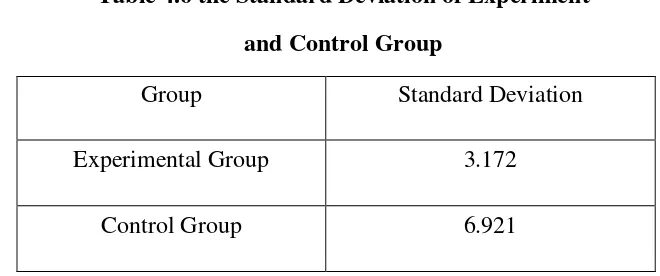
Table 4.6 the Standard Deviation of Experiment
and Control Group
Group Standard Deviation
Experimental Group 3.172
t
observed=
1. Testing Hypothesis Using SPSS 18.0 Program
The writer also applied SPSS 18.0 program to calculate t-test in the testing hypothesis of the study. The result of the t-test using SPSS 18.0 was used to support the manual calculation of the t-test. The result of the test using SPSS 18.0 program could be seen as follows :
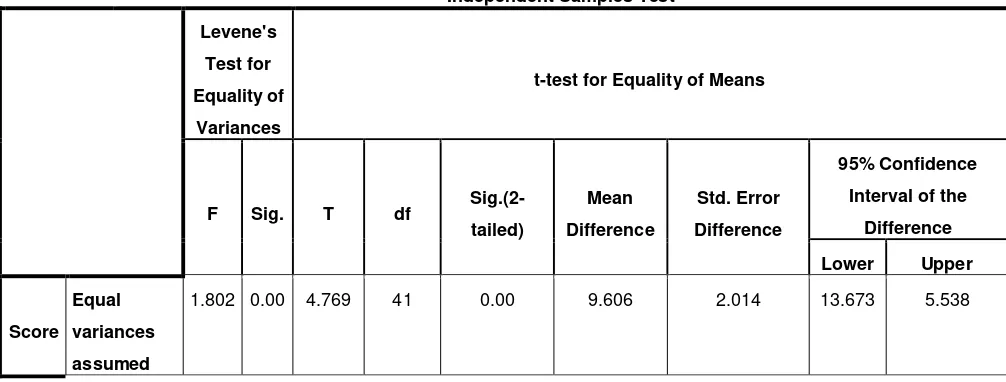
Table 4.8 The Calculation of T – Test Using SPSS 18.0
Independent Samples Test
Levene's
Test for
Equality of
Variances
t-test for Equality of Means
Sig.(2-Independent Samples Test
Levene's
Test for
Equality of
Variances
t-test for Equality of Means
F Sig. T df
Sig.(2-The table showed the result of t – test calculation using SPSS 18.0 program.
To know the variances score of data, the formula could be seen as follows:
If α = 0.05 < Sig 0.00, Ho accepted and Ha rejected If α = 0.05> Sig 0.00, Ha accepted and Ho rejected
B. Interpretation
The interpretation of the result of t-test using SPSS 18.0 program. It could be interpreted based on the result of a calculation that Ha stating that the use of guided writing using facebook gives effect to students’ ability in writing recount text at X-3 graders of SMA Muhammadiyah 1 Palangka Raya was accepted. Ho stating that The use of guided writing using facebook does not give effect to students’ ability in writing recount text at the X-3 graders of SMA Muhammadiyah 1 Palangka Raya was rejected. It meant that teaching writing recount text with guided writing using facebook at X-3 grades of SMA Muhammadiyah 1 Palangka Raya gave significant effect at 5% and 1% significance level.
C. Discussion
The result of the analysis showed that there was a significant effect of guided writing strategy using Facebook in writing recount text at tenth graders of SMA Muhammadiyah 1 Palangka Raya. It can be seen from the means score between pre-test and post-test. The mean score of post test reached a higher score than the mean score of Pre-test (X= 68.81 < Y=54). It indicated that the students’ score increased after conducting treatment. In other
In addition, after the data was calculated using the ttest formula using SPSS 18.00 program showed that the tobserved was 4.769. In addition, After the students have guided writing strategy by using Facebook, the writing score was higher than before implementing it. This finding indicated that Guided writing strategy using Facebook was effective and supported the previous research done by Dafi Kusnita, Vayye Langen Dyan and Yosef Dwi Anggara that also stated guided writing strategy using Facebook was effective.75
In teaching learning process, taught writing recount text by guided writing strategy using Facebook was a tool used by the writer to teach the students. It could be seen from the score of students how the used of Facebook gave positive effects for students writing recount text. It meant that it has an important role in teaching learning process. It was answered the problem of the study which “Is there any significant effect of guided writing strategy using facebook toward the students in writing ability of tenth grade at SMA Muhammadiyah 1 Palangka Raya?
Facebook as means for language learning, effectively enhanced the writing recount text at tenth graders of SMA Muhammadiyah 1 Palangka Raya. The students writing recount text was enhanced after the treatment when they were given opportunities to use guided writing strategy on Facebook in the learning process. They wrote better recount text using more meaningful contents within a well-organized text in the post-test.
75