176
The Role of Agricultural Sector on The Economy of West Nusa
Tenggara
(Input-Output Analysis Approach)
Nurul Marlianti1, Wahyunadi2, Iwan Harsono2 Post Graduate Program University of Mataram
Study Program Economics Science Email: [email protected]
Abstract
The agricultural sector is a sector that has a strategic role in the national economic development structure. The agricultural sector in West Nusa Tenggara is a sub-sector of the regional economy that plays an important role in the formation of GDP. Therefore, the development of agriculture in NTB is not only intended to accommodate the rural labor and reduce the rate of urbanization but also more oriented to increase farmers' income through increased agricultural products value-added. The purpose of this study is: To analyze the role of agriculture and forward and backward linkage in the economy of West Nusa Tenggara. Additionally, the purpose of this research to analyze multiplier output in the agricultural sector to the economy of West Nusa Tenggara. The data used in this research is data of Input-Output West Nusa Tenggara 2013. The analytical method used is the Input-Output Analysis method. The results show that the sub-sector of food crops which has the output of 7.79 trillion, the highest output in the agricultural sector with a share around 41.7 percent. Onion sub-sector has the numbers backward linkages of the highest, respectively 5.43424 and 6.69614 compared to other sectors in agriculture and other production sectors in the economy. The highest total of Direct Forward Linkages and backward linkages Figures in the agricultural sector is Tobacco sub-sector that Each of 2.44383 and 3.93349. Peanuts have the highest multiplier in the agricultural sector in the province of West Nusa Tenggara the which is equal to 1.69548.
Keywords: Agriculture, Input-Output Analysis, forward and backward
linkage, Multiplier Output
INTRODUCTION
Indonesia, known as an agrarian country, should rely on the agricultural sector as an economic source or as a support for development. According to Dumairy (1996) the structure of the Indonesian economy based on the macro-sectoral review until the 1990s is still agrarian, but now it has begun to have an industrial structure. This industrialization has not been supported by high employment absorption. Until now, the sector that is able to absorb high labor is the agricultural sector (Khoyanah, 2015).
177
sector contributes 25.69% of the total GDP of West Nusa Tenggara, increasing than the previous year, 23.26%.
According to Tarigan (2006), the input-output analysis is an analysis of the region's economy comprehensively because it sees the inter-linkages between economic sectors in the region as a whole. If a particular sector engages in production activities, the sector increases its demand for the other sector's production. Based on these linkages sector leader or leading sector could be obtained, so that the appropriate policy towards the sector could be taken. Therefore, a study of the role of the agricultural sector in the economy of West Nusa Tenggara is necessary, as the largest form of GDP and the largest employer absorber. The role of the agricultural sector that needs to be known in the above issues involves inter-sectoral linkages and multiplier impacts of the agricultural sector so the appropriate policies in agricultural sector could be established in order to increase economic growth of West Nusa Tenggara.
LITERATURE REVIEW
The agricultural sector is an important sector in the Economic development of Indonesia. But its also lack Attention from the government so that most of the farmers are needy. whereas this sector not only supporting in the absorption of manpower but also where most of the population hanged their life. Up to now, Agriculture in Indonesia unable to offer maximum results as seen from the farmer's welfare and national income generated from this sector. Besides of large and diverse natural resources, in addition to a substantial share of national income, the magnitude of national exports, and the size of Indonesia's dependent population on this sector, as well as the role of farmers Providing food for the community.
According to Kuznets (Deliarnov, 2005), the agricultural sector contributes to Growth and national economic development in 4 forms, namely:
1. Product Contributions, for example, provide raw materials for manufacturing industries such as textiles, food, beverages, and others. 2. Market Contributions, for example, the establishment of the domestic
market for industrial goods and consumption
3. The contribution of production factors causes the inclusion of the role of agriculture in Economic development, then the transfer of surplus capital and agricultural sector to other sectors.
4. The contribution of agricultural income as the most important source for the surplus balance sheet. Through export of agricultural products and agricultural products that import products.
5. The role of the agricultural sector in economic development is very important because the majority of people in poor countries rely on the sector. If the planners are concerned by their people welfare, then the only way is to improve the welfare of most of the people living in the agricultural sector. The role of agriculture as the backbone of the national economy is evident not only in the normal situation but especially in times of crisis.
178
five conditions that must exist in agricultural development (Mubyarto, 1995). If any of these conditions are not met then the agricultural development ceases, the requirements are:
1. There is a market for farm products 2. Technology that always amends
3. Availability of materials and tools of production 4. The existence of production incentives for farmers 5. The availability of clockwork transportation
According to Todaro, (2006) there are three points in the evolution of agricultural production as follows:
1. Traditional farms with low productivity
2. Agricultural products have started to occur where existing agricultural products are sold to the commercial sector or the market, but capital and technology use is still low
3. Modern agriculture with high productivity caused by high capital and technology use.
THEORETICAL FRAMEWORK
The activity of an economic sector cannot be separated from the others, so a policy that is directly related to a sector will affect the macroeconomics. The role of the economic sectors is essentially a representation of the interrelationships between the sectors of the economy whose linkages need to be further analyzed against other sectors. The overall balance of all sectors of the economy is a unified system, with equilibrium (or imbalance) in one sector affecting equilibrium or imbalance in other sectors. Changes in one sector will affect other sectors. The role of the agricultural sector in West Nusa Tenggara analyze by using input-output analysis. Analysis of backward linkages and forward is used to determine the structure of the agricultural sector which in turn can be determined subsectors are a key sector in the agricultural sector. This study aggregates other sectors in the economy in addition to the agricultural sector, so it can be seen the effect of the agricultural sector on the economy as a whole.
Picture 1. Conceptual Framework Source: Research Journal
AGRICULTURE
FORWARD LINKAGES
INPUT/OUTPUT
MULTIPLIER OUTPUT ANALYSIS
179 RESEARCH METHODS
Method of collecting data
The data collection in scientific research is intended to obtain relevant and realistic materials. In this study data collection is done by using the documentation method or literature method study. In this study the data obtained from the Central Bureau of Statistic of West Nusa Tenggara.
Analysis Method Input Coefficient
In Table IO, the input coefficient or technological coefficient is the ratio between the number of sector i outputs used in sector j (Xij) with the total sector input j (Xj). This coefficient can be translated as the number of inputs of sector i required to produce one unit of sector output j. Systematically can be written (Mauludin, 2008):
Aij =
Where: Aij is amount of i sector output which is used as input by j sector. Thus the matrix can be composed as follows:
a 11 x 1 + a 12 X 2 + ... ... ... ... + a 1n X n + F 1 = X 1 a 21 x 1 + a 22 X 2 + ... ... ... ... + a 1n X n + F 2 = X 2 :::::
A n1n2 X X 1 + a 2 + ... ... ... ... + a n x n + F n = X n
If there is a change in the final request, there will be a change in the pattern of national income. If it is written in equation, then it can be written as follows:
AX + F = X atau F= X – AX X = (I - A)-1 F Where:
I = Nxn-sized identity matrix whose element contains the number one on diagonal and zero on the other
F = final demand X = Output
(HE) = Leontief matrix
(I - A) -1 = Reverse Matrix Leontief
In the IO analysis, Leontief inverse matrix has a very important role as an analysis tool that reflects the direct and indirect effects of final demand changes to the output of the sectors in the economy.
Output Change Analysis
To analyze the impact of changes on output subsidies used input-output models with a supply-side approach. In this analysis, the primary input becomes exogenous factor. This means economic growth both sectorally and in total are affected by changes in the primary input (Firmansyah, 2006: 41).
In the model of input - output with supply approach is in column form of the equation is:
Xj =
180 X 2 = z z 12 + 22 + ... z n2 + V 2
X n = z z 1n + 2n + ... z nn + V n Aij output coefficient values are:
āij
= atau Ā =
Z
wherein Z is a matrix of transactions that have an element z ij So
Z = (X) A
Then the results obtained
X '=
X 'indicates that X is vector line, which is the transpose of the column vector
X as before.
A : The output coefficient V : Vector primary input
: Matrix inverse output
If the fertilizer subsidy is denoted (w), then the output changes caused Due to (w) change are:
Inter-sector linkages (Backward and Forward Linkage)
Analysis of linkages between sectors divided into rear linkages (backward linkage) and the link to the front (forward linkages). Both linkages are an analytical tool used to determine the level of linkage of a sector to other sectors in the economy. The backward link is an analytical tool to determine the degree of relevance of a sector to other sectors that contribute as an input to it. The linkage to the future is an analytical tool to determine the degree of linkage between a sector that produces output, to be used as input for other sectors (Kuncoro, 1997). The backlinking formula of a sector can be expressed as follows:
Where:
Lbj : Index of backward linkages Xj : The value of j-product
Xij : The input value "i" provided for producing "j" _ij : coefficient input - output Leontief
181
the front (forward linkage). The forward linkage is obtained from the inverse backward link, its mathematical formulation: (Kuncoro, 1997).
To develop the value analysis of the above linkage, then Rassmusen model is used. This measurement method to determine the intensity of the linkage or multiplier production.
In some analysis using input-output model Rassmusen method is also called a power calculation method for distributing the calculation of the effect of backward linkages. Meanwhile, on the calculation of future linkages, Rassmusen method is also called as a method of calculating the degree of sensitivity.
Spreading Power
Spreading power shows how much influence the linkage on backward linkage calculations. By using Rassmusen method, the distribution power coefficient can be formulated as follows (BPS, 2005: 65).
Where
Ɑj : distribution power coefficient
Bij : element of inverse matrix from row i column to j N : many matrix sectors
Criteria
If _j = 1, the backward linkage of the jth sector is equal to the average backwardness of all economic sectors.
If _j <1, Keter backward linkages to the sector-j is lower than the average linkages behind all sectors of the economy.
If _j> 1, the backward linkage of the jth sector above the average of the backward linkages of all economic sectors. Or the jth sector is gaining high influence from other sectors.
A sector is said to have a high spreading power if the growth of these sectors affects other sectors, so it can be called the total of one unit of a sector's final demand for economic sector growth. The coefficient is shown by _j as the influence of backward linkages when > 1 gives the meaning that the spread of j sector is relatively higher than other sectors.
Degree of Sensitivity
182 Where
Βi : Coefficient degree of sensitivity
Bij : The matrix element is ridiculous from row i column to j N : Many sectors of the matrix
criteria
If βi = 1 forward linkages to the sector-i are equal to the average forward linkages across economic sectors.
If βi <1 forward linkages to the sector-i is lower than the average forward linkages to all sectors of the economy.
If βi> 1 forward linkages to the sector-i above average forward linkages across economic sectors. Or the i-th sector high gain influence from other sectors.
The coefficient is shown by βi as influence degree of relatedness to the front (forward linkages) when > 1 gives the sense that the degree of sensitivity of the sector i is relatively higher than other sectors which have βi < 1, namely the production demand other sectors are very influenced by sector i growth.
A sector which the coefficient value ɑj> 1 and βi> 1 is a key sector or can be said as a leading sector in the region concerned because their forward and backward linkages are high.
Multiplier Analysis
Output Multiplier Number
The multiplier outputs sector j is the total value of output produced by the economy to meet (or due to) the change in one unit of final demand in the sector. The multiplier output is the number of columns of the Leontief inverse matrix element. Notation, formulated as:
Where
I : 1, 2, ...., n
ɑ
ij : Element of Leontief opposite matrixO ij : Multiplier
ɑ
sector output j and ij is the Leontief inverse matrix elementIncome Multiplier Number
Household income multiplier of a sector shows the changes in the amount of income received by households that were created by the addition of one unit of final demand money in a sector. The pathway of the impact of changes in demand for increased household incomes can be explained by case an increasing final demand.
The increase in final demand sectors will improve sectoral and total economic output. This can be measured through the multiplier output. The increase in output will increase the demand for labor, it will increase remuneration to households that have the manpower.
Matrix of household income multiplier:
183 Where:
H R = vector row n + 1, because row n are the property transaction and the coefficient matrix input
H R = [a n + 1.1+ 1.2 ... a n a n + 1, n]
a n + 1h =, j = 1, 2, 3, ..., n
Where X n + 1h in the formula is the same as the line v (primary input). For each sector, the household income multiplier figure becomes
RESULTS AND DISCUSSION Agricultural Sector Output
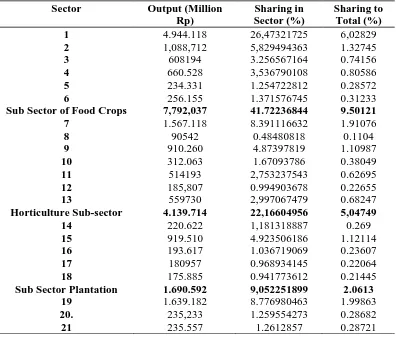
The output is the value of production produced by units of economic activity either in the form of goods or services in an area. Assessment is based on the price at the producer level per unit of production. The output of agriculture is the total output of all activities in the agricultural sector. In 2013 the output of agriculture reached 18.67 trillion rupiahs or about 22.77 percent of the total output created in NTB.
Table 1. Agricultural Output of West Nusa Tenggara
Sector Output (Million
Rp)
Sharing in Sector (%)
Sharing to Total (%)
1 4.944.118 26,47321725 6,02829
2 1,088,712 5,829494363 1.32745
3 608194 3.256567164 0.74156
4 660.528 3,536790108 0.80586
5 234.331 1.254722812 0.28572
6 256.155 1.371576745 0.31233
Sub Sector of Food Crops 7,792,037 41.72236844 9.50121
7 1.567.118 8.391116632 1.91076
8 90542 0.48480818 0.1104
9 910.260 4.87397819 1.10987
10 312.063 1.67093786 0.38049
11 514193 2,753237543 0.62695
12 185,807 0.994903678 0.22655
13 559730 2,997067479 0.68247
Horticulture Sub-sector 4.139.714 22,16604956 5,04749
14 220.622 1,181318887 0.269
15 919.510 4.923506186 1.12114
16 193.617 1.036719069 0.23607
17 180957 0.968934145 0.22064
18 175.885 0.941773612 0.21445
Sub Sector Plantation 1.690.592 9,052251899 2.0613
19 1.639.182 8.776980463 1.99863
20. 235,233 1.259554273 0.28682
184
22 2,673 0.014314581 0.00326
23 117172 0.627393693 0.14287
24 68.058 0.364413163 0.08298
Sub Sector Livestock 2,297,875 12,30394187 2.80177
25 36497 0.195422743 0.0445
Forestry Sub-sector 36497 0.195422743 0.0445
26 278.596 1.491740608 0.33969
27 481,175 2,576448204 0.58669
28 46.204 0.2473964 0.05634
29 1.913.233 10,24438027 2.33278
Sub Sector Fisheries 2,719,208 14.55996548 3.3155
Agricultural Sector 18.675.923 100 22.77177
Source: Input-Output Table 2013 NTB Province, processed
The food crops sub-sector has an output of 7.79 trillion which is also the highest output in the agricultural sector with a share of about 41.7 percent. The food crops sector contributes about 9.50 percent of the output of all economic sectors in NTB in 2013. Rice commodities have the largest share of food crops sub-sector of 26.47 percent or about 6.02 percent of the output of all commodities in NTB Province year 2013. The commodity of tubers has the lowest output in the food crop sub-sector of 234 billion rupiahs or has a share of 1.25 percent of the food crop sub-sector and 0.29 percent of the output of all commodities in the province of NTB in 2013.
Linkage Analysis
Linkage analysis Forward (Forward Linkages)
The index of total forward-looking linkages that have a value greater than one indicates that the sector has a strong ability to drive the growth of its downstream output or in other words the ability of the sector to drive production growth other sectors that use inputs from the sector.
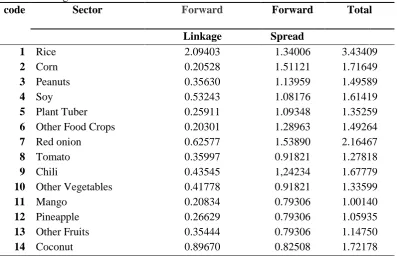
Table 2. Linkage Forward Value
code Sector Forward Forward Total
Linkage Spread
1 Rice 2.09403 1.34006 3.43409
2 Corn 0.20528 1.51121 1.71649
3 Peanuts 0.35630 1.13959 1.49589
4 Soy 0.53243 1.08176 1.61419
5 Plant Tuber 0.25911 1.09348 1.35259
6 Other Food Crops 0.20301 1.28963 1.49264
7 Red onion 0.62577 1.53890 2.16467
8 Tomato 0.35997 0.91821 1.27818
9 Chili 0.43545 1,24234 1.67779
10 Other Vegetables 0.41778 0.91821 1.33599
11 Mango 0.20834 0.79306 1.00140
12 Pineapple 0.26629 0.79306 1.05935
13 Other Fruits 0.35444 0.79306 1.14750
185
code Sector Forward Forward Total
Linkage Spread
15 Tobacco 2.44383 1.48966 3,93349
16 Cashew 0.69989 1,21519 1.91508
17 Coffee 0.48969 0.74627 1,23596
18 Other Plantation Plants 0.40448 0.67508 1.07956
19 Cow 0.74035 0.77272 1.51307
20. Buffalo 0.37810 0.88955 1,26765
21 Other animals and the
results
0.61061 1.03872 1.64933
22 Laying Chickens 2.26087 1.11962 3.38049
23 Chicken broiler 2.08344 1.12958 3.21302
24 Poultry and the results 1.89339 1.29036 3.18375
25 Wood and other forest
products
1.14624 1.06079 2.20703
26 Seaweed 0.18017 1.55104 1.73121
27 Marine fisheries 1,23388 1.40970 2.64358
28 Breeding of milkfish 0.65221 1.50145 2.15366
29 Other Land Fishing 0.32751 1.50145 1.82896
Source: Input-Output Table 2013 province, processed
Results of direct forward linkage analysis on the agricultural sector of West Nusa Tenggara Province in 2013 shows that tobacco has the highest index value about 2.44383. This value indicates that if an increase in final demand on other sectors by one unit the tobacco sector will experience an increase in output of 2.44383 units. This shows the role of the sector in providing the output it generates for use as input by other sectors in the production process and used to meet substantial final demand. While the highest index value of indirect forward linkage is the seaweed sector about 1.55104. The value indicates that if there is an increase in output of one unit of output it will increase the output of other sectors by 1.55104.
Grounded on table values linkage forward total agricultural sector, we can see that all sub-sectors of agriculture to the economy of West Nusa Tenggara has the index value greater than one ( > 1), which means that all sub-sectors of agriculture are the sectors that able to increase Production growth of other sectors. From the analysis of forward linkages input output table that have been done, the sector that has the highest forward linkages are tobacco sector is equal to 3.93349. Tobacco is a sector that has a direct impact to generate output in improving the economy of other sectors in regional development in West Nusa Tenggara without neglecting other sectors in order to revitalize agriculture.
Backward linkage analysis (Backward Linkages)
186
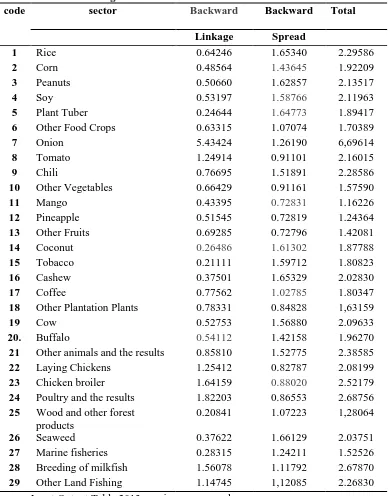
Table 3. Backward linkages Values
code sector Backward Backward Total
Linkage Spread
1 Rice 0.64246 1.65340 2.29586
2 Corn 0.48564 1.43645 1.92209
3 Peanuts 0.50660 1.62857 2.13517
4 Soy 0.53197 1.58766 2.11963
5 Plant Tuber 0.24644 1.64773 1.89417
6 Other Food Crops 0.63315 1.07074 1.70389
7 Onion 5.43424 1.26190 6,69614
8 Tomato 1.24914 0.91101 2.16015
9 Chili 0.76695 1.51891 2.28586
10 Other Vegetables 0.66429 0.91161 1.57590
11 Mango 0.43395 0.72831 1.16226
12 Pineapple 0.51545 0.72819 1.24364
13 Other Fruits 0.69285 0.72796 1.42081
14 Coconut 0.26486 1.61302 1.87788
15 Tobacco 0.21111 1.59712 1.80823
16 Cashew 0.37501 1.65329 2.02830
17 Coffee 0.77562 1.02785 1.80347
18 Other Plantation Plants 0.78331 0.84828 1,63159
19 Cow 0.52753 1.56880 2.09633
20. Buffalo 0.54112 1.42158 1.96270
21 Other animals and the results 0.85810 1.52775 2.38585
22 Laying Chickens 1.25412 0.82787 2.08199
23 Chicken broiler 1.64159 0.88020 2.52179
24 Poultry and the results 1.82203 0.86553 2.68756
25 Wood and other forest products
0.20841 1.07223 1,28064
26 Seaweed 0.37622 1.66129 2.03751
27 Marine fisheries 0.28315 1.24211 1.52526
28 Breeding of milkfish 1.56078 1.11792 2.67870
29 Other Land Fishing 1.14745 1,12085 2.26830
Source: Input-Output Table 2013 province, processed
onion is the sector which has the highest directly backward linkage index value at 5.43424, which mean that if there is a final demand increase of the onion sector by one unit then for other economic sectors in West Nusa Tenggara will experience growth in output about 5.43424 units. So do the others sectors of agriculture which have an index value of directly backward linkages greater than one. Agricultural sectors that have a high deployment Indicating the sector has stronger impetus power than the other sector.
187
the greatest relation with the upstream production sector. If there is an increase in the final demand seaweed sector by 1 unit will require additional input from the sector and other sectors amounted to 1.66129 units.
The results of total backward linkage analysis input-output table above, it can be seen that the sector has the highest backward linkages is onion sector. With the results of this analysis, it can be said that the increase of 1output on the onion sector will have a greater impact on the economy when compared with the impact that caused the increase of 1 output of other sectors. Figures 6.69614 means that an increase of 1 onion sector output will increase its input demand either directly or indirectly on the other sectors of the economy (including onion sector itself) Rp. 6.69614. To meet the demand for the onion sector, the sectors in the economy (including the onion sector itself) will increase production by that number.
From the analysis of backward linkages and linkage to the front (forward linkages) West Nusa Tenggara showed that all sub-sectors of Agriculture of West Nusa Tenggara has a value linkage to the rear and linkage forward on one (> 1), which Means that the agricultural sector is a potential sector in the economy of West Nusa Tenggara.
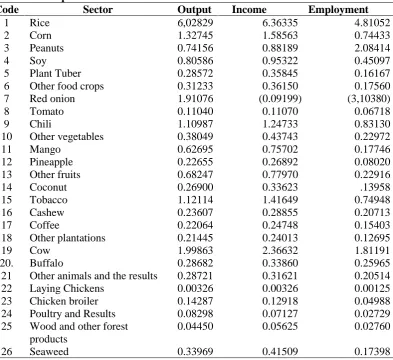
Multiplier Analysis
Multiplier Analysis (multiplier effect) is an analysis to calculate the total value of production of all sectors of the economy that is necessary to meet final demand value of output, income and employment sector.
188
27 Sea Fisheries 0.58669 0.73063 0.85027
28 Breeding of milkfish 0.05634 0.05208 0.03735
29 Other terrestrial fisheries 2.33278 2.39881 4.19549 Source: Input-Output Table 2013 province, processed
The sector that has the highest value for the impact multiplier analysis on output, revenue, and rate of employment is the rice sector. The highest value indicates that the output of rice sector used by most of other sectors and has a major effect to increase output for other sectors. The highest multiplier impact on income is rice sector, explaining that output from the rice sector is used in most other sectors to increase revenues in each sector. While the analysis of the highest number of employment multipliers is also obtained by the rice sector which states that the output produced in the rice sector used in other sectors will be able to increase employment opportunities for these sectors.
CONCLUSION
Based on the above description, it can be concluded as follows:
1. The largest sub-sector in agriculture sector is food crop sub-sector with the output of 7.79 trillions which is also the highest output in the agriculture sector with a share of about 41.7 percent. The food crops sector contributes about 9.50 percent of the output of all economic sectors in NTB in 2013.
2. The impact of backward and forward linkages.
In 2013 there were seven sectors that have an index linkage forward more than one, namely the tobacco sector, laying chicken sector, broilers sector, rice sector, the poultry sector and its results, timber and other forest products and sectors marine fisheries. The output generated by the sector is an intermediary commodity, in that it is a raw material for industries and other sectors of the economy.
In 2013 there were seven sectors that have the index backward linkages more than one, namely the tobacco sector, the sector of the tomato, laying chicken sector, broiler sector, poultry sector and its results, milkfish cultivation and other land fisheries sector. Agricultural sectors have a high spread, indicates that the sector has a strong impetus compared to other sectors.
From the analysis of backward linkages and forward linkages, West Nusa Tenggara indicates that all sub-sectors of Agriculture has backward and forward linkage greater than one (> 1), which means the agricultural sector is a potential sector (a key sector) in the economy of West Nusa Tenggara. 3. Impact of Multiplier Income
The results of the multiplier analysis (multiplier effect) can be seen that the most influence sectors on the increase of agricultural sector is Rice sector, so that the most affect in revenue excalation (income) is the rice sector, and so do the most affect in excalation of work chance (employment) in the agricultural is Rice sector.
189 Suggestion
Based on the conclusion of the study on the role of agriculture in the economy of West Nusa Tenggara, then the advice that can be given as follows:
1. All sub-sectors of the agricultural should give more attention in its development as the Agriculture has the power to push and backward linkages above average, so it will be able to encourage the development of other economic sectors.
2. The Government of West Nusa Tenggara, especially BAPPEDA, if they want to increase incomes and reduce unemployment in West Nusa Tenggara, the entire sub-sector in the agricultural sector is a potential sector to achieve these objectives. Based on the results of the multiplier analysis it can be seen that the rice sub-sector has a relatively high value for each value of the multiplier, therefor rice sub-sector is one of the priority sectors which can be used as a reference for the promotion of economic growth in West Nusa Tenggara. The government of West Nusa Tenggara expected to provide a special regulation to keep the potential sectors.
3. For further research should add some more analysis that can actually analyze a role of the agricultural sector to the economy of West Nusa Tenggara.
REFERENCES
Badan Pusat Statistik (BPS). (2014). Tabel Input Output Provinsi Nusa Tenggara Barat Tahu 2013. BPS Provinsi Nusa Tenggara Barat. Nusa Tenggara Barat.
Badan Pusat Statistik (BPS). (2005). Tabel Input-Output Jawa Tengah Tahun 2004. BPS Jawa Tengah. Semarang.
Boediono. (1999). Teori Ekonomi Makro. Edisi Keempat. Yogyakarta: BPFE UGM.
Daryanto, A., & Hafizrianda, Y. (2010). Model-Model Kuantitatif untuk Perencanaan Pembangunan Ekonomi Daerah: Konsep dan Aplikasi. Bogor: PT Penerbit IPB Press.
Deliarnov. (2005). Perkembangan Pemikiran Ekonomi. PT Raja Grafindo Persada. Jakarta.
Dumairy. (1996). Perekonomian Indonesia. Jakarta: Erlangga.
Harsono, I. (2008). Dampak Perubahan Struktur Ekonomi Terhadap Penyerapan Tenaga Kerja di Provinsi Nusa Tenggara Barat (Input-Output Approach). Disertasi (Tidak Dipublikasikan) FE UNIBRAW: Malang.
Jhingan. M. L. (1993). Ekonomi Pembangunan dan Perencanaan. Jakarta: PT Raja Grafindo Persada.
Arsyad, L. (1999). Pengantar Perencanaan dan Pembangunan Ekonomi Daerah. BPFE. Yogyakarta.
Firmansyah. (2006). Operasi Matrix dan Analisis Input-Output (I-O) Untuk Ekonomi–Aplikasi Praktis Dengan Microsoft Excel dan Matlab. LSKE FE UNDIP, Badan Penerbit Universitas Diponegoro, Semarang.
190
Kuncoro, M. (1997). Ekonomi Pembangunan: Teori, Masalah, dan Kebijakan. Edisi Pertama. Yogyakarta: UPP AMP YPKN.
Lembaga Penelitian Unram & Bappeda NTB. (2014). Draft Laporan Akhir: Kajian Nilai Tukar Petani di Provinsi Nusa Tenggara Barat Tahun 2013. Mataram.
Mauludin, D. (2008). Dampak Kebijakan Fiskal Terhadap Pertumbuhan Ekonomi dan Tingkat Kesempatan Kerja (Suatu Kajian Input-Output Atas Pengeluaran Pemerintah Provinsi Jawa Tengah Tahun 2006). Skripsi S1 (Tidak Dipublikasikan) FE UNDIP: Semarang.
Mosher, 1983, Menggerakkan dan Membangun Pertanian, Yasaguna, Jakarta Mubyarto. 1995. Pengantar Ekonomi Pertanian. Jakarta :.LP3ES.
Permana, C. D., & Alla, A. (2010). Analisis Peranan dan Dampak Investasi Infrastruktur Terhadap Perekonomian Indonesia: Analisis Input-Output. Journal of Management & Agribusiness, 7 (1), 48-57.
Suhariyadi, A. (2010). Makalah Sektor Pertanian dalam Peningkatan Pendapatan Nasional. Universitas Pembangunan Nasional.
Sukanto, D. G. T. (2011). Analisis Peranan Sektor Pertanian Terhadap Perekonomian Jawa Tengah (Pendekatan Analisis Input-Output). Retrieved from eprints.udip.ac.id/27364/jurnal.pdf. accesed on march 2015.
Sukirno, S. (2004). Pengantar Teori Makro Ekonomi. Jakarta: Raja Grafindo Persada.
Suryani, T. (2012). Analisis Peranan Sektor Ekonomi Terhadap Pertumbuhan Ekonomi Kabupaten Pemalang (Analisis Tabel Input Output Kabupaten Pemalang Tahun 2010). Retrieved from http://jornal.unnes.ac.id/sju/ index.php/edaj. accesed on march 2015.
Tarigan, R. (2006). Ekonomi Regional Teori dan Aplikasi. Jakarta: Bumi Aksara. Todaro, M. (2006). Pengembangan Ekonomi Dunia Ketiga. Edisi Kedelapan.