See important disclosures at the end of this report Powered by EFATM Platform 1
Lippo Cikarang Tbk PT
(LPCK IJ)
Buy
(Maintained)
Property - Real Estate
Target Price:
IDR14,300
Market Cap: USD407m
Price:
IDR8,000
52-wk Price low/high (IDR) 6,250 - 12,250
Free float (%) 58
Forecasts and Valuations Dec-13 Dec-14 Dec-15F Dec-16F Dec-17F
Total turnover (IDRbn) 1,328 1,792 1,986 2,192 2,411
Reported net profit (IDRbn) 591 844 932 994 1,135
Recurring net profit (IDRbn) 591 844 932 994 1,135
Recurring net profit growth (%) 45.1 42.9 10.4 6.7 14.3
Recurring EPS (IDR) 849 1,213 1,338 1,428 1,631
Recurring P/E (x) 9.43 6.60 5.98 5.60 4.90
P/B (x) 3.06 2.09 1.55 1.21 0.97
Return on average equity (%) 38.8 37.7 29.8 24.3 22.0
Return on average assets (%) 17.7 20.7 19.5 17.3 17.1
Net debt to equity (%) (16.9) (9.2) (3.8) (2.2) (2.4)
Our vs consensus EPS (adjusted) (%) 16.9 25.6 43.5
Source: Company data, RHB
3Q15 results were slightly above our/consensus estimates with net margin rising on gross margin expansion and lower operational cost. Maintain BUY and RNAV-derived IDR14,300 TP (79% upside) as we roll over our valuations to FY16. Revenue is now dominated by residential sales and this is set to continue as the focus has shifted away from industrial projects along the East Jakarta corridor. We have yet to take into account new mixed-use projects in the pipeline.
9M15 results highlights. Lippo Cikarang’s 3Q15 net profit reachedIDR253bn (+25% QoQ, -9% YoY), bringing total 9M15 earnings to IDR730bn, ie slightly above our and consensus’ estimates. Net margin expanded to 48.9% in 3Q15 (2Q15: 46.5%) thanks to better GPM and lower operational costs. Revenue is now dominated by residential sales, which contributed ~53% of total revenue, with GPM expanded to 64% (2Q15: 62%). Meanwhile, 19% of its revenue now comes from industrial developments, with gross margin expanded significantly over the past three years to 79% (3Q11: 34%). Note that industrial sales used to account for 50-70% of total revenue.
Zero debt position. Lippo Cikarang has been able to maintain its zerodebt position since 2H12. Its cash balance, as at 9M15, has grown significantly, by 72% YoY, to IDR441bn (9M14: IDR256bn) due to better cash collection from customers.
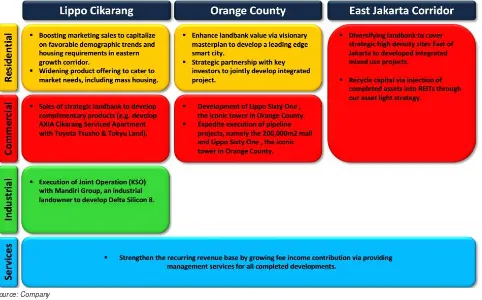
Diversifying landbank. We expect a big chunk of revenue bookingsfrom residential sales to continue, given that Lippo Cikarang has now shifted its focus to developing integrated mixed-use projects to cover the high density sites in the East Jakarta Corridor. In addition to projects in the Lippo Cikarang Township, the company said there were four new mixed-use projects in the pipeline slated for Bekasi Barat, Martadinata, Kalimalang and Jababeka.
Asset-light strategy. Lippo Cikarang is to continue its strategy to keepcapex financing low by partnering with local or foreign players. Note that the company just recently signed a joint-venture (JV) agreement with
See important disclosures at the end of this report 2
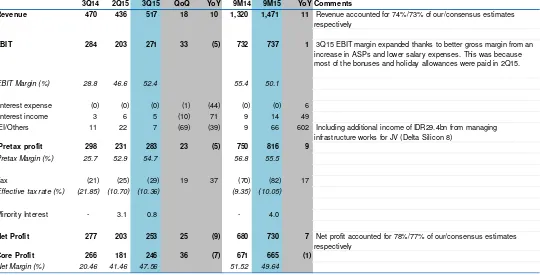
Figure 1: Lippo Cikarang's 9M15 results highlights
3Q14 2Q15 3Q15 QoQ YoY 9M14 9M15 YoY Comments
Revenue 470 436 517 18 10 1,320 1,471 11 Revenue accounted for 74%/73% of our/consensus estimates respectively
EBIT 284 203 271 33 (5) 732 737 1 3Q15 EBIT margin expanded thanks to better gross margin from an increase in ASPs and lower salary expenses. This was because most of the bonuses and holiday allowances were paid in 2Q15.
EBIT Margin (%) 28.8 46.6 52.4 55.4 50.1
Lippo Cikarang’s 9M15 topline and bottomline results come in slightly above our and
consensus’ estimates. 3Q15 net profit reached IDR253bn (+25% QoQ, -9% YoY), which brought total 9M15 earnings to IDR730bn. This was backed by a 10% YoY revenue growth in 3Q15 to IDR517bn, which brought total 9M15 topline to IDR1.47trn.
Gross margin expanded by 330bps to 62%. This was contributed by an increase in ASP for Lippo Cikarang’s overall product lines (industrial and residential). 3Q15 revenue mainly came from booking revenue from residential sales, which contributed about 53% of total revenue with GPM expanded to 64% (2Q15: 62%). Meanwhile 19% of revenue came from industrial developments with gross margins expanded significantly over the past three years to 79% from 3Q11’s 34%. Note that industrial sales used to encompass 50-70% of Lippo Cikarang’s total revenue.
Figure 2: Lippo Cikarang’s revenue breakdown
57% 65% 53% 68% 69%
2Q12 3Q12 4Q12 1Q13 2Q13 3Q13 4Q13 1Q14 2Q14 3Q14 4Q14 1Q15 2Q15 3Q15
Industrial & Commercial Residential houses & Shophouses
Estate management Other
See important disclosures at the end of this report 3
Figure 3: Lippo Cikarang’s gross margins breakdown
60%
2Q12 3Q12 4Q12 1Q13 2Q13 3Q13 4Q13 1Q14 2Q14 3Q14 4Q14 1Q15 2Q15 3Q15
Industrial & Commercial Residential houses & Shophouses
Source: RHB
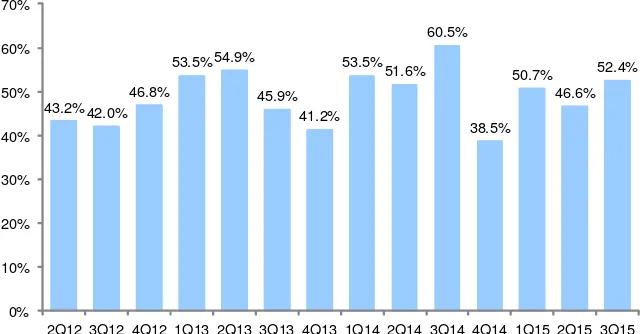
Lippo Cikarang’s operating margins also improved significantly to 52.4% in 3Q15 (2Q15: 46.6%). This was helped by lower opex by 7% QoQ to IDR48bn due to most of its employees’ bonuses and holiday allowances having been paid in 2Q15.
Figure 4: Lippo Cikarang’s blended operating margins
43.2% 42.0%
2Q12 3Q12 4Q12 1Q13 2Q13 3Q13 4Q13 1Q14 2Q14 3Q14 4Q14 1Q15 2Q15 3Q15
Source: RHB, Company data
New JV agreement at Orange County
See important disclosures at the end of this report 4
Four new integrated mixed-use developments in the pipeline
In addition to the Lippo Cikarang Township, the company is to add four new integrated mixed-use developments into its portfolio. The new projects are at Bekasi Barat, Martadinata, Kalimalang and Jababeka. As such, Lippo Cikarang would have a diversified landbank and an intact strategy to cover the demand for residential and commercial needs in high-density areas along the East Jakarta Corridor.
The company has shared two out of the four new mixed-use developments in Cikarang Martadinata and Kalimalang. Each project would comprise not just apartments only but also retail outlets, hospitals, hotels and even banks. These projects are slated to start development in 2-3 years from now. By then, we might expect Lippo Cikarang to gear up its capital from its current zero debt position. Based on the company’s presentation, assuming a net gearing ratio of 40%, it still has room to leverage up to IDR1.4trn.
The other alternative form of financing that Lippo Cikarang might consider is following the model adopted by parent company Lippo Karawaci (LPKR IJ, NEUTRAL, TP: IDR1,460). This would involve applying an asset-light strategy by recycling its capital via the injection of completed assets into REITs.
Figure 5: Lippo Cikarang’s new growth strategies
See important disclosures at the end of this report 5
Figure 6: Location of four new projects
Source: Company
Figure 7: Artists’ impressions of the Martadinata and Kalimalang projects
See important disclosures at the end of this report 6
Valuation
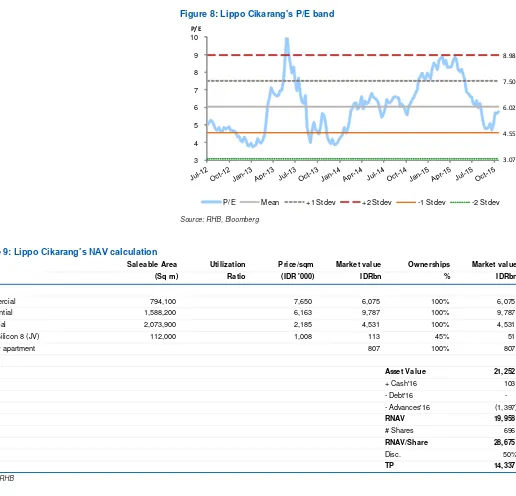
We roll over our valuation to FY16 with our RNAV-based TP unchanged at IDR14,300 (79% upside). We have yet to take into account Lippo Cikarang’s new projects in the pipeline. Nonetheless, the counter is still trading at a huge 72% discount to its RNAV of IDR28,691 per share. Lippo Cikarang is also currently trading at 5.8x rolling P/E, slightly below its average 3-years rolling P/E of 6.02x.
Given the fact that the company: i) is still in a zero debt position, ii) has a ROAE of 24% for FY16F with the potential to grow further from a diversified landbank through four new projects, iii) intends to continue keep to capex low through strategic partnerships or JV, and iv) has the option of recycling its capital through the use of REITs, all these should be potential catalysts for re-rating. Our TP implies P/Es of 10.7x/10x for FY15F/FY16F respectively. Maintain BUY.
Figure 8: Lippo Cikarang's P/E band
8.98
7.50
6.02
4.55
3.07
3 4 5 6 7 8 9 10
P/E
P/E Mean +1 Stdev +2 Stdev -1 Stdev -2 Stdev
Source: RHB, Bloomberg
Figure 9: Lippo Cikarang’s NAV calculation
Assets Saleable Area Utilization Price/sqm Market value Ownerships Market value
(Sq m) Ratio (IDR '000) IDRbn % IDRbn
Commercial 794,100 7,650 6,075 100% 6,075
Residential 1,588,200 6,163 9,787 100% 9,787
Industrial 2,073,900 2,185 4,531 100% 4,531
Delta Silicon 8 (JV) 112,000 1,008 113 45% 51
2 tower apartment 807 100% 807
Asset Value 21,252
+ Cash'16 103
- Debt'16
-- Advances'16 (1,397)
RNAV 19,958
# Shares 696
RNAV/Share 28,675
Disc. 50%
TP 14,337
See important disclosures at the end of this report 7
Financial Exhibits
Profit & Loss (IDRbn) Dec-13 Dec-14 Dec-15F Dec-16F Dec-17F
Total turnover 1,328 1,792 1,986 2,192 2,411
Cost of sales (585) (735) (818) (935) (988)
Gross profit 743 1,057 1,168 1,257 1,424 Other operating costs (109) (143) (149) (164) (181)
Operating profit 634 914 1,019 1,092 1,243 Operating EBITDA 641 925 1,067 1,153 1,304 Depreciation of fixed assets (7) (11) (48) (61) (61)
Operating EBIT 634 914 1,019 1,092 1,243 Net income from investments 5 5 6 7 7
Other recurring income (1) 11 - -
-Interest income 23 12 7 5 7
Interest expense (1) (1) (1) (1) (1)
Exchange gains 6 - - -
-Pre-tax profit 666 942 1,031 1,103 1,256 Taxation (75) (98) (99) (110) (121)
Profit after tax & minorities 591 844 932 994 1,135 Reported net profit 591 844 932 994 1,135 Recurring net profit 591 844 932 994 1,135 Source: Company data, RHB Cash flow (IDRbn) Dec-13 Dec-14 Dec-15F Dec-16F Dec-17F Operating profit 634 914 1,019 1,092 1,243 Depreciation & amortisation 7 11 48 61 61
Change in working capital (385) (631) (655) (840) (1,168) Other operating cash flow (43) (70) (87) (99) (107)
Operating cash flow 213 224 325 215 28
Cash flow from operations 213 224 325 215 28
Capex (201) 59 (770) (248) 6
Other investing cash flow (15) (19) - -
-Cash flow from investing activities (215) 40 (770) (248) 6
Cash at beginning of period 310 308 246 136 103
Total cash generated (2) 264 (445) (33) 35
Implied cash at end of period 308 572 (199) 103 137
See important disclosures at the end of this report 8
Financial Exhibits
Balance Sheet (IDRbn) Dec-13 Dec-14 Dec-15F Dec-16F Dec-17F
Total cash and equivalents 308 246 136 103 137 Inventories 2,510 2,882 3,207 4,010 4,871 Accounts receivable 62 66 73 80 88 Other current assets 385 244 578 578 578
Total current assets 3,265 3,437 3,993 4,771 5,674
Total investments 45 64 64 64 64 Tangible fixed assets 544 809 1,196 1,383 1,316 Total non-current assets 589 872 1,259 1,447 1,380
Total assets 3,854 4,310 5,253 6,218 7,054
Accounts payable - 40 - - -Other current liabilities 2,035 1,598 1,650 1,621 1,322
Total current liabilities 2,035 1,638 1,650 1,621 1,322 Total liabilities 2,035 1,638 1,650 1,621 1,322
Share capital 387 387 387 387 387 Retained earnings reserve 1,432 2,276 3,207 4,201 5,336
Shareholders' equity 1,819 2,663 3,595 4,588 5,724
Minority interests - 8 8 8 8 Other equity - (0) 0 0 0
Total equity 1,819 2,671 3,603 4,597 5,732 Total liabilities & equity 3,854 4,310 5,253 6,218 7,054
Source: Company data, RHB
Key Ratios (IDR) Dec-13 Dec-14 Dec-15F Dec-16F Dec-17F
Revenue growth (%) 31.1 35.0 10.8 10.4 10.0
Operating profit growth (%) 45.1 44.2 11.5 7.2 13.8
Net profit growth (%) 45.1 42.9 10.4 6.7 14.3
EPS growth (%) 45.1 42.9 10.4 6.7 14.3
BVPS growth (%) 48.1 46.4 35.0 27.6 24.7
Operating margin (%) 47.7 51.0 51.3 49.8 51.5
Net profit margin (%) 44.5 47.1 46.9 45.3 47.1
Return on average assets (%) 17.7 20.7 19.5 17.3 17.1
Return on average equity (%) 38.8 37.7 29.8 24.3 22.0
Net debt to equity (%) (16.9) (9.2) (3.8) (2.2) (2.4)
Recurrent cash flow per share 306 321 467 309 40
See important disclosures at the end of this report 9
SWOT Analysis
Strategically located at KM30, east of Jakarta
Better environment, infrastructure and complete public facilities for industrial and residential tenants
Strong management team with >20 years of experience in property development
Coridor Low landbank inventory could restrain cash flow and increase acquisition costs, which will crimp its profit margins
Source: Company data, RHB Source: Company data, RHB
Company Profile
See important disclosures at the end of this report 10
Recommendation Chart
0 2,000 4,000 6,000 8,000 10,000 12,000 14,000
Nov-10 Feb-12 May-13 Aug-14
Price Close
na
8
,7
5
0
1
0
,6
0
0
1
3
,4
0
0
1
4
,3
0
0
Recommendations & Target Price
Buy Neutral Sell Trading Buy
Take Prof it Not Rated
Source: RHB, Bloomberg
Date Recommendation Target Price Price
11 RHB Guide to Investment Ratings
Buy: Share price may exceed 10% over the next 12 months
Trading Buy: Share price may exceed 15% over the next 3 months, however longer-term outlook remains uncertain
Neutral: Share price may fall within the range of +/- 10% over the next 12 months
Take Profit: Target price has been attained. Look to accumulate at lower levels
Sell: Share price may fall by more than 10% over the next 12 months
Not Rated: Stock is not within regular research coverage
Investment Research Disclaimers
RHB has issued this report for information purposes only. This report is intended for circulation amongst RHB and its affiliates’ clients generally or such persons as may be deemed eligible by RHB to receive this report and does not have regard to the specific investment objectives, financial situation and the particular needs of any specific person who may receive this report. This report is not intended, and should not under any circumstances be construed as, an offer or a solicitation of an offer to buy or sell the securities referred to herein or any related financial instruments.
This report may further consist of, whether in whole or in part, summaries, research, compilations, extracts or analysis that has been prepared by RHB’s strategic, joint venture and/or business partners. No representation or warranty (express or implied) is given as to the accuracy or completeness of such information and accordingly investors should make their own informed decisions before relying on the same.
This report is not directed to, or intended for distribution to or use by, any person or entity who is a citizen or resident of or located in any locality, state, country or other jurisdiction where such distribution, publication, availability or use would be contrary to the applicable laws or regulations. By accepting this report, the recipient hereof (i) represents and warrants that it is lawfully able to receive this document under the laws and regulations of the jurisdiction in which it is located or other applicable laws and (ii) acknowledges and agrees to be bound by the limitations contained herein. Any failure to comply with these limitations may constitute a violation of applicable laws.
All the information contained herein is based upon publicly available information and has been obtained from sources that RHB believes to be reliable and correct at the time of issue of this report. However, such sources have not been independently verified by RHB and/or its affiliates and this report does not purport to contain all information that a prospective investor may require. The opinions expressed herein are RHB’s present opinions only and are subject to change without prior notice. RHB is not under any obligation to update or keep current the information and opinions expressed herein or to provide the recipient with access to any additional information. Consequently, RHB does not guarantee, represent or warrant, expressly or impliedly, as to the adequacy, accuracy, reliability, fairness or completeness of the information and opinion contained in this report. Neither RHB (including its officers, directors, associates, connected parties, and/or employees) nor does any of its agents accept any liability for any direct, indirect or consequential losses, loss of profits and/or damages that may arise from the use or reliance of this research report and/or further communications given in relation to this report. Any such responsibility or liability is hereby expressly disclaimed.
Whilst every effort is made to ensure that statement of facts made in this report are accurate, all estimates, projections, forecasts, expressions of opinion and other subjective judgments contained in this report are based on assumptions considered to be reasonable and must not be construed as a representation that the matters referred to therein will occur. Different assumptions by RHB or any other source may yield substantially different results and recommendations contained on one type of research product may differ from recommendations contained in other types of research. The performance of currencies may affect the value of, or income from, the securities or any other financial instruments referenced in this report. Holders of depositary receipts backed by the securities discussed in this report assume currency risk. Past performance is not a guide to future performance. Income from investments may fluctuate. The price or value of the investments to which this report relates, either directly or indirectly, may fall or rise against the interest of investors.
This report does not purport to be comprehensive or to contain all the information that a prospective investor may need in order to make an investment decision. The recipient of this report is making its own independent assessment and decisions regarding any securities or financial instruments referenced
herein. Any investment discussed or recommended in this report may be unsuitable for an investor depending on the investor’s specific investment objectives and financial position. The material in this report is general information intended for recipients who understand the risks of investing in financial instruments. This report does not take into account whether an investment or course of action and any associated risks are suitable for the recipient. Any recommendations contained in this report must therefore not be relied upon as investment advice based on the recipient's personal circumstances. Investors should make their own independent evaluation of the information contained herein, consider their own investment objective, financial situation and particular needs and seek their own financial, business, legal, tax and other advice regarding the appropriateness of investing in any securities or the investment strategies discussed or recommended in this report.
This report may contain forward-looking statements which are often but not always identified by the use of words such as “believe”, “estimate”, “intend”
12
The use of any website to access this report electronically is done at the recipient’s own risk, and it is the recipient’s sole responsibility to take precautions to ensure that it is free from viruses or other items of a destructive nature. This report may also provide the addresses of, or contain hyperlinks to, websites. RHB takes no responsibility for the content contained therein. Such addresses or hyperlinks (including addresses or hyperlinks to RHB own
website material) are provided solely for the recipient’s convenience. The information and the content of the linked site do not in any way form part of this report. Accessing such website or following such link through the report or RHB website shall be at the recipient’s own risk.
This report may contain information obtained from third parties. Third party content providers do not guarantee the accuracy, completeness, timeliness or availability of any information and are not responsible for any errors or omissions (negligent or otherwise), regardless of the cause, or for the results obtained from the use of such content. Third party content providers give no express or implied warranties, including, but not limited to, any warranties of merchantability or fitness for a particular purpose or use. Third party content providers shall not be liable for any direct, indirect, incidental, exemplary, compensatory, punitive, special or consequential damages, costs, expenses, legal fees, or losses (including lost income or profits and opportunity costs) in connection with any use of their content.
The research analysts responsible for the production of this report hereby certifies that the views expressed herein accurately and exclusively reflect his or her personal views and opinions about any and all of the issuers or securities analysed in this report and were prepared independently and autonomously. The research analysts that authored this report are precluded by RHB in all circumstances from trading in the securities or other financial instruments referenced in the report, or from having an interest in the company(ies) that they cover.
RHB and/or its affiliates and/or their directors, officers, associates, connected parties and/or employees, may have, or have had, interests in the securities or qualified holdings, in subject company(ies) mentioned in this report or any securities related thereto and may from time to time add to or dispose of, or may be materially interested in, any such securities. Further, RHB and/or its affiliates may have, or have had, business relationships with the subject company(ies) mentioned in this report and may from time to time seek to provide investment banking or other services to the subject company(ies) referred to in this research report. As a result, investors should be aware that a conflict of interest may exist.
The contents of this report is strictly confidential and may not be copied, reproduced, published, distributed, transmitted or passed, in whole or in part, to any other person without the prior express written consent of RHB and/or its affiliates. This report has been delivered to RHB and its affiliates’ clients for information purposes only and upon the express understanding that such parties will use it only for the purposes set forth above. By electing to view or accepting a copy of this report, the recipients have agreed that they will not print, copy, videotape, record, hyperlink, download, or otherwise attempt to reproduce or re-transmit (in any form including hard copy or electronic distribution format) the contents of this report. RHB and/or its affiliates accepts no liability whatsoever for the actions of third parties in this respect.
The contents of this report are subject to copyright. Please refer to Restrictions on Distribution below for information regarding the distributors of this report. Recipients must not reproduce or disseminate any content or findings of this report without the express permission of RHB and the distributors.
The securities mentioned in this publication may not be eligible for sale in some states or countries or certain categories of investors. The recipient of this
report should have regard to the laws of the recipient’s place of domicile when contemplating transactions in the securities or other financial instruments referred to herein. The securities discussed in this report may not have been registered in such jurisdiction. Without prejudice to the foregoing, the recipient is to note that additional disclaimers, warnings or qualifications may apply based on geographical location of the person or entity receiving this report.
RESTRICTIONS ON DISTRIBUTION
Malaysia
This report is issued and distributed in Malaysia by RHB Research Institute Sdn Bhd. The views and opinions in this report are our own as of the date hereof and is subject to change. If the Financial Services and Markets Act of the United Kingdom or the rules of the Financial Conduct Authority apply to a recipient, our obligations owed to such recipient therein are unaffected. RHB Research Institute Sdn Bhd has no obligation to update its opinion or the information in this report.
Thailand
This report is issued and distributed in the Kingdom of Thailand by RHB OSK Securities (Thailand) PCL, a licensed securities company that is authorised by the Ministry of Finance, regulated by the Securities and Exchange Commission of Thailand and is a member of the Stock Exchange of Thailand. The Thai Institute of Directors Association has disclosed the Corporate Governance Report of Thai Listed Companies made pursuant to the policy of the Securities and Exchange Commission of Thailand. RHB OSK Securities (Thailand) PCL does not endorse, confirm nor certify the result of the Corporate Governance Report of Thai Listed Companies.
Indonesia
13 Singapore
This report is issued and distributed in Singapore by RHB Research Institute Singapore Pte Ltd and it may only be distributed in Singapore to accredited investors, expert investors and institutional investors as defined in the Financial Advisers Regulations and the Securities and Futures Act (Chapter 289), as amended from time to time. By virtue of distribution to these categories of investors, RHB Research Institute Singapore Pte Ltd and its representatives are not required to comply with Section 36 of the Financial Advisers Act (Chapter 110) (Section 36 relates to disclosure of RHB Research Institute Singapore
Pte Ltd ’s interest and/or its representative's interest in securities). Recipients of this report in Singapore may contact RHB Research Institute Singapore Pte Ltd in respect of any matter arising from or in connection with the report.
Hong Kong
This report is issued and distributed in Hong Kong by RHB OSK Securities Hong Kong Limited (興業僑豐證券有限公司) (CE No.: ADU220) (“RHBSHK”)
which is licensed in Hong Kong by the Securities and Futures Commission for Type 1 (dealing in securities) and Type 4 (advising on securities) regulated activities. Any investors wishing to purchase or otherwise deal in the securities covered in this report should contact RHB OSK Securities Hong Kong Limited.
United States
This report was prepared by RHB and is being distributed solely and directly to “major” U.S. institutional investors as defined under, and pursuant to, the requirements of Rule 15a-6 under the U.S. Securities and Exchange Act of 1934, as amended (the “Exchange Act”). RHB is not registered as a broker -dealer in the United States and does not offer brokerage services to U.S. persons. Any order for the purchase or sale of the securities discussed herein
that are listed on Bursa Malaysia Securities Berhad must be placed with and through Auerbach Grayson (“AG”). Any order for the purchase or sale of all other securities discussed herein must be placed with and through such other registered U.S. broker-dealer as appointed by RHB from time to time as required by the Exchange Act Rule 15a-6.
This report is confidential and not intended for distribution to, or use by, persons other than the recipient and its employees, agents and advisors, as applicable.
Additionally, where research is distributed via Electronic Service Provider, the analysts whose names appear in this report are not registered or qualified as research analysts in the United States and are not associated persons of Auerbach Grayson AG or such other registered U.S. broker-dealer as appointed by RHB from time to time and therefore may not be subject to any applicable restrictions under Financial Industry Regulatory Authority
(“FINRA”) rules on communications with a subject company, public appearances and personal trading.
Investing in any non-U.S. securities or related financial instruments discussed in this research report may present certain risks. The securities of non-U.S. issuers may not be registered with, or be subject to the regulations of, the U.S. Securities and Exchange Commission. Information on non-U.S. securities or related financial instruments may be limited. Foreign companies may not be subject to audit and reporting standards and regulatory requirements comparable to those in the United States.
The financial instruments discussed in this report may not be suitable for all investors.
Transactions in foreign markets may be subject to regulations that differ from or offer less protection than those in the United States.
OWNERSHIP AND MATERIAL CONFLICTS OF INTEREST
Malaysia
RHB does not have qualified shareholding (1% or more) in the subject company (ies) covered in this report except for:
a) -
RHB and/or its subsidiaries are not liquidity providers or market makers for the subject company (ies) covered in this report except for:
a) -
RHB and/or its subsidiaries have not participated as a syndicate member in share offerings and/or bond issues in securities covered in this report in the last 12 months except for:
a) -
RHB has not provided investment banking services to the company/companies covered in this report in the last 12 months except for:
a) -
Thailand
14 Indonesia
PT RHB OSK Securities Indonesia is not affiliated with the subject company(ies) covered in this report both directly or indirectly as per the definitions of affiliation above.
Pursuant to the Capital Market Law (Law Number 8 Year 1995) and the supporting regulations thereof, what constitutes as affiliated parties are as follows:
1. Familial relationship due to marriage or blood up to the second degree, both horizontally or vertically;
2. Affiliation between parties to the employees, Directors or Commissioners of the parties concerned;
3. Affiliation between 2 companies whereby one or more member of the Board of Directors or the Commissioners are the same;
4. Affiliation between the Company and the parties, both directly or indirectly, controlling or being controlled by the Company;
5. Affiliation between 2 companies which are controlled, directly or indirectly, by the same party; or
6. Affiliation between the Company and the main Shareholders.
PT RHB OSK Securities Indonesia is not an insider as defined in the Capital Market Law and the information contained in this report is not considered as insider information prohibited by law.
Insider means:
a. a commissioner, director or employee of an Issuer or Public Company;
b. a substantial shareholder of an Issuer or Public Company;
c. an individual, who because of his position or profession, or because of a business relationship with an Issuer or Public Company, has access to inside information; and
d. an individual who within the last six months was a Person defined in letters a, b or c, above.
Singapore
RHB Research Institute Singapore Pte Ltd and/or its subsidiaries and/or associated companies do not make a market in any securities covered in this report, except for:
(a) -
The staff of RHB Research Institute Singapore Pte Ltd and its subsidiaries and/or its associated companies do not serve on any board or trustee positions of any issuer whose securities are covered in this report, except for:
(a) -
RHB Research Institute Singapore Pte Ltd and/or its subsidiaries and/or its associated companies do not have and have not within the last 12 months had any corporate finance advisory relationship with the issuer of the securities covered in this report or any other relationship (including a shareholding of 1% or more in the securities covered in this report) that may create a potential conflict of interest, except for:
(a) -
Hong Kong
RHBSHK or any of its group companies may have financial interests in in relation to an issuer or a new listing applicant (as the case may be) the securities in respect of which are reviewed in the report, and such interests aggregate to an amount equal to or more than (a) 1% of the subject company’s market capitalization (in the case of an issuer as defined under paragraph 16 of the Code of Conduct for Persons Licensed by or Registered with the Securities
and Futures Commission (the “Code of Conduct”); and/or (b) an amount equal to or more than 1% of the subject company’s issued share capital, or issued
units, as applicable (in the case of a new listing applicant as defined in the Code of Conduct). Further, the analysts named in this report or their associates may have financial interests in relation to an issuer or a new listing applicant (as the case may be) in the securities which are reviewed in the report.
RHBSHK or any of its group companies may make a market in the securities covered by this report.
RHBSHK or any of its group companies may have analysts or their associates, individual(s) employed by or associated with RHBSHK or any of its group companies serving as an officer of the company or any of the companies covered by this report.
RHBSHK or any of its group companies may have received compensation or a mandate for investment banking services to the company or any of the companies covered by this report within the past 12 months.
15
Kuala Lumpur Hong Kong Singapore
RHB Research Institute Sdn Bhd
Level 11, Tower One, RHB Centre Jalan Tun Razak
Kuala Lumpur Malaysia Tel : +(60) 3 9280 2185 Fax : +(60) 3 9284 8693
RHB OSK Securities Hong Kong Ltd.
12th Floor
World-Wide House 19 Des Voeux Road Central, Hong Kong Tel : +(852) 2525 1118 Fax : +(852) 2810 0908
RHB Research Institute Singapore Pte Ltd (formerly known as DMG & Partners Research
Pte Ltd)
10 Collyer Quay #09-08 Ocean Financial Centre
Singapore 049315 Tel : +(65) 6533 1818 Fax : +(65) 6532 6211
Jakarta Shanghai Phnom Penh
PT RHB OSK Securities Indonesia
Wisma Mulia, 20th Floor Jl. Jend. Gatot Subroto No. 42
Jakarta 12710, Indonesia Tel : +(6221) 2783 0888 Fax : +(6221) 2783 0777
RHB OSK (China) Investment Advisory Co. Ltd.
Suite 4005, CITIC Square 1168 Nanjing West Road
Shanghai 20041 China Tel : +(8621) 6288 9611 Fax : +(8621) 6288 9633
RHB OSK Indochina Securities Limited
No. 1-3, Street 271 Sangkat Toeuk Thla, Khan Sen Sok
Phnom Penh Cambodia Tel: +(855) 23 969 161 Fax: +(855) 23 969 171
Bangkok
RHB OSK Securities (Thailand) PCL
10th Floor, Sathorn Square Office Tower 98, North Sathorn Road, Silom