SEA-HLM -328
Distribution: General
Guidelines on
Standard O perating Procedures
for Clinical Chemistry
D r A.S. Kanagasabapathy
Professor and Head, Department of Clinical Biochemistry Christian M edical College, Vellore
D r Sudarshan Kumari
Regional Advisor, Blood Safety and Clinical Technology W HO , SEARO
W orld Health O rganization
© W ord Health O rganization 2000
This document is not a formal publication of the W orld Health O rganization (W HO ), and all rights are reserved by the O rganization. The document may, however, by freely reviewed, abstracted, reproduced or translated, in part or in whole, but not for sale or for use in conjunction with commercial purposes.
Contents
Page
Foreword...vii
Acknowledgements... ix
Preface ... xi
SECTION A: GENERAL INTRODUCTION 1. Introduction...1
Q uality manual... 1
Standard operating procedures... 2
Laboratory errors... 3
Preparation of Q C pool... 5
Construction of Levey Jennings chart... 7
External quality assessment... 10
2. Introduction to SOP...12
Specifications... 12
SECTION B: BIOCHEM ICAL M EASUREM ENTS IN PLASM A/SERUM 3. Glucose – Glucose Oxidase M ethod ...15
Introduction ... 15
Principle of the method ... 15
Specimen type, collection and storage ... 15
Reagents ... 16
Equipment, glassware and other accessories ... 17
Procedure ... 17
Calculation and calibration graph... 18
Analytical reliabilities... 18
Hazardous materials ... 19
Reference range and clinical interpretation ... 19
Limitations ... 19
References ... 19
4. Urea – Diacetyl M onoxime M ethod...21
Introduction ... 21
Principle of the method ... 21
Specimen types, collection and storage ... 21
Equipment, glassware and other accessories ... 22
Procedure ... 22
Calculation and calibration graph... 23
Analytical reliabilities... 24
Hazardous materials ... 24
Reference range and clinical interpretation ... 24
Limitations ... 24
References ... 25
5. Creatinine – Jaffe’s M ethod...26
Introduction ... 26
Principle of the method ... 26
Specimen type, collection and storage ... 26
Reagents ... 26
Equipment, glassware and other accessories ... 27
Procedure ... 27
Calculation and calibration graph... 28
Analytical reliabilities... 29
Hazardous materials ... 29
Reference range and clinical interpretation ... 29
Limitations ... 29
References ... 30
6. Cholesterol – Cholesterol Oxidase M ethod...31
Introduction ... 31
Principle of the method ... 31
Specimen type, collection and storage ... 31
Reagents ... 31
Equipment, glassware and other accessories ... 32
Procedure ... 32
Calculation and calibration graph... 32
Anaytical reliabilities ... 33
Hazardous materials ... 33
Reference range and clinical interpretation ... 33
Limitations ... 34
Reference... 34
7. Bilirubin – Jendrassik and Grof Method...35
Introduction ... 35
Principle of the method ... 35
Specimen type, collection and storage ... 35
Reagents ... 35
Equipment, glassware and other accessories ... 36
Procedure ... 36
Calculation and calibration graph... 37
Analytical reliabilities... 39
Hazardous materials ... 40
Reference range and clinical interpretation ... 40
Limitations ... 40
Reference... 40
8. Total Protein – Biuret M ethod...41
Introduction ... 41
Principle of the method ... 41
Specimen type, collection and storage ... 41
Equipment, glassware and other accessories ... 42
Procedure ... 42
Calculation and calibration graph... 43
Analytical reliabilities... 43
Hazardous materials ... 44
Reference range and clinical interpretation ... 44
Limitations ... 44
Reference... 44
9. Albumin - BCG Dye Binding M ethod...45
Introduction ... 45
Principle of the method ... 45
Specimen type, collection and storage ... 45
Reagents ... 45
Equipment, glassware and other accessories ... 46
Procedure ... 46
Calculation and calibration graph... 47
Analytical reliabilities... 48
Hazardous materials ... 48
Reference range and clinical interpretation ... 48
Limitations ... 48
Reference... 48
10. Transaminases - Colorimetric End-point M ethod...49
Introduction ... 49
Principle of the method ... 49
Specimen type, collection and storage ... 49
Reagents ... 49
Equipment, glassware and other accessories ... 50
Procedure ... 50
Calculation and calibration graph... 51
Analytical reliabilities... 53
Hazardous materials ... 53
Reference range and clinical interpretation ... 54
Limitations ... 54
Reference... 54
11. Alkaline Phosphatase - P-nitrophenol M ethod...55
Introduction ... 55
Principle of the method ... 55
Specimen type, collection and storage ... 55
Reagents ... 55
Equipment, glassware and other accessories ... 56
Procedure ... 56
Calculation and calibration graph... 57
Analytical reliabilities... 58
Hazardous materials ... 59
Reference range and clinical interpretation ... 59
Limitations ... 59
Reference... 59
12. Calcium-O-Cresolphthalein Complexone Method...59
Introduction ... 59
Principle of the method ... 59
Specimen type, collection and storage ... 59
Equipment, glassware and other accessories ... 60
Procedure ... 60
Calculation and calibration graph... 61
Analytical reliabilities... 61
Hazardous materials ... 62
Reference range and clinical interpretation ... 62
Limitations ... 62
Reference... 62
13. Phosphorus - Stannous Chloride Reduction M ethod ...63
Introduction ... 63
Principle of the method ... 63
Specimen type, collection and storage ... 63
Reagent... 63
Equipment, glassware and other accessories ... 64
Procedure ... 64
Calculation and calibration graph... 65
Analytical reliabilities... 66
Hazardous reagents ... 66
Reference range and clinical interpretation ... 66
Limitations ... 66
Reference... 67
14. Sodium and Potassium - Flame photometry...69
Introduction ... 69
Principle of the method ... 69
Specimen type, collection and storage ... 70
Reagents ... 70
Equipment, glassware and other accessories ... 71
Procedure ... 71
Calculation ... 71
Analytical reliabilities... 72
Hazardous materials ... 72
Reference range and clinical interpretation ... 73
Limitations ... 73
SECTION C: BIOCHEM ICAL M EASUREM ENTS IN CSF 15. Cerebrospinal Fluid (CSF)...75
Introduction ... 75
16. CSF glucose – Glucose Oxidase M ethod...77
Principle of the method ... 77
Reagents ... 77
Equipment, glassware and other accessories ... 78
Procedure ... 78
Calculation and calibration graph... 79
Analytical reliabilities... 80
Hazardous materials ... 80
Reference range and clinical interpretation ... 80
17. CSF Protein - Pyrogallol Dye Binding Method ...81
Principle of the method ... 81
Reagents ... 81
Equipment, glassware and other accessories ... 82
Procedure ... 82
Calculation and calibration graph... 82
Analytical reliabilities... 83
Hazardous materials ... 84
Reference range and clinical interpretation ... 84
Limitations ... 84
Reference... 84
18. CSF protein – Turbidimetry M ethod...85
Principle of the method ... 85
Reagents ... 85
Equipment, glassware and other accessories ... 86
Procedure ... 86
Calculation and calibration graph... 86
Analytical reliabilities... 87
Hazardous materials ... 88
Reference range and clinical interpretation ... 88
Limitations ... 88
Ketone bodies - Rothera's test ... 92
Urobilinogen – Erhlich’s test ... 93
Bilirubin - (Harison spot test) Fouchet's test... 94
21. Semi-Quantitative Tests...97
Specific Gravity (M ass Density) ... 97
Proteins – Heat and acetic acid method ... 98
Protein – Sulphosalicylic acid method ... 99
Forew ord
There has been a significant increase in the use of clinical laboratories in health services in recent past. Though all disciplines of laboratory sciences are contributing in mitigating the misery and mortality of human beings, clinical chemistry has been in use for the longest period and is accessible even in the peripheral areas of most of the developing countries. This has been possible because most of the tests conducted to assess the biochemical status of the human body are simple, easy to perform, rapid, economical and do not demand a sophisticated infrastructure. H ow ever, in the absence of uniformity in the performance of these tests, the results generated w ould not meet the desired purpose and might have an adverse impact on the diagnosis as w ell as treatment. To obviate this problem, and to ensure quality of results, Standard O perating Procedures (SO Ps) play a vital role. Every laboratory has to develop SO Ps and use them in-house.
Q uality assurance in health laboratories has been one of the important areas for WH O . As a part of technical support to M ember Countries, WH O has undertaken to develop model guidelines for the development of SO Ps in various specialties of health laboratory services. The Guidelines for D evelopment of Standard O perating Procedures in Clinical Chemistry is an effort in this direction. These guidelines are intended for various laboratories that are performing tests for clinical chemistry, to enable them to develop appropriate SO Ps that suit their requirements and are in consonance w ith their mandate as w ell as infrastructure.
I am sure the readers w ill find these useful in strengthening the quality assurance system of their laboratories and thus improving the quality of health care in their setting.
Acknow ledgements
The guidelines have been comprehensively review ed by Professor Ramasamyiyer, Chairman, D epartment of Clinical Pathology, Guy’ s, King’ s College and St Thomas’ M edical and D ental School, St Thomas H ospital, London, and D r B.L. Jailkhani, Professor and H ead, D epartment of Laboratory M edicine, All India Institute of M edical Sciences, N ew D elhi.
Preface
Laboratory investigations pertaining to clinical chemistry have been yielding useful information to clinicians, both in the diagnosis of illness as w ell as the monitoring of treatment. These have been extensively used throughout the w orld. People in the developing countries are also deriving benefit from these simple and economical tests. The utility of these tests has been especially recognized in the management of lifestyle diseases such as diabetes mellitus and other cardiovascular ailments - the incidence of w hich is increasing steadily even in developing nations.
The extensive use of these tests has resulted in the marketing of a variety of test reagents w ith variable technology. The absence of standard operating procedures (SO P) makes it very difficult for many laboratories to generate reliable results. The World H ealth O rganization has been advocating the use of standard operating procedures in all laboratory activities. To achieve this objective, a series of subject-specific guidelines to develop SO Ps suiting the requirements of particular laboratories have been developed.
The Guidelines for Standard O perating Procedures in Clinical Chemistry w ere prepared to strengthen the quality assurance component of clinical chemistry laboratories for the commonly performed tests by conventional technology that is still in use in w ide areas of M ember Countries of the South-East Asia Region.
1. General Introduction
Health care delivery is no longer a simple process of examining the patient and giving him a prescription. O ver the years there has been rapid expansion in the various branches of health care services. As part of this expansion process and explosion of scientific medical knowledge, laboratory diagnosis has gained tremendous importance in today's practice. Through the use of quality control (Q C) the laboratory can ensure that the results being issued by it are reliable enough to allow decisions to be taken with confidence. Q C is the study of those errors which are the responsibility of the laboratory, and of the procedures used to recognize and minimize them. Incorrect laboratory results may lead to wrong management decisions with possible fatal results. The reliability of laboratory results is therefore most important. It is not sufficient to ‘think’ that ‘my’ results are satisfactory. This has to be proved with scientific evidence. Laboratory personnel must know that Q C is an obligation to the patient, that it is designed to give the analyst confidence in the methods used and that its purpose is not to find scapegoats or to punish those making mistakes.
Q uality M anual
Towards achieving quality, international accreditation programmes strongly recommend the production of a quality manual by the laboratory.
The quality manual of a laboratory is a document or a set of documents describing the organizational structure, responsibilities, procedures and processes by which the laboratory achieves its objectives and gains confidence in its work. The manual is indispensable for achieving and maintaining good overall quality. Furthermore, the preparation of a quality manual may induce the laboratory to improve quality. Even a non-mandatory quality manual may be a valuable document for a clinical laboratory in demonstrating to clinicians and the hospital administration a commitment to quality(1).
“ The laboratory shall define and document its policies and objectives for, and its commitment to, good laboratory practice. The hospital management shall ensure that these policies and objectives are documented in the quality manual and communicated to, understood by, and implemented by all laboratory personnel concerned. The quality manual contents are as follows2” :
Contents of quality manual
These are:
â
Q uality Policy and Q uality Systemâ
O rganizationâ
Q uality ControlGuidelines on Standard O perating Procedures for Clinical Chemistry
â
Accommodation and Environmentâ
Equipmentâ
Reference M aterialsâ
Test Proceduresâ
Handling of Reagentsâ
Sample Collection, Storage and Disposalâ
M aintenance of Recordsâ
Laboratory Reports and Despatch of ReportsQ uality policy
The aim of the laboratory is to provide clinically useful information through laboratory measurement of samples from patients, taking into account the allocated resources.
The quality policy is implemented by the following means;(2)
â
Proper sample collection, stabilization, transport, sample preparation and identification.â
Reliable analytical work so that systematic and random errors do not exceed specified limits.â
Turn-around time within specified limits for routine and emergency measurements, and for rare routine measurements.â
Data reported in a clear form and supplemented with relevant information, including reference intervals to allow reliable clinical interpretation.â
Appropriate communication to the clinicians so that the results will be interpreted correctly and logically integrated into further (clinical and laboratory) evaluation of the patients, and that the clinicians become aware of unexpected problems and errors.Standard operating procedures
The preparation of test procedures comes under the broad heading of Standard O perating Procedures (SO Ps). SO P is a clear, concise and comprehensive written instruction of a method or procedure which has been agreed upon and authorized as the operating policy of the department.
In general, SO Ps, which mainly contain detailed descriptions of each analytical method, are essential for maintaining the same analytical quality over a long period of time. The procedures are a prerequisite to correct transfer of methods from one laboratory to another. The contents of SO P are as follows:
(1) Introduction
(2) Principle of method
(3) Specimen types, collection and storage
(4) Reagents, standards and control - preparation and storage
(5) Equipment, glassware and other accessories
Guidelines on Standard O perating Procedures for Clinical Chemistry
(7) Calculations, calibration curve
(8) Analytical reliabilities – (Q C and Statistical assessment)
(9) Hazardous reagents
(10) Reference range and clinical interpretation
(11) Limitations of method (e.g. interfering substances and troubleshooting)
(12) References
(13) Date and signature of authorization
(14) (Effective date + Schedule for review)
Laboratory errors
Analytical errors are classified into random errors and systematic errors. It is clear that random errors indicate poor precision while systematic errors indicate poor accuracy. A few examples of random errors are pipetting error, transcription error, wrong sample numbering and labelling, and fluctuating readings on the colorimeter. Systematic errors could occur due to wrong procedure, incorrect standard and calibration procedure.
Errors can occur in any of the limb of the cycle of events taking place in a hospital, starting from the physician examining the patient and back to the physician (pre-analytical/ (pre-analytical/post-analytical).
The physician, after examining the patient, decides and orders a test, and collects and transports the patient’s samples; this constitutes the pre-analytical limb of the cycle of events. In the analytical limb the sample is received by the laboratory and analysed. The post-analytical limb consists of the transfer of the result to the physician and a meaningful interpretation of the laboratory data by the physician, followed by necessary action.
D efinition:
Accuracy is the degree of agreement betw een a measured value and its ‘ true/consensus’ value. O n the contrary, inaccuracy, w hich is represented by analytical bias, is defined as the % of the difference betw een the measured value and the ‘ true’ value over the true value. Therefore, good accuracy means least analytical error.
Precision refers to reproducibility. It refers to the agreement betw een replicate measurements. It is quantitatively expressed as the standard deviation (SD ) or more precisely as percent coefficient of variation (CV), w hich is defined as SD times 100 divided by the mean value of the results in a set of replicate measurements. Therefore, good precision means least CV.
Pre-analytical
The pre-analytical system shall take care of the following aspects(3),as each can have a major effect on the accuracy of the result:
â
Patient preparationâ
Request formsâ
Specimen collection, containers, labelling and phlebotomy equipment and procedureGuidelines on Standard O perating Procedures for Clinical Chemistry
â
Specimen preparationâ
Specimen storageAnalytical
The following aspects(3)shall be monitored, evaluated, implemented and maintained to ensure the accuracy and precision of the test carried out:
â
Q uality of distilled waterâ
Calibration of measuring and testing instruments including balances, thermometers, incubators, waterbaths, autoclaves, centrifuges and semi-automatic pipettes, and regular servicing and maintenance of equipment.It is essential to use a standard calibrator which is traceable to national/international reference material. The laboratory shall obtain evidence of traceability to the reference material from the supplier. Precision can be maintained through the use of suitable Q C material, either commercial or prepared in-house. The Q C material should be analysed at predetermined intervals along with patient samples to monitor systematic and random errors. Such Q C material shall also be traceable to a national/international certified reference material so that the accuracy of measurements can be monitored.
All data relating to the laboratory’s internal Q C practices and performance in external quality assessment schemes (scoring, ranks, etc.) shall be recorded, reviewed and corrective actions implemented.
Stability of reagents
Laboratory personnel should be aware that the stability of all reagents kept at room temperature will go down from the stated values if the temperature exceeds 350
C.
Use of calibration graphs
A fresh standard curve should be carried out for the analyses described in this manual whenever:
â
the calibrator is changedâ
new reagents are introducedâ
problems with Q C are encounteredPost-analytical
In order to avoid transcriptional errors in the results of the test, the reporting/signatory technicians shall verify the results entered manually or through on-line instrument interfaces before the results are reported or despatched.
Rectification of laboratory errors
It is therefore essential to continually ask the following questions.
(1) Is there an analytical error? (2) If so, what type of error is this?
Guidelines on Standard O perating Procedures for Clinical Chemistry
It is important to identify analytical errors and classify them as either random or systematic errors. Towards this end, the laboratory should implement internal Q C procedures. This involves preparation of a Q C pool, either human or bovine, quantification of unavoidable laboratory errors, construction of Levey-Jennings chart and daily analysis of Q C along with every batch of patients’ samples.
Preparation of Q C pool
Ethanediol stabilized liquid serum Q C pool has been established in the authors’ laboratory (4) based on the W HO method (5). This procedure is applicable to both pooled human serum as well as bovine serum. This preparation is economical and appropriate for use in the laboratories in developing countries.
U se of patients’
sera
A serum pool can be prepared by salvaging the extra serum from leftover patients’ samples after analysis. Samples that are significantly haemolysed or lipemic or icteric should be excluded. Similarly, samples that show positive tests for HIV antibodies and Hbs antigen should also be excluded. In view of the dangers in handling infectious blood samples, use of animal-based Q C pool is recommended.
U se of bovine serum
Collect about 2-3 litres of fresh bovine blood in a 5-litre clean plastic bucket. Allow to clot at room temperature for about 30 minutes.
Slice the clot into small pieces using a sharp knife and leave the bucket at 2-80
C for 12 hours to enable the serum to ooze out. Decant the crude serum into a one litre beaker or flask.
Transfer this crude serum into several glass centrifuge tubes (size 15 x 120 mm) and then centrifuge for 10 minutes at 3500 rpm and decant the clear serum into a clean bottle.
Transfer one litre serum into a one-litre plastic bottle.
M ix the contents well and store the container at –200
C for 12 hours or until frozen.
W hile monitoring day-to-day laboratory performance with internal Q C, it is preferable to use different levels of Q C materials to cover the entire pathological ranges. Therefore, methods of preparation of three levels of Q C (low, normal and high) are described below.
If the preparation of all three levels of Q C pool is not possible, it is essential to make use of at least one level, viz. normal level.
The procedures described below for the preparation of all three Q C levels are applicable to both human serum and bovine serum.
(a) Preparation of normal-level Q C serum
Guidelines on Standard O perating Procedures for Clinical Chemistry
various analytes. Use 20 ml distilled water to dissolve the various substances that will be added to the serum in order to increase the levels of these to the desired normal levels. Total volume = 830+ 150+ 20 = 1000 ml
The Q C serum thus prepared will contain 15% (V/V) ethanediol.
(b) Preparation of high-level Q C serum
Freeze one litre of clear serum at -200
C. Remove the container from the freezer and fix it upside down over a one-litre plastic measuring cylinder. Collect the first 700ml, which will be more concentrated and rich in all constituents. Add 127.5 ml of ethanediol to this and mix well. Take an aliquot and measure the levels of various analytes. Use 22.5 ml distilled water to dissolve the various substances that will be added to the serum in order to increase their levels to the desired levels. Total volume = 700 + 127.5+ 22.5 = 850 ml.
The Q C serum thus prepared will contain 15% (V/V) ethanediol.
(c) Preparation of low-level Q C serum
Start with 500ml of clear serum. M easure potassium level. Calculate the final volume, to which 500 mg of this serum must be diluted to adjust the potassium level to 3.5 mmol/L.
Initial volume 500 ml
Final volume (x) ml
In actual practice, although potassium concentration will be diluted to 3.5 mmol/L, the levels of some other constituents will become too low. Therefore the levels of these need to be raised to some extent so that these will be maintained at low level but not too low. O ut of the 265 ml distilled water, 25 ml may be used for dissolving desired quantities of such of those constituents that need to be added to the serum to raise their amount to the desired low levels.
Adjustment of analytes
Glucose, urea, creatinine, sodium (NaCl) and potassium (KCl): -
Dissolve each of these in 5 ml distilled water and add to the main bulk of serum.
Guidelines on Standard O perating Procedures for Clinical Chemistry
After adding all the analytes mix the contents well and centrifuge the serum once again for 10 minutes at 3500 rpm. Collect the supernatant serum in a sterile one-litre flask. M ix the contents well and dispense the serum into 5 ml sterile penicillin vials, seal the vials and store at –200
C. Laboratories can decide on the volume of aliquots depending on their requirements.
Construction of Levey Jennings Chart
O n each day when analyses are performed a fresh sample is thawed, thoroughly mixed and analysed. (Remember: Ethanediol-treated serum may not freeze completely at – 200
C; however, the constituents are quite stable). The Q C serum is analysed for a period of 20 days or so. [Important to note: Analysis should not be carried out by only one person; all staff should participate in this exercise to determine the true unavoidable error in the laboratory]. From these data, mean and SD are calculated. Levey Jennings chart is then constructed with x + 2SD as warning limits and x + 3 SD as control limits.
Calculate the %CV for each analyte to ascertain whether this is within the acceptable limit (Ideal = < 5%. Must be definitely < 8%). If % CV is found to be high, this will indicate that between-day laboratory precision (variation) is high and the data cannot be used to construct a Levey Jennings chart. It is then essential to identify the causes for this, correct these and then repeat the whole exercise and confirm that the %CV is well within the acceptable limit.
Table 1 shows precision data obtained by a W HO trainee from a developing country for routine biochemical analytes through analysis of ethanediol-treated Q C serum for 20 days, while undergoing training at the author’s laboratory recently.
Table 1
Analyte Autoanlyser H itachi 912 M anual M ethod
M ean %CV M ean %CV
Interpretation of Q C data
A. According to W HO(6)an analytical system is ‘out of control’ if one of the four criteria is met. That is:
− a value lies entirely outside the control limits − seven consecutive values show a rising tendency − seven consecutive values show a falling tendency
Guidelines on Standard O perating Procedures for Clinical Chemistry
If one of these situations arises, the patients’ results must be discarded, the cause of the error sought and removed, and then the batch repeated with a Q C serum.
B. Use of two different levels of Q C simultaneously in every batch of analysis provided valuable information on the type of errors – whether these are random (precision) errors or systematic (accuracy) errors.
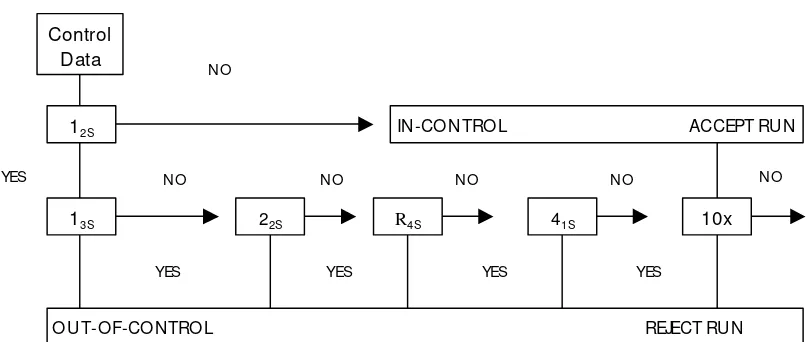
W estgard’s rules for interpreting Q C data obtained using a single-level QC as well as two different-level Q Cs are schematically presented in Fig.1.(7)
Figure 1.Q uality Control Rule D iagram
Warning Rule
1
2S O ne observation > x + 2 SD
Rejection Rules (used if warning rule is exceeded; run rejected if any of the following rules are violated) R= Random error; S = Systematic error
R13S O ne observation > x + 3 SD
S22S Two observations > same limit, that is x + 2 SD or x - 2SD (same control- two consecutive runs, or two different controls – same run)
RR4S Difference between two observations within run > 4SD (two different controls – one > x + 2SD and the other > x – 2SD)
S41S Four consecutive observations> same limit, that is x + 1SD or x - 1SD (same control four consecutive runs )
S10
X Ten consecutive observations on same side of mean (same control, ten consecutive runs, or two different controls, five consecutive runs)
Remedial action
A well-run internal Q C system makes possible immediate intervention in the release of patients’ results. In the event of a control system alert, it is advisable to proceed through
Guidelines on Standard O perating Procedures for Clinical Chemistry
(a) Decision: Immediate decision whether action is necessary.
(b) Investigation: Check to locate the error. (c) Repair: Action to eliminate the error.
If the decision is taken that the method is out of control, the first action is to withhold patients’ results in that batch. Then the analyst should start by checking for the simplest and most frequent faults, and then continue as necessary in a logical order depending on the method and equipment involved.
It is good practice to start by excluding gross errors such as mix-up of control materials, reagents or pipettes, misuse of measuring instruments [wrong filter or aged lamp in the photometer], or failure to follow instructions for a step in the method.
The results obtained on a control specimen may be in error for several reasons, including deterioration due to age, incorrect storage or contamination, wrong identification and mistake in preparation or constitution.
Further action will depend on whether the alert is due to a change in accuracy or in precision. If accuracy has deteriorated, attention should be focused on the possibility of systematic sources of error such as incorrect reaction temperature, calibration errors and faulty devices. If precision has deteriorated, steps in the analytical procedure should be checked, for instance, deproteinization, composition of reagents and reaction mixtures, measuring systems [photometer, flame photometer, etc].
Guidelines on Standard O perating Procedures for Clinical Chemistry
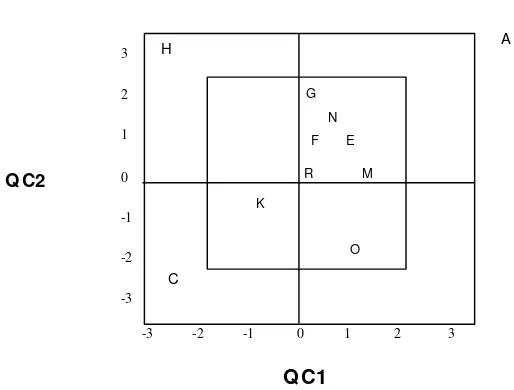
(b) Plot A values for both Q C are > + 2SD Plot C values for both Q C are > - 2SD
These data indicate 22S error, i.e. systematic error
(c) Plot H Values for Q C1 ( x axis) is > - 2SD
while value for Q C2 (y axis) is > + 2SD
This indicates R4s error i.e. random error
Prevention of systematic errors
To prevent or minimize systematic errors, the laboratory should adhere to the following points:
(1) Use of proper calibration technique. Use of pure chemicals, precision balance, quality distilled water. Proper preservative and storage
(2) Regular checking of photometric filter, bulb, tubing, etc.
(3) Use of recommended analytical methods
(4) Calibration of pipettes at regular intervals
(5) Instrument calibration – photometric check
(6) Use of calibrated cuvette
(7) Regular preventive maintenance of equipment – daily, weekly and monthly.
W hile it is easy to identify systematic errors, it is quite difficult to pinpoint random errors. In order to minimize this possibility, it is important to educate the staff on various aspects that could lead to random errors.
External quality assessment
Participation in External Q uality Assessment Schemes is important for interlaboratory comparison and the maintenance of long-term accuracy and precision of the analytical systems in the laboratory. This gives the laboratory an opportunity to have an appraisal of the methods employed and switch over to better methods.
References
(1) Nordtest Technical Report from the technical group for quality assurance – Report # 187 (1992).
(2) NABL (National Accreditation Board for Testing and Calibration Laboratories, India) criteria for laboratory accreditation – NABL # 101 – 2nd Edition (1994).
(3) NABL Specific guidelines for accreditation of clinical laboratories and checklist for assessors (1998).
(4) Kanagasabapathy AS, Swaminathan S. and Selvakumar R. Q uality Control in Clinical Biochemistry Indian Journal of Clinical Biochemistry (1996); 11: 17-25.
(5) Browning DM , Hill PG and O lazabal DAV. Preparation of Stabilized liquid quality control serum to be used in clinical chemistry –W HO document LAB/86.4
Guidelines on Standard O perating Procedures for Clinical Chemistry
2. Introduction to SO P
(1) The methods described in this manual have been developed in the author’s laboratory taking into account the facilities available in the intermediate laboratories in developing countries, the technical level of laboratory personnel and the availability of chemicals/reagent kits at affordable cost. The validity of these methods with reference to accuracy, precision, linearity, etc. has been well established. These methods have been tried and tested and are being employed in a large number of laboratories in India.
(2) Numerous kits are available today manufactured by several commercial firms, which contain all the reagents needed for various biochemical tests. Details are given in the kit leaflet as to the preparation and storage of reagents. It is important to follow the manufacturer’s instructions carefully. W ith the ready availability of the kits, very few laboratories are preparing their own reagents from the basic chemicals. Even those laboratories using in-house reagents have the choice of preparing the standard in their laboratories or buy from commercial companies. It is very important to remember that whatever is the source, the standard should be properly prepared. Use of improperly prepared standard will drastically affect the quality of patients’ results.
(3) (a) Generally the intermediate laboratories are equipped with either a filter photometer or spectrophotometer to carry out the analysis as a manual method. However, some laboratories employ semiautomatic methods for which automated photometric systems are used.
(b) Two types of such systems are available for use in the laboratory. A comparison of the specifications of these two types is given in the following Table.
Comparision of Semiautomated Systems
Guidelines on Standard O perating Procedures for Clinical Chemistry
Type of chemistries done Absorbance, end point, two point, kinetic.
Absorbance, end point, two point, kinetic.
M odularity Yes, the instrument has separate photometer, suction device and incubating waterbath.
No, integrated. All the hardware is integrated into one compact unit to save space.
Temperature maintenance By circulating waterbath Peltier element
Cuvette volume required for measurement
500µl Ranging from 20-80µl
facilitating the use of small volumes
Total reaction volume 1000µl Ranging from 175µl to 500µl.
Cuvette material Q uartz Q uartz.
No of wavelength (nm) 340, 405, 546, 578, 623 340, 405, 505, 546, 570, 623, 700
W avelength positioning M anual rotation. Choice depends on the chemistry.
(c) General (common) laboratory glassware like pipette, beaker, volumetric flask, measuring cylinder and test tube are essential for carrying out the assays.
(d) Semiautomatic (push button) pipettes are now employed in several laboratories. If a laboratory employs such pipettes, regular maintenance must be carried out as per instructions provided by the manufacturer. Calibration of pipettes should also be checked at definite intervals.
(4) The following Table shows a set of sample data related to calibration of three different pipettes with volumes 50, 100 & 200 µl. The calibration procedure consists of weighing water delivered through these pipettes into a preweighed beaker for at least 10 times. From the data obtained, mean, SD, %CV and % error have been calculated. %CV expresses the precision and % error expresses accuracy. These data are well within the acceptable limit, i.e. 5%.
Guidelines on Standard O perating Procedures for Clinical Chemistry
(5) Protection of laboratory personnel from infectious diseases transmitted by blood, body fluids and tissue
A biohazardous condition is a situation involving infectious agents, biological in nature such as hepatitis B virus, human immunodeficiency virus (HIV), or the tuberculosis bacterium. These infectious agents are present in human blood and blood products and in other body fluids.
The major sources of contamination when handling potentially infectious agents are:-
â
Hand-to-mouth contactâ
Hand-to-eye contactâ
Direct contact with superficial cuts, open wounds, and other skin conditions that permit absorption into subcutaneous skin layerâ
Splashes or aerosol contact with skin and eyes.Specimens from patients known to have these infectious diseases (Biohazard specimens) should be handled using special precautions. However, since it is not possible to identify all carriers it is also sensible to introduce a system of universal precautions whereby high-risk procedures are identified as well as high-risk specimens. If laboratory staff use the recommended precautions this should increase their protection.
Strictly adhere to the following procedures: -
â
W ear gloves when in contact with body fluids, such as serum, plasma, urine or whole bloodâ
W ash your hands when gloves are removed or changedâ
Perform procedures carefully to minimize aerosol formationâ
W ear protective clothing such as laboratory coats or aprons when working with specimensâ
Keep your hands away from your faceâ
Cover all superficial cuts before starting any workâ
Dispose of specimens and other contaminated materials according to your laboratory’s biohazard control procedureGuidelines on Standard O perating Procedures for Clinical Chemistry
â
Do not eat or drink or apply cosmetics while in the laboratory3. Glucose – Glucose O xidase M ethod
Introduction
Glucose is a reducing monosaccharide that serves as the principal fuel of all the tissues. It enters the cell through the influence of insulin and undergoes a series of chemical reactions to produce energy.
Lack of insulin or resistance to its action at the cellular level causes diabetes. Therefore, in diabetes mellitus the blood glucose levels are very high. Some patients with very high blood glucose levels may develop metabolic acidosis and ketosis caused by the increased fat metabolism, the alternate source for energy. Hyperglycaemia is also noted in gestational diabetes of pregnancy and may be found in pancreatic disease, pituitary and adrenal disorders.
A decreased level of blood glucose, hypoglycaemia is often associated with starvation, hyper insulinaemia and in those who are taking high insulin dose for therapy.
Principle of the method
Glucose present in the plasma is oxidized by the enzyme glucose oxidase (GO D) to gluconic acid with the liberation of hydrogen peroxide, which is converted to water and oxygen by the enzyme peroxidase (PO D).
4 aminophenazone, an oxygen acceptor, takes up the oxygen and together with phenol forms a pink coloured chromogen which can be measured at 515mm.
Specimen type, collection and storage
Plasma is the specimen of choice for glucose estimation. Plasma glucose levels have been checked to be quite stable for 6 hours at room temperature (25 -350C) in the author’s
laboratory. It is important that plasma should be separated from the cells soon after collection, preferably within 1 hour.
Glucose
GO D
Gluconic acid + H2O2
H2O2
PO D
H2O + [0]
Guidelines on Standard O perating Procedures for Clinical Chemistry
About 2 ml of the patient’s blood should be collected by venipuncture into a tube containing a mixture of potassium ethylene diaminetetraacetate (EDTA) sodium fluoride at a ratio 1:2 (W /W ). Five mg of the mixture is adequate for 2 ml of blood. The tube should be gently but thoroughly shaken for complete mixing.
Preparation of the anitcoagulant mixture: 100 g of potassium EDTA and 200 g of sodium fluoride should be mixed and ground into a fine powder using a blender. This should preferably be done in a fume cupboard. The mixture should be stored in a clean container.
A thin, long spatula that can scoop 5 mg when levelled, can be used for delivering the mixture into the tube.
Reagents
All chemicals must be Analar grade
(a) Phosphate Buffer : 100 mmol/L. pH 7.0
To 800 ml of distilled water add the following in the order:
Disodium hydrogen phosphate dihydrate [Na2HPO 4 2H2O ] 12.95 g Anhydrous potassium dihydrogen phosphate [KH2PO 4] 4.95 g
Sodium azide [NaN3] 0.5 g
Add one by one, dissolve and finally make up to 1 litre with distilled water. Stable for 3-4 months, at 2-80
C. Check that the final pH is 7.0 + 0.05 with a pH meter.
(b) Colour Reagent
To 100ml of the above phosphate buffer add the following in the order and then mix to dissolve:
Reconstitute the purchased GO D & PO D powder with phosphate buffer. Dispense separately into vials so that each vial represents the requisite number of units. Store the vials frozen. Stable for 2 weeks at 2-80C. Store in a brown bottle.
(c) Benzoic acid 1g/l.
Dissolve 1.0g of benzoic acid in water and make up to 1 litre with water. This solution is stable indefinitely at room temperature.
(d) Stock glucose solution, 1 g/l.
Before weighing, dry the glucose at 60-800
C for 4 hours. Allow to cool in a dessicator. Dissolve 1g of glucose in benzoic acid solution and make up to 100 ml in a volumetric flask. Stable for six months at room temperature (25-350
C).
Guidelines on Standard O perating Procedures for Clinical Chemistry
(e) W orking glucose standard 100 mg/dl.
Dilute 10 ml of stock glucose (use either a volumetric pipette or a burette) to 100 ml with benzoic acid in a 100 ml volumetric flask. M ix well. Stable for 6 months at room temperature (25-350
C).
Equipment, glassware and other accessories
Refer to Section A (2), Introduction to SO P
Procedure
The protocol of the procedure is described below.
(a) D ilution of standards (S1-S5), Test & Q C
Pipette the following into appropriately labelled 13 x 100 mm tubes
S1 S2 S3 S4 S5 Test Q C
Pipette the following into another set of appropriately labelled tubes.
Blank S1 S2 S3 S4 S5 Test Q C
M ix all tubes well. Incubate at 370
C in a waterbath for 15 minutes.
Remove from waterbath and cool to room temperature. Set the spectrophotometer/ filter photometer to zero using blank at 510 nm/ green filter and measure the absorbance of Standards, Test and Q C.
Guidelines on Standard O perating Procedures for Clinical Chemistry
Calculation and calibration graph
Since the protocol for standard tube S1 and test is identical, the standard S1 will represent a concentration of 100 mg/dl. The glucose concentrations represented by other standard tubes are S2 = 200; S3 = 300; S4 = 400 & S5 = 500 (mg/dl).
Plot the absorbance values of standards against their respective concentrations. The measurable range with this graph is from 10 to 500 mg/dl.
Plot absorbance values of Test/Q C on the calibration graph and read off the concentrations.
O nce linearity is proved, it is not necessary to prepare the standard graph every time that patients’ samples are analysed. It will be adequate if standard S2 is taken every time and patients’ results are calculated using the formula :
Test absorbance
--- x 200 mg/dl Standard absorbance
Analytical reliabilities
Refer to pages 7-9 of section 1 (General Introduction) on the use of internal Q C and interpretation of daily Q C data (for releasing patients’ results).
Since glucose is the most common analyte measured in a laboratory, it is advisable to include an internal Q C (normal Q C pool) with every batch of samples analysed in the day, irrespective of the number of samples in a batch. Further, even when a single sample is analysed as an “ emergency” sample at any time of the day or night, it is essential to include an internal Q C. From the Q C results obtained for the day, mean,
Guidelines on Standard O perating Procedures for Clinical Chemistry
standard deviation and %CV can be calculated to ensure that within-day precision is well within the acceptable limit, i.e, 5%.
The mean value of internal Q C for the day can be pooled with the preceding 10 or 20 mean values obtained in the previous days, and between–day precision can be calculated and expressed as % CV. Ensure that this is well within the acceptable limit, i.e, 8%.
At least once a day analyse another Q C serum from either a low Q C or high Q C pool.
“ Assayed” Q C sera with stated values (ranges) are available from several commercial sources, viz. Boehringer M annheim, BioRad & Randox.
If a laboratory uses Q C sera from a commercial source, it is important that the company certifies that their Q C materials are traceable to international reference materials.
H azardous materials
This procedure uses sodium azide and phenol, which are poisonous and caustic. D o not swallow, and avoid contact with skin and mucous membranes
Reference range and clinical interpretation
Plasma glucose: Fasting: 70 –110 mg/dl Post-prandial: 80 – 140 mg/dl Random: 60 – 140 mg/dl
Elevated plasma glucose levels are expected in a variety of clinical conditions, especially diabetes mellitus, Cushing’s syndrome and hyperadrenalism. Decreased plasma glucose levels are observed in hyper-insulinism, anti-diabetic treatment and hypoadrenalism.
Limitations
Any sample that gives aglucose value > 500 mg/dl should be diluted 1:2 with 0.9g% sodium chloride solution and the correct value obtained by multiplying the result by 3.
At high plasma levels, uric acid, glutathione and bilirubin may interfere with the assay by causing a decrease in glucose values. Ascorbic acid will decrease glucose values by retarding colour development. Do not report results from specimens with suspected interference. Inform the requesting physician of the problem.
References
(1) Trinder, P. (1969). Annals of Clin. Biochem. 6: 24 – 27.
4. Urea – D iacetyl monoxime method
Introduction
Urea contributes most of the body’s non-protein nitrogen, accounting for about 45% of the total. It is the major end-product of protein catabolism in humans. It is synthesized in the liver, released into blood circulation and excreted by the kidneys. M easurement of urea in blood is a useful indicator of renal and hepatic integrity.
Principle of the method
Urea reacts directly with diacetyl monoxime under strong acidic conditions to give a yellow condensation product. The reaction is intensified by the presence of ferric ions and thiosemicarbazide. The intense red colour formed is measured at 540nm/ yellow green filter.
Specimen types, collection and storage
Serum is the specimen of choice. Store samples for no longer than 8 hours at room temperature (25-350
C) and 7 days at 2-80
C. For a longer duration, store in the freezer. If the samples show evidence of bacterial contamination, do not use these for urea estimation. Plasma could also be used for urea estimation.
Reagents
All chemicals must be Analar grade
.
(a) Stock acid reagent
Dissolve 1.0g of ferric chloride hexahydrate in 30 ml of distilled water. Add 20 ml orthophosphoric acid and mix. Store in a brown bottle at room temperature (25-350
C).Stable for 6 months.
(b) M ixed acid reagent
Add slowly 100 ml of Conc. H2S04 to 400 ml distilled water taken in a 1-litre flat-bottom conical flask kept in an icecold waterbath. M ix well and add 0.3ml of stock acid reagent. M ix and store in a brown bottle at room temperature (25-350
C). Stable for 6 months.
Guidelines on Standard O perating Procedures for M icrobiology
Dissolve 2g diacetyl monoxime in distilled water and make the volume up to 100 ml in a volumetric flask. Store in a brown bottle at room temperature (25-350
C). Stable for 6 months.
(d) Stock colour reagent - B
Dissolve 0.5 g thiosemicarbazide in distilled water and make up to 100 ml in a volumetric flask. Store in a brown bottle at room temperature (25- 350C). Stable for 6
months.
(e) M ixed colour reagent
M ix 35 ml of stock colour reagent A with 35 ml of stock colour reagent B and make up to 500 ml with distilled water. Store in a brown bottle at room temperature (25- 350C).
Stable for 6 months.
(f) Stock urea standard
W eigh 1.0g of analytical-grade urea and dissolve in 100ml of benzoic acid (1g/dl). Use a 100ml of volumetric flask for preparing this. Store at room temperature (25- 350
C). Stable for 6 months.
(g) W orking standard 50mg/dl
Dilute 5.0ml of stock urea standard to 100 ml with benzoic acid. Store at room temperature (25- 350
C). Stable for 6 months.
Equipment, glassware and other accessories
Refer to Section A (2), Introduction to SO P
Procedure
The protocol of the procedure is described below.
(a) D ilution of Standards (S1-S3), Test & Q C
Pipette the following into appropriately labelled 13 x 100 mm tubes
S1 S2 S3 Test Q C
Distilled W ater (ml) 1.9 1.8 1.7 1.9 1.9
50 mg/dl Urea (ml) 0.1 0.2 0.3 - -
Test sample /Q C (ml) - - - 0.1 0.1
M ix Well
(b) Colour D evelopment
The colour reagent is prepared fresh at the time of analysis by mixing distilled water, mixed acid reagent and mixed colour reagent in the ratio 1:1:1.
Guidelines on Standard O perating Procedures for M icrobiology
Blank S1 S2 S3 Test Q C
Colour reagent (ml) 3.1 3.0 3.0 3.0 3.0 3.0
Respective diluted standard
ml) - 0.1 0.1 0.1 -
-Diluted test /Q C (ml) - - - - 0.1 0.1
M ix all tubes well. Keep them in a boiling waterbath for 15 minutes. Remove from waterbath and cool the tubes for 5 minutes. Set the spectrophometer/filter photometer to zero with blank at 540nm/yellow green filter and measure the absorbance of the other tubes.
Calculation and calibration graph
Concentration of standards:
S1 = 50 mg/dl S2 = 100 mg/dl S3 = 150 mg/dl
Plot the absorbance values of standards against their respective concentrations. The measurable range with this graph is from 10 to 150 mg/dl. A calibration graph should be constructed whenever a new set of reagents is prepared. Plot absorbance values of test/Q C on the calibration graph and read off the concentrations.
O nce linearity is proved, it will be enough if S3 is set up every time that patients’ samples are analysed and the results calculated using the formula:
Absorbance of test
Urea in test sample = --- x 150 mg/dl Absorbance of Standard
0 0.1 0.2 0.3 0.4 0.5
0 50 100 150
Guidelines on Standard O perating Procedures for M icrobiology
Analytical reliabilities
Refer to pages 7-9 of section 1 (General Introduction) for the use of internal Q C and interpretation of daily Q C data (for releasing patients’ results).
Since urea is one of the most common analytes measured in a laboratory after glucose, it is recommended that an internal Q C (normal Q C pool) be included with every batch of samples analysed in the day, irrespective of the number of samples in a batch. Further, even when a single sample is analysed as an “ emergency” sample at any time of the day or night, it is essential to include an internal Q C. From the Q C results obtained for the day, mean, standard deviation and %CV can be calculated to ensure that within-day precision is well within the acceptable limit, i.e. 4%.
The mean value of internal Q C for the day can be pooled with the preceding 10 or 20 mean values obtained in the previous days and between–day precision can be calculated and expressed as % CV. Ensure that this is well within the acceptable limit, i.e. 8%.
At least once a day analyse another Q C serum from either a low Q C or high Q C pool.
“ Assayed” Q C sera with stated values (ranges) are available from several commercial sources, viz. Boehringer M annheim, BioRad & Randox.
If a laboratory uses Q C sera from a commercial source, it is important that the company certifies that their Q C materials are traceable to international reference materials.
H azardous materials
M ost of the chemicals used in this method are acids. Care should therefore be taken to avoid mouth pipetting and contact with skin.
Reference range and clinical interpretation
Serum/ Plasma Urea ……..15 – 40 mg/dl
Elevated serum urea levels may be due to pre-renal, renal or post-renal etiology. Pre-renal causes could be cardiac related or due to increased protein catabolism, and dehydration. Renal causes include glomerulonephritis, chronic nephritis, nephrotic syndrome and other kidney disease. Post-renal causes include obstruction of the urinary tract.
Decreased serum urea levels could be due to pregnancy, intravenous infusion, low antidiuretic hormone secretion, low protein intake, severe liver diseases, inborn errors of urea cycle and SIADH (Syndrome of inappropriate ADH secretion).
Guidelines on Standard O perating Procedures for M icrobiology
Specimens with gross icterus cannot be assayed as it will cause falsely elevated urea values. Do not report results from specimen with suspected interference. Inform the requesting physician of the problem.
References
(1) W ybenga, D.R., Di Glorgio, J.& Pileggi, V.J. (1971). Clinical Chem., 17, 891-895.
5. Creatinine – Jaffe’s method
Introduction
Creatinine is a waste product formed in muscle from a high-energy storage compound, creatine phosphate. Creatine phosphate can be stored in muscle at approximately four times the concentration of adenosine triphosphate. In muscles it spontaneously undergoes degradation to form a cyclic anhyride-creatinine. The blood concentration of creatinine and its excretion in urine are remarkably constant in normal individuals. Therefore serum creatinine level is used as an indicator for assessing kidney function.
Principle of the method
Creatinine present in serum or plasma directly reacts with alkaline picrate resulting in the formation of a red colour, the intensity of which is measured at 505nm/green filter. Protein interference is eliminated using sodium lauryl sulphate. A second absorbance reading after acidifying with 30% acetic acid corrects for non-specific chromogens in the samples.
Specimen type, collection and storage
Serum or plasma can be used. Avoid using haemolysed or lipaemic samples. Stable for 12 hours at room temperature (25-350
C), one week at 2-80
C and for 3 months at –200
C.
Reagents
All chemicals must be Analar grade
(a) Reagent A
Into 400ml of distilled water taken in a 500 ml beaker add 4.4g of NaO H. M ix to dissolve, then add 9.5g trisodium phosphate [Na3PO 412H2O ], dissolve and then add
9.5g of sodium tetraborate [Na2B4O710H2O ]. After dissolving check that the pH is above
10, adjust if necessary by the dropwise addition of 1M NaO H. Transfer to a 500 ml volume flask and make up to 500ml with distilled water. M ix well. Stable for 3 months at 2-80C.
Guidelines on Standard O perating Procedures for M icrobiology
Dissolve 20g sodium lauryl sulfate in a final volume of 500ml distilled water. Stable for 6 months at room temperature (25-350
C).
(c) Reagent C
Picric acid supplied commercially contains 50% by weight of water to ensure safety in transit. Therefore the amount of picric acid weighed out should be proportionally more than the amount of the required anhydrous picric acid.
For reagent C, 4.6g of anhydrous picric acid is required. Therefore weigh approximately 7.0g but not less than 6.0g moist picric acid and add to 500ml of distilled water taken in a volumetric flask, mix and leave overnight at 370
C. Then filter and store in brown glass bottle at room temperature (25-350
C). Stable for 1 year.
(d) W orking reagent
At the time of analysis freshly mix equal volumes of the above three reagents. After use discard any leftover working reagent.
(e) Stock creatinine standard 100mg/dl
Dissolve 100 mg of pure creatinine in 0.1 M HCl and make up to 100 ml with 0.1 M HCl in a volumetric flask. Stable for 6 months at 2-80
C.
(f) W orking creatinine standard
Dilute 2, 4, 6 and 8 ml of stock creatinine standard each to 100 ml with 0.1 M HCl to get creatinine concentrations of 2, 4, 6 and 8 mg/dl, respectively. Stable for 6 months at 2-80C.
(g) 30% (V/V) Acetic acid
Dilute 30ml of glacial acetic acid to 100ml with distilled water. Stable for 3 months at room temperature (25-350
C).
Equipment, glassware and other accessories
Refer to Section A (2), Introduction to SO P.
Procedure
The protocol of the procedure is described below.
Pipette the following into appropriately labelled 18 x 150 mm tubes
(Standards:S2 = 2mg/dl, S4= 4mg/dl, S6= 6mg/dl & S8= 8mg/dl)
Blank S1 S2 S3 Test Q C
W orking reagent (ml) 3.0 3.0 3.0 3.0 3.0 3.0
Guidelines on Standard O perating Procedures for M icrobiology
Blank S1 S2 S3 Test Q C
Standard (ml) - 0.2 0.2 0.2 -
-Test sample /Q C (ml) - - - - 0.2 0.2
M ix Well
Leave at room temperature (25-350
C) for 30 minutes. Set the spectrophotometer/ filter photometer to zero with blank at 505 nm/green filter and measure the absorbance of the other tubes. After measuring the absorbance pour the solutions back into the respective tubes. Then add 0.2 ml of 30% acetic acid to the test and Q C tubes, mix well and leave at room temperature (25-350
C) for 5 minutes. Again set the spectrophotometer/filter photometer to zero with blank at 505nm/green filter and measure the absorbance of test and Q C.
Calculation and calibration graph
Subtract the second absorbance values of test and Q C from the first set of values. Draw a calibration graph by plotting the absorbance values of standards against their respective concentrations. The measurable range with this graph is from 0.2 to 8.0 mg/dl. Plot the corrected absorbance of test and Q C and read off the values of creatinine.
Guidelines on Standard O perating Procedures for M icrobiology
Analytical reliabilities
Refer to pages 7-9 of section 1 (General Introduction) on the use of internal Q C and interpretation of daily Q C data (for releasing patients’ results).
Since creatinine is one of the most common analytes measured in a laboratory, inclusion of an internal Q C (normal Q C pool) with every batch of samples analysed in the day, is recommended, irrespective of the number of samples in a batch. Further, even when a single sample is analysed as an “ emergency” sample at any time of the day or night, it is essential to include an internal Q C. From the Q C results obtained for the day, mean, standard deviation and %CV can be calculated to ensure that within-day precision is well within the acceptable limit, i.e, 5%.
The mean value of internal Q C for the day can be pooled with the preceding 10 or 20 mean values obtained in the previous days and between–day precision can be calculated and expressed as % CV. Ensure that this is well within the acceptable limit, i.e, 8%.
At least once a day analyse another Q C serum from either a low Q C or high Q C pool.
“ Assayed” Q C sera with stated values (ranges) are available from several commercial sources, viz. Boehringer M annheim, BioRad & Randox.
If a laboratory uses Q C sera from a commercial source, it is important that the company certifies that their Q C materials are traceable to international reference materials.
H azardous materials
Picric acid is poisonous and sodium hydroxide is caustic – avoid contact with skin and mucous membranes.
Reference range and clinical interpretation
Serum/Plasma Creatinine: M ale 0.7 – 1.4 mg% Female 0.4 – 1.2 mg%
Serum creatinine concentration is related to muscle mass and the values are lower in children. Increased serum creatinine is associated with decrease in glomerular filtration rate (GFR), whether the cause is pre-renal, renal or post- renal. Pre-renal factors include conditions such as congestive heart failure, shock, diarrhoea, uncontrolled diabetes mellitus, use of diuretics, etc. Renal factors involve mainly damage to the glomeruli. Post-renal factors may be prostatic hypertrophy, calculi blocking the ureters or neoplasms compressing the ureters. The serum creatinine concentration is monitored closely after a renal transplantation because a rising concentration, even though small, may be an indication of graft rejection.
Limitations
Guidelines on Standard O perating Procedures for M icrobiology
result from specimens with suspected interference. Inform the requesting physician of the problem.
References
(1) Slot C. (1965) Scand J. Clin. Lab Invest. 17, 381 – 387.
6. Cholesterol – Cholesterol oxidase
method
Introduction
The major constituents of plasma lipids are cholesterol and triglycerides. Cholesterol is an important compound of cell membrane and precursor for the synthesis of bile salts and steroid hormones.
Cholesterol is synthesized in the liver and transported in the blood mainly in the form of LDL and HDL. In blood, cholesterol is present in free as well as esterified form.
O ver the decades serum cholesterol has been measured by methods employing Liebermann-Burchard reaction. The enzymatic method has become popular in recent years. The percentage of participants in the External Q uality Assessment Scheme conducted from the author’s laboratory, employing the enzymatic method, has increased significantly from 10 to 85 in the last decade.
Principle of the method
Cholesterol esters in serum are hydrolysed by cholesterol esterase. The free cholesterol is then oxidized by cholesterol oxidase to the corresponding ketone liberating hydrogen peroxide, which is then converted to water and oxygen by the enzyme peroxidase. Para aminophenazone (4 aminophenazone) takes up the oxygen and together with phenol forms a pink coloured quinoneimine dye, which can be measured at 515nm/ yellow green filter.
Specimen type, collection and storage
Serum or plasma can be used. A fasting blood sample is preferred for lipid profile test. However, if cholesterol alone has to be analysed, a random sample can also be used.
The specimen is stable for a week at 2 - 80C and at least for 3 months at - 200C.
Reagents
All chemicals must be Analar grade
Guidelines on Standard O perating Procedures for M icrobiology
cholesterol by the enzymatic method. These kits are most economical and readily available and therefore practically in most of the laboratories cholesterol is measured by using kits. Laboratories using kits are advised to follow carefully the instructions given in the leaflet. Commercial companies generally provide a single reagent consisting of the following chemicals:
4 – aminophenazone Cholesterol esterase
Phenol Cholesterol oxidase
Peroxidase Sodium azide
The reagent is provided in the lyophilysed form and proper instructions are given for reconstitution and use in the assay. The reagent is generally stable for one week when stored at 15 to 250
C and one month at 2- 80
C.
Equipment, glassware and other accessories
Refer to Section A (2), Introduction to SO P.
Procedure
The protocol of the procedure is described below.
Pipette the following into appropriately labelled 13 x 100 mm tubes
Blank Standard Test Q C
Reagent solution (ml) 2.0 2.0 2.0 2.0
Standard (ml) - 0.02 - -
Test sample /Q C (ml) - - 0.02 0.02
M ix well. Incubate at 370
C in a waterbath for 5 minutes or at room temperature (25- 350C) for 15 minutes. Remove from waterbath and cool to room temperature. Set
spectrophotometer / filter photometer to zero using blank at 510 nm / yellow green filter and measure the absorbance of standard, test and Q C.
This protocol is designed for spectrophotometers / filter photometers that require a minimum volume of reaction mixture in the cuvette of 1ml or less. Since economical use of the reagent is possible with this protocol, the cost per test can be kept to the minimum. However, if a laboratory employs a photometer requiring a large volume of reaction mixture for measurement, viz. 5 ml, it is advised that the volumes of reagent, standard, and test sample/Q C mentioned under # 6 be increased proportionately.