Temporal changes in diversity and expression patterns of fungal laccase genes
within the organic horizon of a brown forest soil
Harald Kellner
a,b,*, Patricia Luis
c, Bettina Schlitt
a,b, François Buscot
a,baUFZ - Helmholtz Centre for Environmental Research (Leipzig-Halle) Ltd., Department of Soil Ecology, Theodor-Lieser-Str. 4, D-06120 Halle/Saale, Germany bUniversity of Leipzig, Institute of Botany - Terrestrial Ecology, Johannisallee 21, D-04103 Leipzig, Germany
cUniversite´ de Lyon, Universite´ Lyon 1, Ecologie Microbienne, UMR CNRS 5557, USC INRA 1193, Baˆtiment Andre´ Lwoff, 43 Boulevard du 11 Novembre 1918, F-69622 Villeurbanne Cedex, France
a r t i c l e
i n f o
Article history:
Received 11 December 2008 Received in revised form 10 March 2009 Accepted 23 March 2009 Available online 21 April 2009
Keywords: Ascomycetes Basidiomycetes Laccase gene expression Lignin degradation
a b s t r a c t
Temporal fluctuations of present and expressed fungal genes encoding the ligninolytic enzyme laccase were examined bimonthly between March 2004 and April 2005 in the organic horizon of a beech forest Cambisol. Using two sets of degenerate primer pairs, we detected 73 different basidiomycete laccase genes from soil DNA extracts and 42 different transcripts of asco- and basidiomycetes from soil RNA extracts (cDNA). Phylogenetic analysis related the sequences to fungal taxa. The highest fungal laccase gene richness in soil DNA and RNA samples were found in August, October and January, and followed the input of fresh litter into soil. The highest change of the fungal laccase gene population was observed from October to January, but no distinct temporal change in the total soil laccase activity was measured. Present and expressed laccase gene populations were highly different, implying different subsets amplified with our primer sets and likely impacting future research strategies. Despite considerable variations in gene presence and expression, we found a steady expression and high soil enzyme activity of fungal laccases at each sampling date, thus presumably laccases have major impacts to soil organic matter turnover and stabilization processes.
Ó2009 Elsevier Ltd. All rights reserved.
1. Introduction
The accumulation and turnover of soil organic matter (SOM) result from a balance between mineralization and stabilization due to the recalcitrance of some compounds and the formation of low bioavailable organo-mineral complexes (von Lu¨tzow et al., 2006). Soil microorganisms are largely involved in both mineralization and stabilization processes, and in forest ecosystems fungi are key players (Berg and McClaugherty, 2003; Osono, 2007). In deciduous forests, plant litter is one major annual resource input for soil fungal communities, and it is colonized in relatively short time scales (Berg and Gerstberger, 2004). The first colonizers, i.e. yeasts, zygomycetes and several ascomycetes, use easy available soluble compounds before being replaced by asco- and basidiomycetes able to attack insoluble and more recalcitrant substances such as cellulose and lignin (Dighton, 1997; Koide et al., 2005). Recently,
molecular techniques allow a better understanding and monitoring of these fungal dynamics directly in soil. In a recent study on the degradation of leaf litter in a native and foreign habitat, it was demonstrated that the general degradation capability was site specific and probably driven by fungal adaptation to the local leaf litter type (Aneja et al., 2006). Thus, degradation of sugars, starch, cellulose and lignin by the native communities was higher. In course of the degradation, the typical increase in the proportion of lignin was observed (Aneja et al., 2006).
Lignin, the second most abundant biopolymer in nature, is largely resistant against microbial attack (Ko¨gel-Knabner, 2002) but is degraded by fungi producing ligninolytic oxidative exoenzymes (Thorn, 1997). Monitoring changes in fungal communities that produce such exoenzymes provides information on their potential role in temporal SOM degradation processes. Instead of monitoring fungal species based on their ribosomal RNA genes or spacer regions, studies following this line should analyze genes encoding exoenzymes such as phenol oxidases (laccases), manganese- and lignin-peroxidases,
b
-glucosidases or cellobiohydrolases that degrade plant litter (Zak et al., 2006; Edwards et al., 2008).Within fungal oxidative exoenzymes, laccases are one of the most universal. They catalyze the oxidation of various aromatic
*Corresponding author. FUSAGx, Unite´ de Biologie animale et microbienne, Avenue Mare´chal Juin 6, B-5030 Gembloux, Belgium. Tel.:þ32 81 622355; fax:þ32 81 611555.
E-mail address:[email protected](H. Kellner). URL:http://www.haraldkellner.com/html/laccase_project.html
Contents lists available atScienceDirect
Soil Biology & Biochemistry
j o u r n a l h o m e p a g e : w w w . e l s e v i e r . c o m / l o c a t e / s o i l b i o
compounds, particularly phenolic substrates, coupled to the reduction of oxygen to water and are highly involved in biodegra-dation of biopolymers such as lignin (Baldrian, 2006). It was shown that the diversity of basidiomycete laccase genes and the total soil laccase activity declined parallel with the SOM content along a vertical soil profile of a beech/oak-forest Cambisol (Luis et al., 2004, 2005b). In the present study, an analysis of the temporal change of basidiomycetes harboring laccase genes was conducted in the same forest soil at six sampling dates during one year. This study considered both the gene presence and their expression, and also measured the laccase activity in the soil. A previous work had shown a high spatial heterogeneity in diversity and expression of the genes (Luis et al., 2005a,b), hence this study was performed at a more homogeneous place of the stand in a pure beech trees plantation (Fagus sylvatica).
We focused our study on the organic forest floor layer that harbors the highest laccase gene diversity and laccase activity at the site (Luis et al., 2005a,b) and which is submitted to the highest temporal variations concerning litter input, soil temperature, metric potential which all might influence the composition and activity of ligninolytic soil fungi. We hypothesized that temporal variations in gene presence, gene expression and activity of resulting enzymes would not necessarily be synchronous and would have distinct orders of magnitude.
2. Materials and methods
2.1. Sampling site and design
Soil samples were taken from an integrated experimental station of the Institute of Ecosystem Research (BITO¨K; University of Bayr-euth) located in the Steigerwald (495202600N, 102705400E) near
Bamberg (Bavaria, Germany) at an elevation of 460 m above the sea level. The site is covered by a 100-year-old mixed stand of European beech (F. sylvaticaL.) and Pedunculate oak (Quercus roburL.) with sparse understorey vegetation. The soil is a Dystric Cambisol ( FAO-UNESCO, 1990) characterized by a fine moder humus layer and a C:N ratio of 20. The pH is 4.2 for the organic layer. The turnover of organic matter in this soil type is rapid with a low accumulation in the lower horizons. The organic O-horizon contains about 40% of organic carbon (Kaiser et al., 2002). The climate is cool-temperate with a transition from oceanic to continental, an average temperature of 7.0–8.0C and 850 mm annual precipitation. Climatic parameters
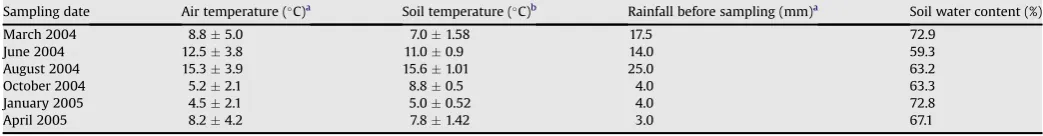
were continuously measured (BITO¨K; University of Bayreuth) and mean values of the one-week time-span before the sampling are given inTable 1. Soil water content was measured by following the mass loss of 10 g organic horizon soil composite sample, dried for 24 h at 90C. The peak period of litterfall is between October and
November (Kalbitz, personal communication).
Samples of the organic layer, including fresh litter, were collected in three small plots (named P2, P4, P6 on the site) during one year: March, June, August, October 2004 and January, April 2005 (March 2004–April 2005,Table 1). The three sampled plots
were located within a homogenous stand of beech trees (the nearest oak tree was at 12 m) without underground vegetation and had a minimum distance to a tree or to the next plot of 3 m. According to previous results, this distance was found to correspond to independent samples (Luis et al., 2005b). One plot had an area of 2020 cm, which should be highly dependent in case of
three-dimensional growing fungi. Within this plot area (20 20 cm), three soil cores (subsamples) with 2 cm diameter and approxi-mately 10 cm deep, were taken at each date, the organic layer including the litter was separated, all subsamples were mixed to a composite sample and stored immediately in liquid nitrogen. The opened holes were locked with a 15 ml centrifuge tube to remain the soil as undisturbed as possible. This sampling process was repeated on each sampling date for each plot. During the sampling campaign, fruiting bodies (if found) were collected for subsequent molecular analysis. The fruiting bodies were dried and deposited at the herbarium of the University of Leipzig, Germany (LZ).
2.2. Soil DNA and RNA extraction, cDNA synthesis
The DNA extraction from the soil samples was performed according toLuis et al. (2004). Total RNA was extracted from the same homogenized soil samples and cDNAs were synthesized following the procedures described inLuis et al. (2005a).
2.3. PCR, sequencing and sequence analysis
Basidiomycete laccase genes from soil DNA and soil RNA (cDNA) samples were amplified using the degenerate primer pair Cu1F (50-CAY TGG CAY GGN TTY TTY CA-30) and Cu2R (50-G RCT
GTG GTA CCA GAA NGT NCC-30) (Luis et al., 2004). Furthermore,
the degenerate primer pair Cu1AF (50-ACM WCB GTY CAY TGG CAY
GG-30) and Cu2R was used to amplify ascomycete laccase genes
from the soil RNA (cDNA) samples (Kellner et al., 2007a). In order to determine general fungal growing activity, the fungal
b
-tubulin gene was amplified from soil RNA (cDNA) using the primer pair B3.6F and B1.2R (Thon and Royse, 1999). All amplification settings followed protocols ofLuis et al. (2004, 2005a)and Kellner et al. (2007a).From each amplification product (3 soil samples per date), 7
m
l was loaded onto a 2% agarose gel and electrophoresed twice, for technical replication. Thereafter, the gels were stained with ethidium bromide and obtained DNA bands were visualized and photographed under UV light. Subsequently, the intensity of the DNA bands derived from the expression analysis of laccase andb
-tubulin genes were quantified using ImageQuant version 5.0 Soft-ware (Molecular Dynamics, Amersham Biosciences). All amplified laccase gene products were corrected against the intensity of the appropriateb
-tubulin gene intensity. The highest corrected quan-tification value for the laccase PCR products was set to 100.All laccase gene PCR products derived from soil DNA and soil RNA (cDNA) were then cloned and sequenced using the protocols of
Luis et al. (2005b). Nucleotide sequences were compared with the
Table 1
Climatic parameters and total soil water content for each sampling date.
Sampling date Air temperature (C)a Soil temperature (C)b Rainfall before sampling (mm)a Soil water content (%)
databases of the National Center for Biotechnology Information (NCBI) using the Blast search algorithm (Altschul et al., 1997). The sequences, which gave the best blast matches, including putative multicopper oxidases from the Clusters of Orthologous Groups of proteins KOG1263 (Tatusov et al., 2003), were retrieved and inte-grated into the phylogenetic analysis.
The sequences were aligned using BioEdit7 (Hall, 1999) and the final nucleotide alignment, available online under study no. S2321 in TreeBASE (http://www.treebase.org/treebase/index.html), was exported to a NEXUS file and analyzed using PAUP*4.0b10 (Swofford, 1998). A neighbor-joining (NJ) tree was constructed using the Kimura 2-parameter model. All laccase gene sequences of this analysis were submitted to GenBank and are available under accession numbersEF423278–EF423319andEF439882–EF439898.
2.4. Data and population analysis
The different types of laccase genes, their eventual affiliation to taxa and functional groups (i.e. saprotrophic or mycorrhizal fungi) were determined from the constructed neighbor-joining (NJ) tree and recorded for each plot (i.e. P2, P4, P6) and sampling month in a quantitative matrix. Sequence differences were recorded on the level of the nucleic acids; intron appearance, and high branch bootstrap values gave additional support for the taxonomic rela-tionship of the soil DNA derived sequences. All detected laccase genes, having the same DNA sequence, were set as identical laccase gene ‘‘type’’. The different types were analyzed for dominance among all analyzed plots, and their richness (S), diversity (H) and evenness (E), including clone numbers, were also estimated for each plot. The diversity index (H), including the different gene types and their clone number, was estimated using the Shannon equation [H ¼
S
(Pi*ln(Pi))] (Shannon, 1948). The evenness (E),which is a combination of the Shannon index and the richness coefficient, was calculated using the formula [E ¼H/ln(S)]. The richness and diversity were tested for significant differences among the sampling dates by one-way ANOVA (SigmaStat 2.03, SPSS Inc., US). All conclusions were based on at least the 5% level of signifi-cance (P<0.05).
To estimate the temporal variation of the fungal laccase gene populations, two approaches were used: (1) a presence/absence analysis of the laccase genes characterized by Sørensen distance amongst two sequential sampling dates using the program PC-Ord 4.41 (McCune and Mefford, 1999; Luis et al., 2005b). The Sørensen distance, measured as percent dissimilarity, is a proportion coeffi-cient given by the formula [12W/(AþB)]; whereWis the sum of shared abundances and A & B are the sums of abundances in individual sample units (Beals, 1984). And (2) a genetic population analysis of all laccase gene sequences per sampling date (combined data of the three plots) using the program Arlequin 3.01 (Excoffier et al., 2005) and UniFrac (Lozupone, 2005, see alsoLauber et al., 2009). For analysis of the genetic population using Arlequin, each recorded different laccase gene sequence was treated as haplotype. To compare the genetic variation between the populations, dissimilarity indices (FST) (Reynolds et al., 1983; Slatkin, 1995)
between all pairs of populations for laccase types amplified from soil DNA and the combined soil RNA (cDNA) were estimated. The statistical significance of these genetic distances was tested by 10,000 permutations of the haplotypes between the populations. Moreover, a laccase gene alignment without references but including an outgroup sequence was used for constructing a maximum likelihood phylogenetic tree, and uploaded into the UniFrac population difference software (Lozupone, 2005). UniFrac is a metric of phylogenetic divergence that calculates the genetic distance between multiple gene libraries as the percentage of branch length that leads to only one of a pair of samples. To show
the differences among the population, the integrated UniFrac cluster analysis was used and the integrated UniFracPTest was used for calculation of statistical significance (Lozupone, 2005).
2.5. Laccase activity in soil samples
Twenty soil samples of the organic layer surrounding the three plots were taken each sampling date and analyzed for laccase activity using ABTS [2,2-azino-bis(3-ethylbenzothiazoline-6-sulfo-nate); Sigma] as described inLuis et al. (2005b). The activity was expressed in units (1U¼1
m
mol min1) per gram of dry soil matter.Statistical significance between sequential samplings was con-ducted using SigmaStat 2.03 (SPSS Inc., US).
3. Results
3.1. Sequence analysis of fungal laccase genes
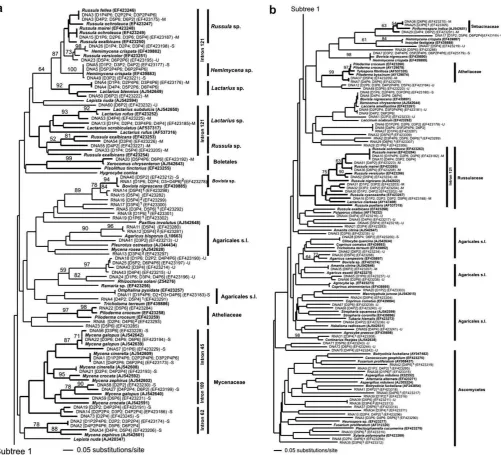
Fragments of fungal laccase genes were amplified from soil DNA extracts using degenerate primer pairs annealing in the conserved copper binding regions I and II (cbr I and II,Fig. 1). The amplicons ranged from 140 bp to 200 bp. A total of 450 clones obtained from PCR products of soil DNA extracts were analyzed (3 plots 6 sampling dates25 clones). The primer pair Cu1F/Cu2R yielded in 408 laccase genes fragments from the O-horizon, which were separated in 73 distinct genes (Fig. 2). The primer pair Cu1AF/Cu2R also gave amplicons, but the obtained sequences were not related to fungal laccase genes.
The analysis of 180 expressed gene sequences obtained with both primer pairs from soil RNA extracts (cDNAs) revealed 42 different laccase gene types. Noteworthy, only five expressed genes corresponded to those amplified from the DNA extracts. A neighbor-joining analysis of all detected laccase genes clustered the sequences in major clades representing different fungal families or orders like Agaricalessensu lato, Atheliaceae, Boletales, Myce-naceae, Russulaceae (Fig. 2). Most sequences could be related to basidiomycetes while only few ascomycete laccase genes were found (Fig. 2). Major clades containingLactariusspp.,Mycenaspp.,
Pilodermaspp. andRussulaspp. received bootstrap support (Fig. 2). The intron structure of 165 laccase genes obtained from soil DNA extracts and collected fruit body-DNA was analyzed between copper binding region I and II (Fig. 1). Eighty-eight genes (46 soil derived, 42 of fungal references) comprised one intron except Macrotyphula
juncea (AJ542615) and Mycena rosea (AJ542628) that had two
between cbr I and cbr II (Table 2). Further 77 laccase gene types, 27 from soil and 50 from reference fungi, had no intron. Thirteen different intron positions were detected (Fig. 1, Table 2) and all introns followed the GT/AG rule. Some intron insertion sites were specific as they were found for members of distinct clades (Fig. 2). Most Russulaceae comprised one intron at gene fragment position 121.Mycenaspecies clustering in three subclades had clade specific introns at positions 45, 62 and 109, respectively (Fig. 2,Table 2).
3.2. Fungal laccase gene dominance structure in soil samples
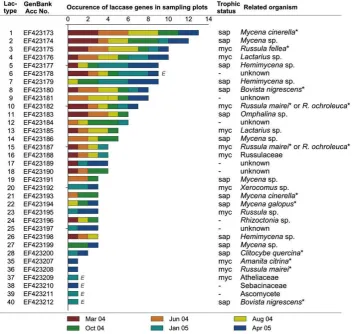
Out of 73 different laccase gene types amplified from soil DNA extracts, 34 were found at least two times in different soil samples. Moreover, 14 gene types were found more than four times and considered as dominant in the study (Fig. 3). Among these domi-nant types, 6 belonged to saprotrophic fungi of the speciesMycena cinerella(the most dominant in this investigation), Mycenaspp.,
dominant fungal laccase genes related toB. nigrescens,Hemimycena
sp.,Lactarius sp., M. cinerella, Russula fellea and Russula mairei/
ochroleucawere found throughout the whole year (Fig. 3). A total of 11 sequences from the soil DNA extracts were identical to amplicons from fruiting bodies collected at the sampling site (Fig. 3), highlighting the high identification rate of soil-derived sequences in this study. Of the 73 different laccase gene types found
in the soil, 21 (29%) were related to saprotrophic and 22 (30%) to mycorrhizal fungi; which were based on phylogeny, bootstrap support of distinct clades, and intron appearance (Fig. 2). The remaining 30 (41%) types could be related neither to taxa nor to a trophic status (‘‘unknown’’).
A dominance study on the expressed laccase genes showed 10 different genes to be expressed at least in two soil samples, while
Fig. 1.Schematic representation of a typical fungal laccase between copper binding regions cbr I and cbr II. Numbers beneath show the different found introns and their insertion position. Boxes marked with ‘‘ins’’ and ‘‘del’’ indicate positions, where amino acid insertion or deletions was found (see also supplementary information inHassett et al., 2009).
the remaining 32 gene types were only found as singletons. Out of these 42 gene types, 28 (67%) were related to basidio- and 14 (33%) to ascomycete taxa (Fig. 2). The most dominant expressed gene type, with an appearance of four times in either different plots or on a different sampling date, was related toB. nigrescens.
3.3. Temporal variation of basidiomycete laccase gene diversity
In a first step, the temporal variations in abundance of basidiomycete laccase genes were analyzed (for each unique type
to a maximum appearance of 3, if found in all 3 plots). An increase from March (29 laccase genes) to October 2004 (45 genes), which corresponded to an enhanced detection of sapro-trophic and unknown basidiomycetes, was followed by a decrease in January and April 2005 (33 and 37 genes) (Fig. 4a,Table 3). The Shannon diversity indices, including the clone number of indi-vidual sequence types found at each sampling date varied consistently with the richness of the laccase gene population (Table 3). Thus, the highest Shannon diversity of the community was in October 2004 with 3.182, whereas the lowest was
Table 2
Characterization of the intron occurrence in all analyzed laccase sequences, giving position, length, reading frame and fungi including it.
Intron no. (seeFig. 1)
No. of laccase gene types including it
Insertion position
Length of intron (bp)
Frame Fungal references including it
1 1 26 71 þ1 Macrotyphula juncea
2 11 45 49–55 þ2 Mycena cinerella,Mycena crocata,Mycena galopus,Mycena zephirus
3 2 51 51–53 þ2 Pleurotus ostreatus
4 1 53 51 þ1 Botryotinia fuckeliana
5 6 62 51–55 þ1 Mycena zephirus
6 6 64 53–60 0 Rhizoctonia solani
7 2 65 52 þ1 Macrotyphula juncea,Mycena rosea
8 1 80 61 þ1 Unknown
9 1 81 49 þ2 Unknown
10 1 92 53 þ1 Mycena rosea
11 5 109 52–58 0 Mycena crocata,Mycena galopus
12 10 118 53–61 0 Bovista nigrescens,Hemimycena crispata,Piloderma byssinum,Pseudocyphellaria crocata,Tylospora fibrillosa
13 44 121 52–63 0 Hemimycena crispata, allRussulasp., allLactariussp.
No intron 77 – – Nearly all Ascomycota, many Basidomycota (exceptMycenaand Russulaceae species)
observed in March, June 2004 and January 2005 (2.528–2.877) (Table 3). The evenness of the fungal laccase gene population reached values between 0.785 and 0.917, indicating an even distribution of the sequenced clones among the different gene types (Table 3). However, the mean richness and mean diversity indices of the 3 soil replicates (plots) per sampling date (Table 3) were not significant different among all sampling dates. The highest dissimilarity between two consecutive samplings was measured between October and January, representing a change of more than 50% of the laccase genes present on these two sampling dates (Fig. 4b). Dissimilarities among other sampling dates ranged between 15 and 30% (Fig. 4b).
In a further step, the genetic difference between the laccase gene populations was investigated. No significant difference (UniFrac PTest and ArlequinFST; P< 0.05 significance level) of
the laccase gene populations obtained from genomic DNA between different sampling dates was found (Table 4). The clustering of the laccase gene populations amplified from soil DNA showed no consistent trend between consecutive samplings, except a clustering of the January and April 2005 populations apart from the four other laccase gene populations obtained from soil DNA extracts (Fig. 5).
3.4. Expression of fungal laccase genes in soil samples
From RNA extracts that were processed in cDNAs, 18 and 33 different laccase gene types were amplified with the primer pair combinations Cu1F/Cu2R and Cu1AF/Cu2R, respectively. As 9 gene types were amplified with both primer pairs, altogether 42 different laccase genes were detected in the expression study. Gene expression was observed at all sampling dates (Fig. 6a). The highest relative expression rates, using both primer sets, were found in August 2004 and January 2005 (Fig. 6a). The highest richness of expressed genes was observed in January 2005 with 11 different types per primer set, whereby some genes were revealed with both primer sets. In August 2004, 11 different laccase genes were also obtained but only with primer pair Cu1AF/Cu2R. A clearer picture of the expression pattern could be drawn when analyzing the total richness per sampling date, i.e. the total amount of expressed gene types detected with both primer sets (‘‘S’’ in Fig. 6a). With 19 different expressed gene types, the highest richness was observed in January 2005, followed by August and October 2004 (11), March 2004 (9), June 2004 (4) and April 2005 (2) (Fig. 6a). The attempt to attribute the expressed genes to fungal groups and taxaviacluster analysis (Fig. 2) showed expression shifts between asco- and basidiomycetes. In January 2005, 16 of the expressed genes belonged to basidio- and 3 to ascomycetes, whereas in October 2004, 7 different genes were expressed in asco- vs.4 in basidio-mycetes (Fig. 6a). The strong relative expression found in August 2004 corresponded to 7 different basidio- and 4 different asco-mycete laccase genes (Fig. 6a).
Out of 28 expressed basidiomycete laccase genes, 13 (46%) could be attributed to precise taxonomic levels, i.e. Agaricalessensu lato, Atheliaceae, Sebacinaceae,B. nigrescens(Fig. 2). In January 2005, 7
Fig. 4.Characterization of the basidiomycete laccase gene abundance separated by putative nutritional status (a), and their change (dissimilarity) between two consec-utive samplings according their presence and absence (b).
Table 3
Number of sequences obtained from each single plot and plots combined for each sampling date (community), analyzed for laccase gene richness (S), evenness (E) and Shannon diversity index (H). Numbering of single soil cores followed sampling date (March 2004–April 2005) and plot name (P2, P4, P6). Numbers in brackets for pooled laccase gene richness include the abundances of each type found among three possible plots.
Sampling analysis No. of sequences Laccase gene population
S E H
Single plots
March 2004 P2 22 8 0.806 1.677
March 2004 P4 21 9 0.929 2.042
March 2004 P6 25 12 0.889 2.209
June 2004 P2 17 10 0.934 2.15
June 2004 P4 23 11 0.921 2.209
June 2004 P6 20 10 0.928 2.138
August 2004 P2 24 14 0.961 2.535
August 2004 P4 26 10 0.875 2.014
August 2004 P6 25 14 0.923 2.435
October 2004 P2 23 16 0.931 2.582
October 2004 P4 27 20 0.967 2.898
October 2004 P6 26 9 0.887 1.949
January 2005 P2 21 7 0.785 1.527
January 2005 P4 24 15 0.9 2.437
January 2005 P6 19 11 0.889 2.132
April 2005 P2 23 16 0.971 2.691
April 2005 P4 25 11 0.931 2.232
April 2005 P6 17 10 0.919 2.115
Pooled data of 3 plots – ‘‘pooled community’’
March 2004 68 21 (29) 0.879 2.677
June 2004 60 23 (31) 0.917 2.877
August 2004 75 28 (38) 0.909 3.028
October 2004 76 34 (45) 0.902 3.182
January 2005 64 25 (33) 0.785 2.528
April 2005 65 26 (37) 0.906 2.951
(41%) of the 16 expressed genes were related to Agaricales (4 types, 2 of them belonging to genusAgaricussp.) and to Atheliaceae (3 types). In October 2004, 4 of 7 expressed genes belonged to Agar-icales (1), Atheliaceae (2) and toB. nigrescens(1). In August 2004, 3 of 7 expressed gene types belonged to Agaricales (2) and to B. nigrescens(1) (Fig. 2). Single genes expressed at the remaining three sampling dates belonged to B. nigrescens, an Atheliaceae and a Sebacinaceae (Fig. 2). None of the ascomycete expressed genes could be related to precise taxon due to the limited amount of ascomycete laccase gene sequences in databases. However, the highest richness of expressed ascomycete genes was in October 2004 with 7 genes followed by August 2004 (4), January 2005 (3), March 2004 (3), June 2004 (2) and April 2005 (0) (Fig. 6a).
The comparison of soil DNA amplifiedvs.expressed laccase gene populations, revealed a distinct clustering of populations, splitting the six soil DNA populations apart from the six expressed laccase gene populations using the UniFrac metric (Fig. 5). Hereby, the amplified expressed laccase gene population was significantly different from all soil DNA amplified laccase gene populations (Table 4).
3.5. Relation to soil enzyme activity
The laccase activity was analyzed from 20 samples per date using the laccase substrate ABTS. Median enzyme activity values of all samplings ranged between 0.09 and 0.19 U g1 dry matters
(Fig. 6b). A one-way ANOVA showed no significant differences between consecutive samplings. However, certain samples dis-played a very high activity sometimes exceeding the median by the factor 10, e.g. in March 2004 (Fig. 6b).
4. Discussion
In contrast to analyses of soil fungi using neutral markers such as the ribosomal RNA genes (Tedersoo et al., 2003; O’Brien et al., 2005; Aneja et al., 2006), the present study investigated temporal changes in the presence and expression of a functional gene encoding laccase that were frequently shown to be involved in SOM
Table 4
Statistic significance (Pvalues) of difference among the temporal soil DNA amplified laccase gene populations (DNA March 2004–April 2005) and the expressed laccase genes (RNA all). Above diagonal,Pvalues of UniFracPTest and below diagonal, population differentiation based on 10,000 permutations (pairwise differences) using Arlequin. Bold values indicate the significant different populations (P<0.05).
DNA March 2004 DNA June 2004 DNA August 2004 DNA October 2004 DNA January 2005 DNA April 2005 RNA all
DNA March 2004 0.96 1 0.99 1 0.9 <0.001
DNA June 2004 0.82 1 1 0.94 0.99 <0.001
DNA August 2004 0.86 0.93 0.99 1 0.89 <0.001
DNA October 2004 0.81 0.86 0.31 1 0.77 <0.001
DNA January 2005 0.42 0.16 0.46 0.1 0.98 0.01
DNA April 2005 0.44 0.56 0.49 0.39 0.95 <0.001
RNA all <0.001 <0.001 <0.001 <0.001 <0.001 <0.001
Fig. 5.UniFrac cluster dendrogram of environments calculated based on amplified laccase genes from soil DNA (DNA March 2004–April 2005) and soil RNA/cDNA (RNA March 2004-April 2005), of the six samplings.
cycling, i.e. lignin degradation (Baldrian, 2006; Hoegger et al., 2006). Despite the variable copy number of laccase genes in single species, it is possible to relate the sequence of the 140 bp small fragments located between copper binding region I and II to taxo-nomic levels ranging from family to species (Luis et al., 2004, 2005b); in fact we were able to match 11 soil-derived laccase genes to fruitbodies found on the particular site. Moreover, the appear-ance of introns on different positions in the laccase gene fragment and phylogenetic bootstrap values supported distinct clades of our neighbor-joining tree (Fig. 2).Luis et al. (2005a)found in a previous study that diversity and expression patterns of basidiomycete lac-case genes paralleled with SOM content and laclac-case activity in soils and soil horizons. On this basis the present study aimed at char-acterizing temporal changes in diversity and expression patterns in soil fungi harboring laccase genes in the most organic horizon of a forest Cambisol, also including the fresh litter. To reduce spatial heterogeneity in gene distribution and expression already detected in this forest, samples were taken from a pure beech stand, which might explain that only 73 different gene types were found compared to 96 types detected in an adjacent mixed oak/beech stand (Luis et al., 2005b).
Besides the basidiomycete specific degenerate primer pair Cu1F/ Cu2R (Luis et al., 2004), the pair Cu1AF/Cu2R was used to tackle laccase genes of ascomycetes (Kellner et al., 2007a). This pair did not work on soil DNA extracts for fungal laccases, but ascomycete sequences were gathered from the expression study, suggesting that laccase genes of ascomycetes might have introns in the annealing regions. Consequently, the study of the population structure and gene presence only considered basidiomycetes, while the expression analysis also encompassed ascomycetes.
4.1. Temporal changes in laccase gene populations
Along six sampling dates throughout one year, marked fluctu-ations in the diversity (i.e. richness) and in the expression profile of the fungal laccase gene populations were found. The highest changes occurred between the samplings of August 2004, October 2004 and January 2005 (Figs. 4–6). This coincides with the leaf litter input that begins in August and reached a maximum just after the October sampling and might reflect distinct temporal patterns of fungi (i.e. succession) colonizing or imported with new litter (Rosenbrock et al., 1995). The changes were not significant regarding mean values of 3 soil replicates and population differ-entiation using UniFrac or Arlequin.
However, the highest gene abundance was found in October 2005 (Fig. 4a) and seems to correspond to an increase of gene types belonging either to saprotrophic or to unidentified basidiomycetes of which the nutrition mode could not be determined. These new appearing taxa might have developed either as colonizers of sen-escent leaves incorporated into the litter or from germinations of spores produced by the numerous fruiting bodies in autumn. Consistent with the first explanation is the high proportion of expressed ascomycete laccase genes in the October samples. High proportions of ascomycetes were frequently reported on fresh leaf litter (Frankland, 1998; Osono, 2006). The new taxa with laccase genes found in the organic horizon in autumn represent a potential to degrade recalcitrant organic compounds, newly incorporated into the soil during the late summer and the autumn. Dominant genes of saprotrophic and mycorrhizal fungi (i.e.M. cinerella,Russulaspp. and
Lactarius sp.) were detected along the whole year (Fig. 3). The persistence of dominant fungi over the complete sampling campaign is consistent with former studies (Frankland, 1998; Izzo et al., 2005) and molecular investigations on soil fungal communities (Smith et al., 2007). On this background, the changes in the mycorrhizal and saprotrophic communities (Figs.3and4a) that were detected here
seem to corresponded to the occurrence of less frequent taxa like for example,Amanita muscariaorClitocybe quercina(Fig. 3).
The combination of two primer sets allowed the analysis of laccase gene expression of asco- and basidiomycetes in the soil samples. Laccase gene expression was detected during the whole sampling campaign, but a strong temporal variability was found concerning the relative gene expression, the number of different expressed laccase genes (i.e. richness) and the expression within different taxonomic groups (Fig. 6a). The expression level and the total number of expressed genes increased between August 2004 and January 2005, which might correspond to degradative processes following the litter input. Especially for January 2005, the major part of the higher expression was related to genes of basid-iomycetes. Amongst 19 different expressed genes only three cor-responded to ascomycete at this date (Fig. 6a). Beside saprotrophic basidiomycete, the observed degradation potential includes also the involvement of mycorrhizal fungi as several expressed laccase genes belonged to Atheliaceae and especially to Piloderma sp. (Fig. 2), a fungus frequently observed at the forest site.
The highest proportion of expressed ascomycete laccase genes was found in October 2004 and coincided to a reduction of the number of expressed basidiomycete genes. The 7 different expressed ascomycete laccase genes might correspond to phyllo-sphere fungi of the freshly fallen leaves (Osono, 2006) or to autochthonous soil fungi. As already mentioned, this pattern is consistent with the prominent role played by ascomycetes in the primary colonization of fresh litter (Dighton, 1997; Aneja et al., 2006). A laccase production at this stage might increase the access to easily degradable fractions of the fresh litter, which are still protected by lignin.
4.2. Temporal variations of total laccase activity
Despite high variability in the laccase gene expression, the rate of the total laccase activity in the soil was on a constantly high level over the year (Fig. 6b). Contrary to the findings of Criquet et al. (2000), no distinct temporal changes in the activity were found. It is to note that these authors made their investigations under a Medi-terranean climate with a marked summer drought not existing at our field plot. The lack of relation between laccase gene diversity and expression on the one hand and laccase activity on the other one might have several explanations. It could reflect the fact that it was impossible to use the same soil aliquot for both nucleic acid extraction and laccase activity measurements. Furthermore, it cannot be excluded that certain detected or expressed genes might encode other enzymes than degradation-active extracellular laccases (Hoegger et al., 2006). It is also to note that the total laccase activity might partially be due to other soil organisms than fungi, e.g. bacteria (Kellner et al., 2008). This latter argument has however some weakness as fungi dominate within the forest soil and as at the same site a good relation between fungal laccase gene diversity and general laccase activity was shown (Luis et al., 2004, 2005b). Apart these explanations, a resilient and almost constant laccase activity in soils is not surprising. Extracellular enzymes are protected by soil pores or stabilized by several environmental substances and keep active for a long time (Tate, 2002). Our findings of an almost constant laccase activity may therefore reflect that lignin degradation in leaf litter operates all around the year. Soils are long reacting systems and it is known that beech litter degradation takes up to three years (Osono and Takeda, 2001).
4.3. Conclusion
at small scales can merge into high scale processes such as long term degradation and stabilization of the SOM. We made the hypothesis that monitoring in parallel the presence and expression of laccase genes and the activity of laccase enzymes, which they encode and which are involved in turnover and stabilization of the more recalcitrant fraction of the SOM could contribute to enlighten how this complex multi-scale system works. However, using the momentarily available molecular tools, we found distinct present (genomic DNA) and expressed laccase populations (Fig. 5), ques-tioning which approach to use in future research. Analyzing of genomic populations proved useful when comparing different forest ecosystems, soil horizons or ecosystem manipulations (Hassett et al., 2009; Lauber et al., 2009). However, genomic soil-derived populations seem not to represent the active, expressed populations. Future increases in databases (GenBank) might partially resolve this problem.
We could demonstrate distinct temporal changes of the laccase gene community composition and expression that were not reflected by variations in the total activity of extracellular laccases. Abiotic factors like temperature or rainfall did not correlate to observed population richness or enzyme activities (data not shown). However, we found that the changes in the type and diversity level of present and expressed laccase genes might be a response to temporal fluctuations in the differentiation of soil niches, triggered by annual inputs of leaf litter. Such micro-niches are possibly more structured during and shortly after incorporation of fresh litter into the O-horizon, leading to an enhanced diversity in presence and expression of laccase genes to maintain a similar enzyme activity as in phases with lowered niche differentiation. One level was not considered in the study, which concerns the protein synthesis. We actually develop a proteomic approach including antibodies and mass spectrometry to directly identify laccases in soils and will address this level (Kellner et al., 2007b). We expect that considering this fourth level can help to better disentangle soil processes.
Acknowledgements
This work was financially supported by the German Science Foundation (Deutsche Forschungsgemeinschaft, DFG) in the frame of the program ‘‘Soils as source and sink of CO2’’ (SPP1090, Grant no.
BU 941/2-3). Many thanks for helpful comments and hands to: Peter Otto, Carsten Renker, Jesko Kleine, Walter Durka, Karsten Kalbitz, Pedro Gerstberger, Uwe Hell, John Hassett and Susanne Tittmann.
References
Altschul, S.F., Madden, T.L., Scha¨ffer, A.A., Zhang, J., Zhang, Z., Miller, W., Lipman, D.J., 1997. Gapped BLAST and PSI-BLAST: a new generation of protein database search programs. Nucleic Acids Research 25, 3389–3402.
Aneja, M.K., Sharma, S., Fleischmann, F., Stich, S., Heller, W., Bahnweg, G., Munch, J.C., Schloter, M., 2006. Microbial colonization of Beech and Spruce litter - influence of decomposition site and plant litter species on the diversity of microbial community. Microbial Ecology 52, 127–135.
Baldrian, P., 2006. Fungal laccases: occurrence and properties. FEMS Microbiology Reviews 30, 215–242.
Beals, E.W., 1984. Bray–Curtis ordination: an effective strategy for analysis of multivariate ecological data. Advances in Ecological Research 14, 1–55. Berg, B., Gerstberger, P., 2004. Element fluxes with litterfall in mature stands of
Norway Spruce and European beech in Bavaria, South Germany. In: Matzner, E. (Ed.), Biogeochemistry of Forested Catchments in a Changing Environment. Springer, Berlin, pp. 271–278.
Berg, B., McClaugherty, C., 2003. Plant Litter, Decomposition, Humus Formation, Carbon Sequestration. Springer-Verlag, Berlin, Heidelberg New York. Criquet, S., Farnet, A.M., Tagger, S., Le Petit, J., 2000. Annual variations of
pheno-loxidase activities in an evergreen oak litter: influence of certain biotic and abiotic factors. Soil Biology & Biochemistry 32, 1505–1513.
Dighton, J., 1997. Nutrient cycling by saprotrophic fungi in terrestrial habitats. In: Wicklow, D.T., So¨derstro¨m, B. (Eds.), The Mycota, Volume IV: Environmental and Microbial Relationships. Springer, Berlin, pp. 271–279.
Edwards, I.P., Upchurch, R.A., Zak, D.R., 2008. Isolation of fungal cellobiohydrolase I genes from sporocarps and forest soils by PCR. Applied and Environmental Microbiology 74, 3481–3489.
Excoffier, L., Laval, G., Schneider, S., 2005. Arlequin ver. 3.0: an integrated software package for population genetics data analysis. Evolutionary Bioinformatics Online 1, 47–50.
FAO-UNESCO, 1990. Soil Map of the World, Revised Legend. FAO, Rome. World Soil Resources Report 60.
Frankland, J.C., 1998. Fungal succession – unraveling the unpredictable. Mycological Research 102, 1–15.
Hall, T.A., 1999. BioEdit: a user-friendly biological sequence alignment editor and analysis program for Windows 95/98/NT. Nucleic Acids Symposium Series 41, 95–98.
Hassett, J.E., Zak, D.R., Blackwood, C.S., Pregitzer, K.S., 2009. Are basidiomycete laccase gene abundance and composition related to reduced lignolytic activity under elevated atmospheric NO3deposition in a Northern Hardwood Forest?
Microbial Ecology 57, 728–739.
Hoegger, P.J., Kilaru, S., James, T.Y., Thacker, J.R., Ku¨es, U., 2006. Phylogenetic comparison and classification of laccase and related multicopper oxidase protein sequences. FEBS Journal 273, 2308–2326.
Izzo, A., Agbowo, J., Bruns, T.D., 2005. Detection of plot-level changes in ectomy-corrhizal communities across years in an old-growth mixed-conifer forest. New Phytologist 166, 619–630.
Kaiser, K., Eusterhues, K., Rumpel, C., Guggenberger, G., Ko¨gel-Knabner, I., 2002. Stabilization of organic matter by soil minerals – investigations of density and particle-size fractions from two acid forest soils. Journal of Plant Nutrition and Soil Science 165, 451–459.
Kellner, H., Luis, P., Buscot, F., 2007a. Diversity of laccase-like multicopper oxidase (LMCO) genes in Morchellaceae: identification of genes potentially involved in extracellular activities related to plant litter decay. FEMS Microbiology Ecology 61, 153–163.
Kellner, H., Jehmlich, N., Benndorf, D., Hoffmann, R., Ru¨hl, M., Hoegger, P.J., Majcherczyk, A., Ku¨es, U., von Bergen, M., Buscot, F., 2007b. Detection, quanti-fication and identiquanti-fication of fungal extracellular laccases using polyclonal antibody and mass spectrometry. Enzymes and Microbial Technology 41, 694–701.
Kellner, H., Luis, P., Zimdars, B., Kiesel, B., Buscot, F., 2008. Diversity of bacterial laccase-like multicopper oxidase genes in forest and grassland Cambisol soil samples. Soil Biology & Biochemistry 40, 638–648.
Ko¨gel-Knabner, I., 2002. The macromolecular composition of plant and microbial residues as inputs to soil organic matter. Soil Biology & Biochemistry 34, 139–162.
Koide, K., Osono, T., Takeda, H., 2005. Fungal succession and decomposition of Camellia japonicaleaf litter. Ecological Research 20, 599–609.
Lauber, C.L., Sinsabaugh, R.L., Zak, D.R., 2009. Laccase gene composition and relative abundance in Oak forest soil is not affected by short-term nitrogen fertilization. Microbial Ecology 57, 50–57.
Lozupone, C., 2005. UniFrac: a new phylogenetic method for comparing microbial communities. Applied and Environmental Microbiology 71, 8228–8235. Luis, P., Walther, G., Kellner, H., Martin, F., Buscot, F., 2004. Diversity of laccase
genes from basidiomycetes in a forest soil. Soil Biology & Biochemistry 36, 1025–1036.
Luis, P., Kellner, H., Martin, F., Buscot, F., 2005a. A molecular method to evaluate basidiomycete laccase gene expression in forest soils. Geoderma 128, 18–27. Luis, P., Kellner, H., Zimdars, B., Langer, U., Martin, F., Buscot, F., 2005b. Patchiness
and spatial distribution of laccase genes of ectomycorrhizal, saprotrophic and unknown basidiomycetes in the upper horizons of a mixed forest Cambisol. Microbial Ecology 50, 570–579.
McCune, B., Mefford, M.J., 1999. PC-Ord. Multivariate Analysis of Ecological Data, Version 4. MjM Software Design, Gleneden Beach, OR.
O’Brien, H.E., Parrent, J.L., Jackson, J.A., Moncalvo, J.M., Vilgalys, R., 2005. Fungal community analysis by large-scale sequencing of environmental samples. Applied and Environmental Microbiology 71, 5544–5550.
Osono, T., 2006. Role of phyllosphere fungi of forest trees in the development of decomposer fungal communities and decomposition processes of leaf litter. Canadian Journal of Microbiology 52, 701–716.
Osono, T., 2007. Ecology of ligninolytic fungi associated with leaf litter decompo-sition. Ecological Research 22, 955–974.
Osono, T., Takeda, H., 2001. Organic chemical and nutrient dynamics in decom-posing beech leaf litter in relation to fungal ingrowth and succession during 3-year decomposition processes in a cool temperate deciduous forest in Japan. Ecological Research 16, 649–670.
Reynolds, J., Weir, B.S., Cockerham, C.C., 1983. Estimation for the coancestry coef-ficient: basis for a short-term genetic distance. Genetics 105, 767–779. Rosenbrock, P., Buscot, F., Munch, J.C., 1995. Fungal succession and changes in the
fungal degradation potential during the initial stage of litter decomposition in a black forest (Alnus glutinosa(L.) Gaertn.). European Journal of Soil Science 31, 1–11.
Shannon, C.E., 1948. A mathematical theory of communication. Bell System Tech-nical Journal 27, 379–423.
Smith, M.E., Douhan, G.W., Rizzo, D.M., 2007. Ectomycorrhizal community structure in a xericQuercuswoodland based on rDNA sequence analysis of sporocarps and pooled roots. New Phytologist 174, 847–863.
Swofford, D.L., 1998. PAUP*. Phylogenetic Analysis Using Parsimony (*and Other Methods), Version 4. Sinauer Associates, Sunderland, MA.
Tate, R.L., 2002. Microbiology and enzymology of carbon and nitrogen cycling. In: Burns, R.G., Dick, R.P. (Eds.), Enzymes in the Environment. Marcel Dekker, New York, pp. 267–284.
Tatusov, R.L., Fedorova, N.D., Jackson, J.D., Jacobs, A.R., Kiryutin, B., Koonin, E.V., Krylov, D.M., Mazumder, R., Mekhedov, S.L., Nikolskaya, A.N., Rao, B.S., Smirnov, S., Sverdlov, A.V., Vasudevan, S., Wolf, Y.I., Yin, J.J., Natale, D.A., 2003. The COG database: an updated version includes eukaryotes. BMC Bio-informatics 4, 41.
Tedersoo, L., Ko˜ljalg, U., Hallenberg, N., Larsson, K.H., 2003. Fine scale distribution of ectomycorrhizal fungi and roots across substrate layers including coarse woody debris in a mixed forest. New Phytologist 159, 153–165.
Thon, M.R., Royse, D.J., 1999. Partial beta-tubulin gene sequences for evolutionary studies in the Basidiomycotina. Mycologia 91, 468–474.
Thorn, G., 1997. The fungi in soil. In: van Elsaß, J.D., Trevors, J.T., Wellington, E.M.H. (Eds.), Modern Soil Microbiology. Marcel Dekker, New York, pp. 63–128. von Lu¨tzow, M., Ko¨gel-Knabner, I., Ekschmitt, K., Matzner, E., Guggenberger, G.,
Marschner, B., Flessa, H., 2006. Stabilization of organic matter in temperate soils: mechanisms and their relevance under different soil conditions -a review. Europe-an Journ-al of Soil Science 57, 426–445.