Positioning of Higher Educational Institution from the Perception of Student Candidates of West
Java Higher Educational Institution.
1)Zulganef
[email protected];[email protected] Iwa Garniwa
Faculty of Business and Management Universitas Widyatama Bandung Phone: +62227275855; fax: +62227201711
Abstract
West Java is the most populous province in Indonesia and it is the buffer province to the capital city of Indonesia, Jakarta. The position makes this province strategically important for foreign investors or companies to expand their business to Indonesia. This can be the starting point for the companies or investors to enter new markets. The management of companies needs essential market knowledge or information that could guarantee their steps, especially in higher education market. The main research goal of this paper is to provide some knowledge or information about the west java market, especially in the positioning of some higher education institution in Bandung.
The research discussed in this paper has been conducted on two levels. The first part investigated some modal salient believes that has been evaluated by universities or higher education student candidates, and then, based on their modal salient believes, we mapped the perception of university student candidates on universities attributes. In the second part of the study, we have mapped the perceptions of higher education student candidates through multidimensional scaling technique. The research shows among other findings that higher educational student candidates make perceptions based on value, especially religious values. This paper would also make some recommendations on the positioning of higher education in West Java. .
Keywords: Positioning, Multidimensional Scaling, Factor Analysis, High School Student Candidates, Perceived Quality, dyadic.
1)This research is Funded By Fundamental Research Grant, Letter Of Agreement No.128/SP2H/PP/DP2M/III/2007 General
Director Of Higher Education, National Education Department of Republic of Indonesia
Introduction
Some universities in West Java tend to increase their attraction to reach new students by offering new programs, such as Diploma-3, extension, and other special course (Pikiran Rakyat, 14 June 2004). This condition indicates the competition in obtaining students among universities is tight. Therefore, the management should be able to position the university based on the students’ needs, and create programs and strategies based on students’ perception in order to attract new students to enroll to the particular university. One way to develop the strategy is by understanding the market or consumer behavior of that particular university. Understanding consumer behavior is a start of developing a strategy for an organization (Day and Wensley, 1988; Berkman and Gilson, 1988)
The second reason of performing this research is related to West Java as the most populous in Indonesia and lies next to the capital city, Jakarta. According to the 2005 Socio-Economic Survey, West Java's population is 39,960,869. It has an area of 34,736 km2with an average of 1,150 people per km2(www.en.wikipedia.org; 22 June 2007). In addition, West Java lies next to the capital of Indonesia, Jakarta, which has important means for social, economic, as well as politic views. This condition has made West Java as a starting point to control Jakarta socially, economically, and politically. This means that an international firm or organization, either social or profit background, which is expanding to Indonesia should start from West Java.
promising universities in Directory of 50 Promising Indonesian Universities by the General Director of National Education Department. These seven universities are: Bandung Institute of Technology (ITB), Padjadjaran University (UNPAD), Parahyangan University (UNPAR), Maranatha Christian University (UKM), Bandung Poly Technique, STT Telkom, and Pasundan University (UNPAS) (Pikiran Rakyat, 18 August 2007). The development in universities management indicates that the authority holder, which is the government, has great assessment against those seven universities. This needs to be further verified empirically through market perception mapping of those seven universities.
Based on the description above, there are several issues highlighted in this research, such as, 1) What are important factors of universities for new students? 2) How does each university in West Java position itself among new students perception? 3) Are there differences between the positioning expected by universities in West Java with the perception of new students in West Java? The main purpose of this study is to map the position of some universities in Bandung based on senior high school students’ perception.
Literature Review
Drucker (in Kotler, 2000:9) stated that the purpose of marketing is not only to expand sales, but also to identify and understand the consumers in order to deliver products or services that meet the consumers’ needs. Positioning is a marketing strategy, which aims to position the product in the market, especially in the consumers’ minds (Craven, 2001). In addition, Rao and Steckel (1998) and Craven (2001) expressed the importance of consumers perception research, especially related to positioning strategy. One way to explain the organizations positioning is through statements in advertisement or organization motto, such as ”untung pake esia” from PT.Bakrie Telkom, ”bukan telepon biasa” from PT. Telkom Indonesia Tbk, or ”future campus for future business pro” from Widyatama University, Bandung. These statements are expressed to create consumer’s perception against the product offered. Consumer’s perception of a product can be mapped by a statistical technique, which is known as perceptual mapping (Craven, 2001).
Perception is a result of information analysis in a form of stimulus expressed by a company and received by the consumer (Schifman and Kanuk, 1990). Consumer makes choices to purchase based on the value attached to the product and service offered (Kotler and Armstrong, 2001:12). Peter and Olson (2000: 101) described perception as an initial action of the consumer.
Schiffman and Kanuk (2000) define perception as the process by which an individual selects, organizes, and interprets stimuli into a meaningful and coherent picture of the world. The stimuli can be something unconditionally, such as, economic, politic, social, technology, and competition conditions. It may also be something conditionally, such as, marketing mix program, which involves product, price, distribution channel, and promotion (Schiffman and Kanuk, 2000: 161). A company can use marketing mix in order to support its product position in consumers’ perception (Craven, 2000). Therefore, marketing mix has a strong relationship with positioning strategy implemented by the company. Positioning strategy of a company is developed through segmenting-targeting-positioning steps, which is also known as STP process (Craven, 2000).
Market segmentation means dividing a market into different groups of buyers that have different needs, characteristics, or behavior (Kotler and Armstrong, 2001). Market targeting is precedes market segmentation. Market targeting is important since not every part of the market has the same attractiveness (value) to the company. Therefore, company will have to choose the best part/s of the market in order to maximize company’s income. Targeting is an evaluation process of market segment attractiveness, and a selection of one or more market segments (Kotler and Armstrong, 2001: 2850). Following market targeting, the next step is positioning. Kasali (2001: 49) described positioning as a strategy to enter the brain frame of the consumer in order to give certain values of the product/brand/name that define its uniqueness against other product/brand/name in associative terms.
positioning strategy starts with company understands about consumers’ perception to the attributes of the products offered. Therefore, understanding the consumer’s perception of the products’ attributes is very important.
Joseph and Joseph (2000) described that Asian students have becoming more careful as consumers, expecting the best value from the money spent, and becoming more selective in choosing an educational institution. This opinion demonstrates that Indonesian students are likely to become more careful and expecting the best value for the money spent to gain educational services.
Research Design
This research used survey method, a method that explained the relationship between particular variables (with sociology or psychology aspects) in an overall population (Singh, 1986: 361), and proposing questions to a person in a form of written questionnaire (Singarimbun, 1989: 4; Neuman, 2000: 34). This research conducted in two steps, namely:
1. First Steps (Study I), aimed to find model salient believes through dyadic approach, which is a method of analyzing information from two different sources.
2. Second Steps (Study II), aimed to map the positions of eight universities in Bandung by using multi-dimensional scaling approach..
Kohli and Leuthesseur (1993) explained that factor analysis, discriminant analysis, and multi-dimensional scaling (MDS) are three different statistical analysis tools. Factor analysis and discriminant analysis are tools aims to reduce the data through interval scaled ratings method, while in MDS analysis, respondents perform overall similarity judgments. Therefore, MDS becomes more useful when the researcher wants to identify the similarity judgments of the respondents.
Result and Description
Result of Study I
Study I conducted in two phases, namely, qualitative internal consumer analysis, and quantitative external consumer analysis. At the first phase, data collected through convenience sampling, while in the second phase through simple random sampling. Simple random sampling is a sampling method, which gives the least error compared to other sampling method (Sekaran, 2003:97).
Malhotra (2002) mentioned that the minimum number of sample in marketing research is 200 respondents with the average in general between 300 to 500 respondents. On the other hand, Hair,et al.(1998) stated that the minimum number of sample in a research where factor analysis is used is 100, or five times the number of variables. Based on Maholtra (2002) and Hair,et al.(1998), this research appointed 400 Widyatama University’s students as sample for the first phase of study I.
Phase I: Qualitative Analysis
At the first phase, questionnaires distributed to 400 Widyatama University’s students, which conveniently selected. They were asked to answer an open question: “Mention 10 important attributes that a university should posses”. This qualitative analysis research of phase I found out 36 attributes that Widyatama University’s students perceived as important attributes a university should posses, such as student dormitory , affordable fee, comfortable academic service, and comfortable library with complete collection of books.
(Parahyangan University), UNPAS (Pasundan University), UKM (Maranatha Christian University), UNISBA (Bandung Islamic University), STTTEL (Telecommunication Technology Higher Education), STHB (Bandung Law Higher Education), ITENAS (National Institute of Technology) and UTAMA (Widyatama University).
Phase II: Quantitative Analysis
Questionnaires consists of 36 attributes were sent to 2,100 senior high schools students that were randomly selected from seven different cities in West Java. These cities are Bandung, Bogor, Bekasi, Ciamis, Tasik Malaya, Jatitujuh, Kadipaten, and Majalengka. Out of 1,500 returned questionnaires, 1,081 questionnaires answered completely and accepted for further analysis. As suggested by Hair,et al.(1998), factor analysis used to extract the variables of the second phase of Study I.
Factor analysis used to extract the 36 variables. Factor analysis converged into seven factors. The loading of each factor is unique and total cumulative variance explained by the seven components is 52.055%. The seven factors named respectively as campus environment variables, reputation/credibility variables, teaching resources variables, students’ activity facility variables, supporting facility variables, student dormitory variables, and campus facility variables.
Result of Study II
Study II aimed to map the position of eight private universities in Bandung West Java by using Multi-Dimensional Scaling approach. In addition, the authors conducted multistage cluster sampling based on the formula suggested by Sekaran (2003: 293). The process demonstrates that the number of city was rounded off to 5 cities, while the students for each city is 250, which was taken from assumption of the sample proportion of the population was 80% (0.8), therefore the number of students as the sample in each city was: n = (0.8 (1-0.8) (1.96)2 )/ (0.05)2 = 245.8624 which was rounded off to 250 samples.
Multi-Dimensional Scaling (MDS) Analysis
Data analysis by Multi-Dimensional Scaling is based on the concept and technique expressed by Green, et al. (1989), and Cox and Cox (2001). Based on students’ preferences, Multi-Dimensional Scaling (MDS) mapped the positioning of each university. The positioning was mapped based on the seven factors/components (derived from Study I) that should possessed by universities. MDS aimed to map the positioning of eight universities in Bandung based on senior high school students’ perceptions on attributes (factors) as stimulus comparison. The more similar the stimulus in two objects perception compared, the closer those objects to the stimulus. However, the more different the stimulus in two objects, the farther is those objects to the stimulus.
Private University Analysis
a. Distance Matrix
Distance Matrix is a map of research objects, in this case, a map of eight universities in two dimensions, based on respondents’ answers. Since the data were ordinal, this study used non-metric MDS analysis (Green, et al., 1989). Figure 1 shows the position of each university on each dimension, based on average respondents’ answers to the stimulus comparison.
The distance of each object in the map is measured by the Euclidian distance value based on each dimension coordinate in Figure 1. The final coordinates of each object in two dimensions map (Figure 1) are as follows (dimension1, dimension2): itenas (-.419, -.276), sthb (-.484,-.143), ukm (.872,-.350), unisba (-.162,.466), unpar (.660, .482), unpas (-.021,.534), utama (.120, -.750), sttel (-.565, .038). These coordinates resulted from several iterations. In addition, the fit index between the data and the position of each object in Figure 1 shows that the S-Stress value relatively small (0.014), closely to 0. This indicates that the two- dimension map of the eight objects fit to the data (Green, et al., 1989).. Therefore, the position of each of the eight private universities shown in Figure 1 empirically is closer to the truth of the respondents’ perception.
Green, et al. (1989) explained that the map can be divided into four quadrants based on each 0 point of the dimension. These quadrants show different illustrations of respondents’ expectations or perceptions to each object. For example, the top right quadrant, whatever dimension named on the map, shows the ideal expectations or perceptions of the object, since it accounted the highest value of the respondents’ perception of the object evaluated, either for dimension 1 or 2. For instance, in Figure 1, dimension 1 is reputation and dimension two is affordable, thenUNPARwhich is in the top right quadrant has the highest scored for both dimensions, or it means that the respondents perceived UNPAR as the most affordable and reputable private university among the eight private universities analyzed in this research.
Green, et al. (1989) further expressed that the map obtained above is not ideal yet, it should be harmonize with respondent’s preference for each attributes evaluated. The method to obtain the students preference position of eight universities in the map is transformed proximities. On the other hand, the seven attributes position in the map calculated through linear monotonic transformation. The result of the transformed proximities is regression coefficients, which later used as the basis to decide the position of seven attributes (stimulus) against each private universities of Figure 1.
b. Positioning Mapping of Private Universities Based on Seven Attributes Evaluated by Consumers
as the consumers’ perceptions. In this case, the consumers are Senior High School students in West Java. The analysis of each object position (private university) had done based on the Euclidian distance between the attributes and each university. The Euclidian distance method is based on the formula explained by Green, et al. (1989).
c. Positioning Mapping of Private Universities Based on Attribute 1 (Campus Environment)
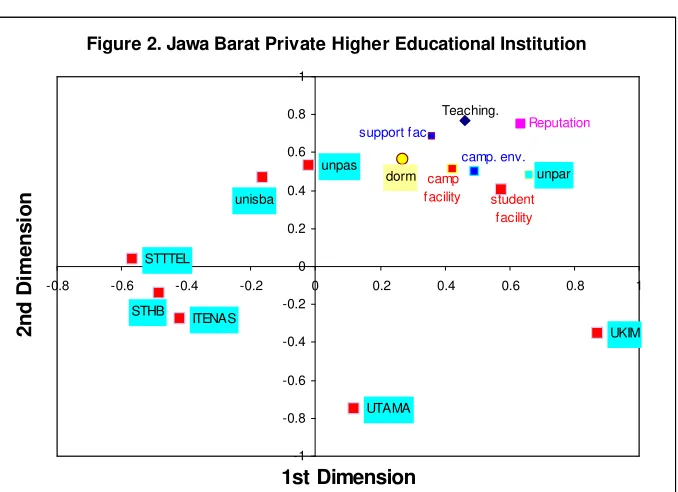
On the upper right of Figure 2 , the position of seven attributes are seen. Those stimulus positions became the basis in calculating the euclidian distance to the eight private universities as the objects analyzed. The smallest euclidian distance indicates the closest stimulus to the university in terms of respondents’ perception. The position of seven stimulus in Figure 2 indicates that UNPAR has the closest distance with the all of campus attributes position in terms of consumers’ perceptions. These figures indicate that UNPAR is seen by the consumers, in this case are Senior High Schools students in West Java, as a campus which has the most ideal in term of seven campus attributes compared to the other seven private universities
Figure 2. Jawa Barat Private Higher Educational Institution
dorm camp
The Positioning of Private Universities in West Java
Figure 1 shows the position map of eight private universities in West Java. The figure shows that some of the eight private universities have close position, which made up two big group, they are UNISBA and UNPAS in one group, and STTTEL, STHB, and ITENAS in another group. On the other hand, UNPAR, UKM, and UTAMA grouped apart from those two big groups.
This finding indicates that potential university’s new students in West Java assumed that UNPAS has a similarity with UNISBA, as well as between STTTEL, STHB, and ITENAS. This finding also indicates the two concentration majors in Senior High School, which are Mathemathic & Natural Science, and Social Studies. The first group represents students with Social Studies major (UNISBA), and the second group represents students with Mathemathic and Natural Science major (ITENAS). Although STHB, a law school, is also in the same group represented Mathemathic & Natural Science students, the respondents may have not known that STHB is a law school, and they thought it might be the same as STTTEL because of the acronym T that stands for technique.
Studies. Based on this analysis, UNPAR is seen as a private university, which has the most ideal management for Social Studies, while STTTEL has the most ideal management for Natural Science and Technique Studies.
Dimension 1 (horizontal axis) is the uniqueness dimension of each university. The closer its position to the right, the more unique is the university, and the closer its position to the left, the less unique is the university. This finding indicates that UKM and Unpar have certain similar uniqueness. Students of UKM and UNPAR are mostly Indonesian Chinese. Furthermore, UNPAR is well known for its school of Economic and Social Politic, while UKM is well known for its school of medicine. The map also revealed that UTAMA has no similarity with either UNISBA group or ITENAS group. It can also be concluded that UTAMA has no uniqueness since the respondents perceived it as being a university with Natural Science Studies, or the respondents might has no knowledge about UTAMA. The finding of Study I justified this argument. The finding of Study I show that UTAMA ranked on the eight ranks (the lowest rank) of the respondents’ top mind ranking.
The discussions above proves that the respondents, Senior High School students in West Java, were able to clearly differentiate variations of universities in West Java, and they already have their options to continue their studies. Figure 1 also demonstrates that some universities have their closest competitor, while the rest do not have or have only a small number of competitors in their categories. For example, UNPAS has a close position (similarity) with UNISBA. This indicates that UNPAS and UNISBA are in the same category in terms of the respondents’ perceptions or evaluations, and probably the reason is that both universities emphasized Moslem values. Actually, UNPAS is not a Moslem basis university, but it is more a strong Sundanese culture university. However, since Sundanese culture has long been related to Moslem culture, the respondents might then perceive it as a Moslem university.
ITENAS closest competitors are STHB and STTTEL. This finding indicates that the respondents had been able to evaluated universities with techniques studies background, although STHB itself is not offers techniques studies.
UNPAR, UKM, and UTAMA are in the position where they almost have no close competitors. These three universities’ positions are apart from the other five universities. This finding demonstrates the uniqueness of these three universities. UNPAR with strong Catholic basis is one of the oldest universities in West Java. UNPAR is clearly perceived differently against the other seven universities. UNPAR recognized also by The General Director of Indonesian National Education Department as one of the 50 promising Indonesian international level universities.
The respondents also uniquely perceive UKM. This is indicated by the position of UKM in Figure 1. UKM’s position is almost similar to UNPAR, which has no close competitors among the eight universities analyzed. UKM’s position shows that as a Christian based university, it has its own image and uniqueness in the respondents mind. It is seen from its position against the horizontal axis, which is on the right side of the 0 value. However, on the vertical axis, UKM’s position is not quite decent. UKM is also recognized by The General Director of Indonesian National Education Department as one of the 50 promising Indonesian international level universities.
UTAMA has a good and unique position similar to UNPAR and UKM. However, UTAMA’s position is not ideal because at the vertical axis, which is the sciences dimension, UTAMA’s position is at the bottom, while its position at horizontal axis is also close to the 0 value. This indicates that UTAMA is not in a unique position as well as not having a clear scientifically characteristic. UTAMA’s motto is “friendly campus for future business pro”. The motto tends to emphasized more on social aspects (friendly campus) not on science aspects. Therefore, it is not surprising if the respondents perceived UTAMA as relatively unique in terms of non-science aspects.
Conclusion, Recommendations, and Limitations
Conclusion
1. This study found out seven dimensions of a university that are essential for potential new students’ perception and evaluation. These dimensions should be considered as the basis in designing marketing programs of the universities in West Java.
2. Private Universities are perceived in groups. This means that there are two or three universities that are seen similarly by potential new students in West Java. Therefore, they are seen as one group of private universities that has similarities in potential new students’ perception in West Java.
3. In relation with university’s vision and mission analyzed, the uniqueness perceived shows the expected position of each university. For instant, UNISBA and UNPAS are seen as similar, because their vision and mission are also similar, which is emphasizing on Moslem values.
4. The third point above indicates that potential new students in West Java have strong references to primordial values, in this case is religion, used in evaluating and perceiving the services they are about to choose, especially in choosing private universities. This is supported by the position of UNPAR and UKM that have different missions, as well as UTAMA which has no religion-based missions are being perceived differently from other universities with religion driven missions.
5. Derived from the potential new students’ perception of private universities based on seven dimensions obtained in Study I, this study found out that there is only one ideal university in the respondents’ mind, which is UNPAR. The euclidian distance of 6 from seven dimensions for UNPAR is the highest among the other universities. However, UNPAS perceived as the best university in terms of campus dormitory.
Recommendations
There are several suggestions of this research, namely,
1. The seven dimensions evaluated and perceived by potential new students in West Java can be used as the basis in managing attributes for both public and private universities in West Java.
2. For university management from outside West Java, both domestic and overseas, who are willing to affiliate with universities in West Java, can use these seven dimensions as an evaluation tool.
3. University management from outside West Java, both domestic and overseas, who are willing to start a career in universities in West Java, should consider the primordial values, like religion, because these values are used in evaluating a university, especially private university.
4. Private University management, except for UNPAR, should develop the seven important dimensions evaluated and perceived by potential new students in West Java.
Limitations
There are several limitations in this study, namely:
1. Potential new students were probably unable to evaluate, in terms of comparing eight private universities above, since they had never used the service of those universities before. However, this limitation was coped with question number 1 and 2 in the questionnaire that ask the respondents about the difference of the universities in general.
2. Object evaluated, in this case private universities, have no similar condition to compare, for example, STHB with UNPAS, and UNPAR with UTAMA. STHB and UNPAS have specific characteristics, therefore attribute 1 (campus environment) and attribute 3 (reputation) were not comparable. However, the respondents were supposed to compare those universities.
limitation has been minimized through sample adequacy test, and the total variance that could explain the factors extracted in data processing of factor analysis.
References
Berkman, H. W., and C. Gilson (1986),Consumer Behavior: Concepts and Strategies, Kent Publishing Company, Boston
Cox, T.F. and M.A.A. Cox (2001),Multidimensional Scaling,second edition, Chapman & Hall / CRC, Boca Raton.
Craven, D. W. 2003.Strategic Marketing. New York, McGraw Hill.
Day, G. S. & D. B. Montgomery (1999), “Charting New Directions for Marketing,”Journal of Marketing,Vol.63 (Special Issues), 3-13.
Day, G. S., and R. Wensley (1988), “Assessing Advantage: A Framework for Diagnosing Competitive Superiority,”Journal of
Marketing,Vol.52, April, 1-20.
Florida International University (FIU),Research Report2002-06 Student satisfaction Survey, Spring, Miami Florida, www.fiu.edu/opie/cqis/index.htm
Gilly, M.A., J.L. Graham, M. F. Wolfinbarger, L. J. Yale (1998), “A Dyadic Study of Interpersonal Information Search,”
Journal of the Academy of Marketing Science, Volume 26, No.2, pages 83-100
Green, P.E., F.J.Carmone, and S.M. Smith (1989),Multidimensional Scaling: Concepts and Applications,Allyn and Bacon,
Boston.
Hair, F. J., R.E. Anderson, R.L. Tatham, W. C. Black (1998).Multivariate Data Analysis Fifth Edition. New Jersey, Prentice Hall.
Joseph, M. And Joseph, B. (2000), “Indonesian Students’ perceptions of choice criteria in the selection of a tertiary institution: strategic implications,”The International Journal of Education Management, 14/1, 40-44
Kasali, R. (2001).Membidik Pasar Indonesia “Segmentasi, Targeting, Positioning, Gramedia, Jakarta.
Kim, J., and C.W. Mueller (1994),”Introduction to Factor Analysis: What It Is and How to Do It,” in Michael S. Lewis-Beck,
Factor Analysis and Related Techniques,Sage Publications, Singapore.
Kim, L. And H. Lee (1997),“Development of Family Triadic Measures for Children’s Purchase Influence,”Journal of
Marketing Research,Vol.XXXIV (August), 307-321
Kohli, C., and L. Leuthesser (1993). “Product Positioning: A comparison of perceptual mapping techniques,”The Journal of Product and Brand Management, vol.2, Iss4; Pg.10
Kotler, P. (2002).Marketing Management. The Millenium Edition, Prentice Hall, Upper Saddle River, New jersey.
Malhotra (2002),Marketing Research, Prentice Hall, New Jersey
Neuman, W. L. (2003),Social Research Methods: Qualitative and Quantitative Approaches, Allyn and Bacon, Boston
Pikiran Rakyat, Harian Umum, 14 Juni 2004.
Pikiran Rakyat, Harian Umum, 18 Agustus 2007
Rao, V.R. And J. H. Steckel (1998),Analysis for Strategic Marketing,Addison-Wesley, Reading, Massachussets.
Schiffman, L. G. and L. L. Kanuk (2000),Consumer Behavior, Prentice Hall International, Inc., Upper Saddle River, New Jersey.
Sharma, S. (1996),Applied Multivariate Techniques,John Wiley & Sons, New York.
Singarimbun, M. dan S. Effendi (1989),Metode Penelitian Survai, LP3ES Jakarta
Singh, A. K. (1986),Tests Measurements and Research Methods in Behavioral Sciences, Tata McGraw-Hill Publishing
Company Limited,New Delhi
Zaltman, G., and M. Wallendorf (1979),Consumer Behavior: Basic Findings and Management Implications,JohnWiley &