A FUZZY AUTOMATIC CAR DETECTION METHOD BASED ON HIGH RESOLUTION
SATELLITE IMAGERY AND GEODESIC MORPHOLOGY
N. Zarrinpanjeh a, *, F. Dadrassjavan b
a Department of Geomatics Engineering, Qazvin Branch, Islamic Azad University, Qazvin, Iran - [email protected] b School of Surveying and Geospatial Engineering University College of Engineering University of Tehran - [email protected]
KEY WORDS: Car Detection, Fuzzy Inference System, Geodesic Morphology, Satellite Imagery
ABSTRACT:
Automatic car detection and recognition from aerial and satellite images is mostly practiced for the purpose of easy and fast traffic monitoring in cities and rural areas where direct approaches are proved to be costly and inefficient. Towards the goal of automatic car detection and in parallel with many other published solutions, in this paper, morphological operators and specifically Geodesic dilation are studied and applied on GeoEye-1 images to extract car items in accordance with available vector maps. The results of Geodesic dilation are then segmented and labeled to generate primitive car items to be introduced to a fuzzy decision making system, to be verified. The verification is performed inspecting major and minor axes of each region and the orientations of the cars with respect to the road direction. The proposed method is implemented and tested using GeoEye-1 pansharpen imagery. Generating the results it is observed that the proposed method is successful according to overall accuracy of 83%. It is also concluded that the results are sensitive to the quality of available vector map and to overcome the shortcomings of this method, it is recommended to consider spectral information in the process of hypothesis verification.
* Corresponding author
1. INTRODUCTION
Since the advent of High Resolution Satellite Imagery (HRSI) and the spread of satellite image acquisition systems, researchers have been enthusiastic in finding approaches to use information from these sources to detect and recognize objects. The number of detectable objects in satellite images, have increased due to the improvements in spatial and spectral resolutions in recently developed satellite systems. Cars are of the most desired items for object recognition which are found noticeable inspecting urban areas in many aspects such as traffic monitoring and road extraction (Hinz, 2005). The problem of computing the number of cars passing a route is important to be solvable in all passages throughout the city while direct systems are only available on major roads. On the other hand, solving the problem of road extraction is fortified when violating objects such as cars at the road scene are detected and removed. Cars are detectable using both aerial and also satellite images. In aerial images cars are usually reflected into rectangular regions with 13-26 pixels in length and width(with respect to image scale), but in 0.5 meter Ground Sample Distance (GSD) satellite imageries, cars are reflected as 9×5 pixel objects (Eikvil, 2009).
Car detection from scanned aerial images was firstly studied and practiced before any attempt to extract cars from HRSI was made (Hinz, 2005). In such approaches each pixel usually has 0.15 meter GSD in average. These approaches either use implicit or explicit vehicle models. The appearance-based implicit model uses sample images of vehicles to derive grey-value or texture features and their statistics assembled in vectors. These vectors are used as reference to test computed feature vectors from image regions. In addition, training images
of cars are extracted and introduced. Then, through computing some distinguishing features, the classification process is performed and cars are extracted. Approaches using an explicit model, describe vehicles in 2D or 3D by filter or wire-frame representations. The model is then matched "top-down" to the image or extracted image features are grouped "bottom-up" to create structures similar to the model. A vehicle is detected, if there is sufficient support of the model in the image (Hinz, 2005).
Regarding to HRSI and their specific resolutions, spatial and grey value features are extracted for car detection and manual/automatic classification solutions are studied and overall performance of the approach is evaluated (Eikvil, 2009). In another study, spot detectors are used to extract car hypotheses and considering vector map of the region and objects’ direction, true car hypotheses are verified (Stilla, 2004). An encouraging approach for single vehicle detection uses morphological filtering to distinguish between vehicle pixels and similar non-vehicle pixels (Michaelsen, 2001). This approach achieves high completeness and correctness but is not able to extract vehicles in queues or parking lots. Moreover, some thresholding approaches are also tested for car detection using HRSI (Jin, 2004).
In some recent researches vehicle detection is done using high-resolution aerial images through a fast sparse representation
classification method and a multi order feature descriptor that contains information of texture, colour, and high-order context. To speed up computation of sparse representation, a set of small dictionaries, instead of a large dictionary, containing all training items, is used (Chen, 2016). Vehicle detection is also practiced using a probabilistic classification method followed by a The International Archives of the Photogrammetry, Remote Sensing and Spatial Information Sciences, Volume XLII-4/W4, 2017
Tehran's Joint ISPRS Conferences of GI Research, SMPR and EOEC 2017, 7–10 October 2017, Tehran, Iran
This contribution has been peer-reviewed.
refinement, based on object segments using registered aerial RGB images and airborne LiDAR data. Pixel-wise vehicle probability estimation is achieved using Gaussian process (GP) classification and object segments are obtained by applying a gradient based segmentation algorithm (GSEG)(Liu, 2016). In this paper, morphological operators and more specifically, Geodesic dilation for the purpose of car detection are introduced and tested. In the next sections, introducing Geodesic dilation, the proposed car detection approach is explained. Then, using sample satellite images and vector maps the proposed method is developed and tested and finally, the results of the study are discussed.
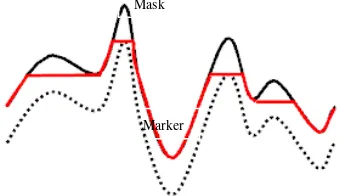
2. GEODESIC MORPHOLOGY FOR CAR DETECTION Mathematical morphology is a tool for extracting image components that are useful in the representation and description of region shape such as boundaries and convex hull (Gonzalez 2003). Geodesic dilation is one of the processing that seems to be useful for robust car detection. Morphological Geodesic dilation employs two input image known as marker and mask images. Both images must have the same size and the mask image must have intensity values greater or equal to the marker image. The marker image is dilated by an elementary isotropic structuring element and the resulting image is forced to remain below the mask image (Arefi 2005). In equation 1 the marker image is denoted by J and the mask image by I. The Geodesic dilation of size 1 of the marker image J with respect to mask image I is defined as
(1)
In this equation ^ stands for the point-wise minimum operation between the dilated marker image and the mask image and J B is the dilation of J, using the elementary isotropic structuring element B. The Geodesic dilation of size n of the marker image J with respect to a mask image I is obtained by performing n successive Geodesic dilations of size l of J with respect to I (Arefi, 2005).
(2) The desired reconstruction is achieved by carrying out Geodesic dilations until stability is reached. In other words, this process can be thought of as repeated dilations of the marker image until the contour of the marker image fits under the mask image. When further dilations do not change the marker image any more, the iterative process is finished (Arefi, 2005).
Figure 1. Mask and marker images in Geodesic dilation.
3. CAR DETECTION BASED ON GEODESIC DILATION
As previously mentioned this paper is dedicated to detection and recognition of cars based on HRSI and roads vector maps using morphological operators. The flowchart of the proposed method is presented in figure 2.
At the first layer of processing, roads are extracted overlaying vector map and HRSI. Therefore, nodes from vector map are projected to the image and pixels under each road segment is extracted. Although sometimes available maps are not updated or may suffer from some geometrical distortions to avoid distractions from the basic goals of this research road maps are assumed to be error free.
Figure 2. The flowchart of the proposed method.
At the next step, Geodesic dilation is applied on the image of each extracted road. Thresholding the results, candidate car pixels are extracted. Then, as cars are supposed to be recognized by the shape and size in this specific study, the results of the previous process should go through segmentation to label each connected candid pixels into candid regions to be evaluated and verified in the final step of processing.
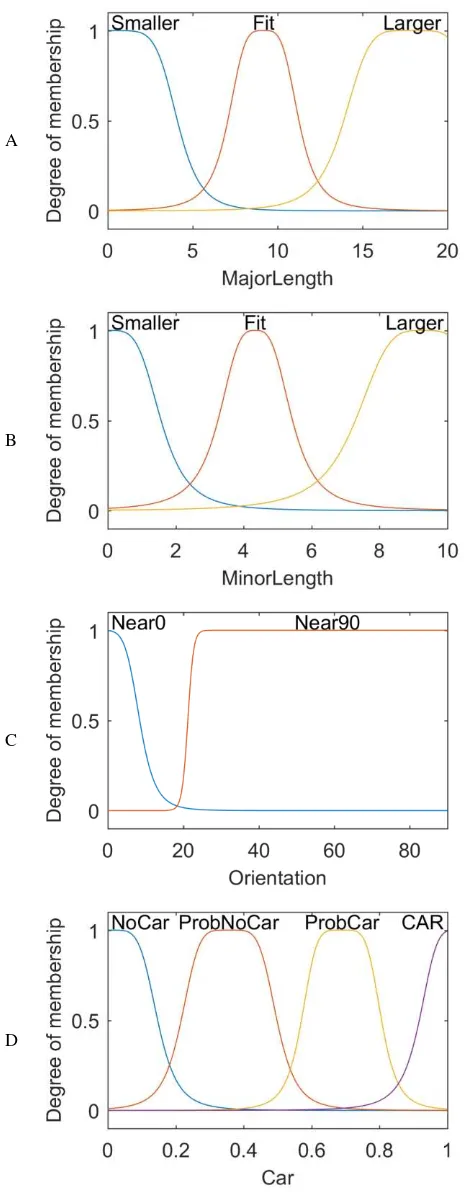
At the final step, the labelled regions are introduced to a fuzzy decision making engine to evaluate and verify regions which are assumed to be car items. This can take place according to the shape features and intensity values of each region. This process is established through inspecting three main shape features of each region; major and minor axes and orientation. As it is predicted, a car has a specific size with respect to sensor GSD and is supposed to lie towards specific orientation considering centreline axis direction of the road. Using a fuzzy solution, car hypothesis verification is performed. The mentioned fuzzy solution takes shape features as input variables and produces the possibility of true detection as output. Input and output parameters, linguistic variables and labels in depicted in Table 1. Fuzzy membership functions of the input and output Marker
Mask
variables are depicted in figure 3. The defined rules for the fuzzy inference system are listed in Table 2.
A
B
C
D
Figure 3. a) Membership function of Major axis length of the region. b) Membership function of Minor axis length of the region. c) Membership function of Orientation of the major
axis. d) Membership function of output Car. Table 1. Linguistic variables and labels for the designed Fuzzy
Inference system.
Linguistic variable Linguistic Labels Input #1: Major Length Smaller- Fit- Larger Input #2: Minor Length Smaller- Fit- Larger Input #3: Orientation Near 0 – Near 90
Output: CAR NoCar-ProbNoCar-ProbCar-Car
Table 2. Fuzzy rules for candidate car verification. Rules
1. If (MajorLength is Fit) and (MinorLength is Fit) then (Car is CAR) (1)
2. If (MajorLength is Smaller) and (MinorLength is Fit) and (Orientation is Near0) then (Car is ProbCar) (1)
3. If (MajorLength is Larger) and (MinorLength is Fit) and (Orientation is Near0) then (Car is ProbCar) (1)
4. If (MajorLength is Fit) and (MinorLength is Smaller) and (Orientation is Near0) then (Car is ProbCar) (1)
5. If (MajorLength is Fit) and (MinorLength is Larger) and (Orientation is Near0) then (Car is ProbCar) (1)
6. If (MajorLength is Smaller) and (MinorLength is Smaller) and (Orientation is Near90) then (Car is NoCar) (1)
7. If (MajorLength is Larger) and (MinorLength is Larger) and (Orientation is Near90) then (Car is NoCar) (1)
8. If (MajorLength is Smaller) and (MinorLength is Larger) and (Orientation is Near0) then (Car is ProbNoCar) (1) 9. If (MajorLength is Larger) and (MinorLength is Smaller) and (Orientation is Near0) then (Car is ProbNoCar) (1) 10. If (MajorLength is Fit) and (MinorLength is Fit) and (Orientation is Near90) then (Car is ProbCar) (1)
11. If (MajorLength is not Fit) and (MinorLength is Fit) and (Orientation is Near0) then (Car is ProbCar) (1)
12. If (MajorLength is Fit) and (MinorLength is not Fit) and (Orientation is Near0) then (Car is ProbCar) (1)
13. If (MajorLength is Smaller) and (MinorLength is Smaller) then (Car is ProbNoCar) (1)
14. If (MajorLength is Larger) and (MinorLength is Larger) then (Car is ProbNoCar) (1)
15. If (MajorLength is Smaller) then (Car is ProbNoCar) (1) 16. If (MajorLength is Larger) then (Car is ProbNoCar) (1) 17. If (MinorLength is Smaller) then (Car is ProbNoCar) (1) 18. If (MinorLength is Larger) then (Car is ProbNoCar) (1)
4. IMPLEMENTATION AND RESULTS
To inspect the capabilities of the proposed method for car detection using HRSI, it is implemented and tested using GeoEye-1 pan-sharpen satellite image of urban area in the city of Tehran. The road map of roads of the corresponding region is also available at the scale of 1:2000. The overlaying road map and satellite image road regions with respect to each element in the map are extracted. The test data set and overlaid vector map are presented in figure 4.
As experimented, a number of 208 road segments are individually located and extracted in the test dataset. In figure 5, a sample extracted road segment from satellite imagery is illustrated. The main achievement of this process could be summarized in minimizing the search space for car detection as it is not expected to find cars in non-road regions. This directly reduces the number of candidate cars in non-road regions which have higher possibility of being rejected during the verification process. From another point of view it is important to detect cars in the region near roads and streets usually according to the cardinal goals of car detection such as traffic monitoring. The International Archives of the Photogrammetry, Remote Sensing and Spatial Information Sciences, Volume XLII-4/W4, 2017
Tehran's Joint ISPRS Conferences of GI Research, SMPR and EOEC 2017, 7–10 October 2017, Tehran, Iran
This contribution has been peer-reviewed.
Figure 4. Satellite image and overlaid vector map.
Figure 5. Extracted road segments.
Each extracted road segments are then inspected for car primitives. Geodesic dilation is applied on each segment of extracted roads. The extracted image is considered as mask and therefore reduced smoothed image is considered as marker. Then, Gaussian smoothing filter is applied on the image and digital number of each pixel is reduced by 50 values to generate marker image in 11 bit depth satellite image. Geodesic dilation is repeatedly applied until the results reach stability. The results of Geodesic dilation are presented in figure 6. Thresholding the results, with a threshold set to 30% of the maximum peak, pixels which have high probability of being a car item are marked. To reduce noise, the resulted thresholded image is morphologically closed by a 3x3 structure element.
The resulted candidate pixels are then checked with eight neighbour connectivity and connected elements are labelled, so car primitives are generated. Shape properties of each labelled region is computed and in accordance with data resolution optimum size and direction of objects are extracted and inserted into a fuzzy system via membership functions and rules to provide the capability of car hypothesis verification. The results of each stage of this process is depicted in figure 6.
a
b
c
d
e
Figure 6. a) The results of Geodesic dilation on test image b) Thresholding of the Geodesic Dilation, c) Closed Geodesic dilation by a
3x3 isotropic structure element, d) Results of segmentation and labelling and candidate car items generation. e) Verified car items.
Table 3 demonstrates the final results of car detection through confusion matrix. Considering the mentioned confusion matrix the overall accuracy of 83.38% is achieved.
Table 3: Confusion matrix of the proposed car detection.
Car No car Sum Commission Error
Car 270 7 277 2.52
No Car 51 21 72 70.83 Sum 321 28 349
Omission
Error(%) 15.88 25
4.1 Discussions
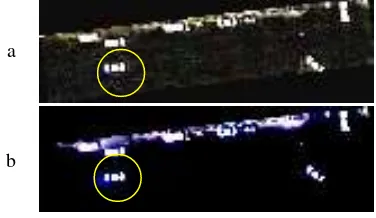
The followings briefly address the benefits, problems, achievements and shortcomings of the proposed method: Geodesic dilation presents less redundant results in comparison with classic morphological operations such as top-hat filtering in terms of extracting primitives. As depicted in figure 7, road surface is covered by noise in Top-hat filtering while on the other hand the surface of the road is entirely removed and only car or some similar other objects remained. In addition, the effect of moving cars in Geodesic dilation image is vividly visible while no trace of such object is detectable in classic Top-Hat filtering. This means that detecting moving cars is potentially applicable through Geodesic dilation.
a
b
Figure 7. Comparison of Top Hat with Geodesic dilation.a) Top-Hat filtering results. b) Geodesic dilation results.
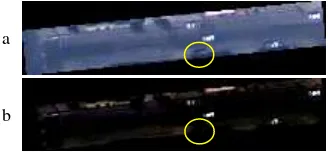
The proposed car detection method is successful in marking objects making high grey value contrast to road surface. In other The International Archives of the Photogrammetry, Remote Sensing and Spatial Information Sciences, Volume XLII-4/W4, 2017
words, in case of detecting dark cars an increase in the rate of errors is observed. This usually happens when car region is not acquired completely due to low luminance or shades as shown in figure 8.
a
b
Figure 8. Dark cars are missed due to low illumination. a)Test image. b) Missed Car.
Car detection is weak when non-road areas are inspected. As a matter of fact, there are many similar objects to items when building or bare-land areas are inspected. This indicates that using cars for detecting roads from building regions is not recommendable. As depicted in figure 9, it is observed that efficient car detection is closely bounded to how updated and accurate the geometric information from vector map is. Car detection is not conducted appropriately if road regions are mistakenly chosen.
a
b
Figure 9. False car detection due to investigating non-road areas. a)Mistakenly extracted road. b) Mistakenly extracted car pixels.
As each road has its specific width, the extraction of search area should be accomplished with respect to each roads specific width range. As illustrated in figure 10, the absence of compatibility between search area and road width, non-road areas would be inspected and car detection would inevitably results in false hypothesis verification. Therefore the existence of a GIS ready vector road map with enriched attribute would facilitate true car detection.
A
b
Figure 10. False hypothesis verification due to road width incompatibility.
5. CONCLUSIONS
In this paper, it is attempted to inspect and develop an automatic car detection technique based on HRSI using Geodesic morphology. The proposed method is successful in automatic car detection when cars are vividly noticeable and brightly detectable and also when vector map accurately locates roads. For a more robust detection of cars, it is recommended to use Spectral information to make more robust distinguishes between car and non-car objects. This can be inserted to the fuzzy engine when car primitives are being evaluated. An updated road map helps more robust car detection. Therefore implication of an updated vector map is recommended.
REFERENCES
Arefi, H., Hahn, M., 2005. A morphological reconstruction algorithm for separating off-terrain points from terrain points in laser scanning data. In: Proceedings of the ISPRS Workshop Laser Scanning”, 2005, pp. 120-125.
Chen, Z., Wang, C., Luo, H., Wang, H., Chen, Y., Wen, C., Yu, Y., Cao, L. and Li, J., 2016. Vehicle Detection in High-Resolution Aerial Images Based on Fast Sparse Representation Classification and Multiorder Feature. IEEE Transactions on Intelligent Transportation Systems, 17(8), pp.2296-2309.
Eikvil, L., Aurdal, L., Koren, H., 2009. Classification-based vehicle detection in high-resolution satellite images. ISPRS Journal of Photogrammetry and Remote Sensing, 64(1), pp. 65-72.
Gonzalez, R. C., Woods, R. E. , 2003. Digital Image Processing. Second. Edition.
Hinz, S., 2005. Detection of vehicles and vehicle queues for road monitoring using high resolution aerial images”, In: The 9th World Multiconference on Systemics, Cybernetics and Informatics July 10 - 13, 2005
Jin, X., Davis, C.H., 2004. Vector-guided vehicle detection from high resolution satellite imagery. In: Geoscience and Remote Sensing, Symposium, IGARSS '04, Proceedings 2004 IEEE International , Vol. II, pp.1095 -1098.
Liu, Y., Monteiro, S.T. and Saber, E., 2016, July. Vehicle detection from aerial color imagery and airborne LiDAR data. In Geoscience and Remote Sensing Symposium (IGARSS), 2016 IEEE International, pp. 1384-1387
Michaelsen, E., Stills, U., 2001. Estimating Urban Activity on High-Resolution Thermal Image Sequences Aided by Large Scale Vector Maps. In: IEEE/ISPRS Joint Workshop on Remote Sensing and Data Fusion over Urban Areas, pp. 25 – 29.
Stilla, U., Michaelsen, E., Soergal, U., Hinz, S., Ender, HJ., 2004. Airborne Monitoring of vehicle activity in urban areas. In: Altan MO (ed) International Archives of Photogrammetry and Remote Sensing, pp. 973-979.
The International Archives of the Photogrammetry, Remote Sensing and Spatial Information Sciences, Volume XLII-4/W4, 2017 Tehran's Joint ISPRS Conferences of GI Research, SMPR and EOEC 2017, 7–10 October 2017, Tehran, Iran
This contribution has been peer-reviewed.