Regret and Topical Accounting: Is Cyclical Bidding
the Bases of the Laboratory
Winner’s Curse?
1Rahmat Hidayat2
Faculty of Psychology Universitas Gadjah Mada
Abstrak
Penelitian ini menguji pengaruh siklus pengambilan keputusan pada penawaran individu dalam eksperimen lelang. Eksperimen sebelumnya melibatkan proses pelelangan yang terdiri atas sejumlah sesi dalam jangka waktu yang relatif singkat, dimana informasi tentang nilai sebenarnya dari objek yang dilelang diberikan secara langsung, sehingga jumlah dana yang dipegang oleh peserta lelang dapat disesuaikan seketika. Kemenangan dan kekalahan dalam sebuah lelang dapat menimbulkan emosi positif dan negatif. Karena orang memerlukan waktu untuk menyesuaikan diri dengan penga-laman afektif, siklus keputusan dalam eksperimen dapat berpengaruh dalam keputusan individu pada penawaran berikutnya. Hipotesa yang diajukan adalah bahwa penyesalan dan akuntansi mental dapat menjelaskan arah dari anomali dalam keputusan tersebut. Penyesalan atas kegagalan untuk bertindak dalam putaran tender sebelumnya akan menaikkan tingkat pengambilan resiko pada babak berikutnya; dan akuntansi topikal lebih mendominasi pengambilan keputusan daripada akuntansi minimal dan akuntansi komprehensif. Selain itu, reference dependence utility menyebabkan prefensi resiko berbeda-beda sesuai dengan konteks pengambilan keputusan: risk-seeking dilakukan ketika mengalami kerugian, sementara risk-aversion dilakukan setelah mendapatkan keuntungan. Secara umum penelitian ini mendukung dugaan-dugaan tersebut. Subjek menjadi lebih agresif setelah mengalami kerugian dalam tahap sebelumnya. Sementara penyesalan dapat diamati pada subjek yang mengajukan penawaran kedua tertinggi ketika aspek winner’s curse tidak manifes, dana spek penyesalan ini menyebabkan naiknya penawaran pada putaran berikutnya. Akibatnya regret menyebabkan subjek menjadi korban winner’s curse. Pada aspek psikologis, akuntansi topical teramati lebih banyak dilakukan individu dari pada akuntansi komprehensif. Temuan ini
berimpli-kasi keraguan atas validitas klaim adanya fenomena winner’s curse dalam eksperimen lelang.
Keywords: mental accounting, decision making, bidding behaviour.
Although1the evidence of the winner’s
curse has appeared robustly in a variety of
1 This paper is based on the master’s thesis that the
author submitted in 2002 to the University of Exeter. The author acknowledge the contribution of Prof. Dr. Paul Webley during the preparation of the research. The responsibility for the accuracy of analysis and the overall quality of the paper is the sole responsibility of the author.
2 Correspondence should be addressed to: r.hidayat
@ugm.ac.id
ex-perts argue that such data allow many in-terpretations, and the winner’s curse is just one of them (Roth, 1995). On the other hand, the unanimous claim from many laboratory experiments has been responded by some experts with critical views towards the validity of the design of experiments. In short, the winner’s curse is still largely per-ceived as an anomaly which does not gen-eralise outside the laboratory
Criticisms of experimental studies have mostly been addressed at the appropriate-ness of the subjects of experiment. As a matter of fact, students whom apparently have little real world experience in doing auctions have been the most frequently employed in research. Therefore, the find-ings that inexperienced bidders were sus-ceptible to the winner’s curse (Kagel & Levin, 1986) turns to suspicion about the validity of the claim. In addition of being inexperienced, novice bidders in those ex-periments were given limited liability for losses and were operating at low cash bal-ance (Hansen & Lott, 1991). The combina-tion of lack of experience, inadequate con-trol over sub-optimal actions, and low per-ceived significance of the task that pre-ceded the observed winner’s curse may actually mean that it is simply a phenome-non of college students working on a “toy problem” (Thaler, 1992)
In view of the debate, proponent of the
winner’s curse have responded with refined
studies to accommodate elements of the criticisms, in one and another way. The experience factor has been controlled by running the experiment in two stages, in which only successful bidders in the first stage played the second one (Kagel & Levin, 1986). An alternative approach has been to recruit business executives as the experiment subjects (Dyer, Kagel & Levin, 1989). These studies concluded that al-though bidders’ susceptibility to the
win-ner’s curse decreased with the accumulation
of experience, the error was not eliminated completely. Relatively experienced bidders were found to commit errors in making judgement about the value of the object, even when the availability of public infor-mation was increased (Kagel & Levin, 1986), and even when they are operating at
a private value auction (Kagel, Harstad &
Levin, 1987).
The persistence of judgement errors across different experimental manipula-tions gives raise to a suspicion that the anomaly might not be caused by error in probabilistic judgement, but by some men-tal illusion (Thaler, 1992) that was elicited accidentally by the design of experiments. As a matter of fact, most auction experi-ments can be easily distinguished from one and another, except on the procedure of experiment. Most experiments involved an auction event that consists of several ses-sions with a relatively short duration, in which a feedback about the true value of the object was given instantly, and bidders’ cash balance were adjusted promptly. During the experiment subjects were con-ditioned to perform a cycle of tasks that consists of receiving and analysing infor-mation, submitting a bid, discerning feed-back about the true value of the object, and calculating their profit or loss. All of these must be done in a timely sequence that consists of 20 or so repetitions, within 2 hours or so.
anomaly in itself. It is plausible, therefore, to ponder a seemingly weird idea that this structural anomaly may actually breed anomalous behaviour among subjects of experiments.
Affective Experience and Decision-Making A bidding event imposes gains and loses to every bidder (McAfee & McMilan, 1987). Both of these states of nature have widely been known to induce sensations and emotions among individuals that in turn gives intrinsic value to the individual (Kusser & Spohn, 1992). Hence, two aspects of utility actually emerge from a bidding event: the objective outcome of winning or losing that is measured in monetary equal units and the subjective experience of satis-faction or anguish. While the former has been considered thoroughly in decision-making theory, very little attention has been given to the latter.
The reason for the ignorance is that that because utility is treated as a unitary concept in standard economics and deci-sion-making theory (Luce & Raiffa, 1957; Coombs, Dawes & Tversky, 1970). It is as-sumed that an individual chooses A over B because the utility of A exceeds that of B, and thus we can assign any two unequal numbers to represent all necessary infor-mation about the difference of utility among them. In contrast, behavioural deci-sion-making theorists, such as Kahneman and his associates, argue that decision util-ity and experienced utilutil-ity are two different matters (Kahneman & Tversky, 1984; Kahneman, Waker & Sarin, 1997). In con-ceptual terms, decision utility is defined as the post-hoc inference of the weight of an outcome of a decision, while experienced utility referes to the utility that is actually experienced by decision makers when they consume or experience what they have chosen. Experienced utility captures the
hedonic quality of a decision, that is the degree of pleasure or pain, satisfaction or anguish in the actual experience of outcome.
One aspect of experienced utility is its temporal dimension. Pleasure and dis-pleasure are attributes of each moment of experience, but the outcomes that people value are normally extended over time. Two descriptive notions of experienced utility are thus instant utility, the pleasure or distress of the moment, and remembered utility that is the retrospective evaluation of a temporally extended outcome (Kahne-man, Waker & Sarin, 1997). The adaptive function of instant utility is to signal to the individual whether or not to take action in a particular moment based on, in most situations, the biologically programmed response choice. A pleasure sensation would normally signal a ‘go’ to the organ-ism to continue the activities, while pain signals a ‘stop’.
The other dimension is the intensity of the affective experience. The experience of pleasure and pain are different in quality, as well as the experience of joy or distress in different occasions. This dimension gives raise to the important of remembered util-ity (Kahneman, Waker & Sarin, 1997), that is, the utility of an experience as recalled by the decision maker after it has occurred (Read & Loewenstein, 1999). In general, higher intensity of the experience leads to longer retention in individuals’ cognition. However, remembered utility is not only a function of intensity. Distractions within the elapsed time played significant role in the elicitation of experienced utility (Read & Loewenstein, 1999).
affec-tive experience of the previous occasion. Subsequently, it will influence her func-tioning in the forthcoming event. The stronger intensity of affective experience would normally require longer period of adjustment. However, the direction to which an affective experience influences individual, positively or negatively, de-pends on the type of experience.
Among others, the impact of regret on decision-making is one of most widely re-searched. Regret is a negative, cognitively based emotion that we experience when realising or imagining that our present situation would have been better, had we decided differently (Zeelenberg, 1999). In other words, regret constitutes a special form of frustration in which the event one would change is an action one has either taken or failed to take. Two state of events thus associated with regret, the one being frustration that is felt over the failure of an action. One may become frustrated by the thinking of another way that he could have taken that would have given him a better result. Regret also occurs following a failure of acting something that lead to a better condition or prevent an adverse situation had the one done in the time. Research shows that the regret associated with fail-ures to act is often less intense than the re-gret associated with the failure of an action (Kahneman & Tversky, 1982). In addition, anticipated regret can promote risk-averse as well as risk-seeking choice (Zeelenberg, 1999).
Consider the following hypothetical event: Dick and Fred are competing in an experimental bidding session along with some other bidders. In a particular session, they realised that in the previous session, where they had both lost, the bid item was of considerably higher value. If Dick real-ised that his bid was the second highest, with a narrow difference from the winner,
and Fred’s was among the lowest bids, we could ask ourselves of who had more in-tense regret. Subsequently, we could imagine how they would bid on the next session and predict who would take more risks.
Hiphothesis 1: In the absence of the win-ner’s curse, in the subsequent round, the second highest bidder of the previ-ous round bids higher than the lowest bidders of the previous round.
Mental Accounting
One of the cornerstones of optimal bidding theory is the assumption of bid-ders’ risk- neutrality and the linear utility of bids. Further, each bidder is assumed to estimate other bidders’ valuations as being drawn from a rectangular distribution that consists of vi, …, vn, in which any point in
the F(v,) has similar probability of being the true value. The probability of winning the auction, given bi, is then the function of
the probability that biis highest among
oth-ers, that is Fn-1(bi) (Milgrom & Weber, 1982;
McAfee & McMilan, 1987). These assump-tion are formulated because they are re-quired for a simple solution of optimal bid-ding, not because they capture the natural process of bidding. The optimal bidding follows such a description. Given that bid-ders are behaving noncooperatively, the optimal strategy for each bidder is to bid as much as his valuation of the object, bi=b(vi).
If this strategy is adopted by all bidders but one, the latter’s best response is to adopt it also (Riley & Samuelson, 1981). The end result is that the auction consists of optimal bids by bidders who think optimally.
the carrier of the utility of a choice is change from a reference point rather than over the state of wealth (Kahneman & Tversky, 1984; Tversky & Kahneman, 1991; Bateman et al., 1997). From the reference dependent utility, it follows that people are loss averse more than risk averse (Tverky & Kahneman, 1991; Kahneman & Tversky, 1982), their decision are susceptible to the framing of choice (Tversky & Kahneman, 1981; Tversky & Kahneman, 1986; Johnson et al., 2000), and weigh chance differently between different points of probability (Tversky & Fox, 1995). These violations of expected utility theory may explain the in-ternal process of the winner’s curse.
Tversky and Kahneman (1981) and Kahneman and Tversky (1984), refined by Thaler (1999), propose a construction of mental processes whereby individuals eva-luate their financial-related decisions, from which they specify the advantages and disadvantages associated with the options relative to a reference point. This represen-tation, termed mental accounting, refers to the set of cognitive operations used by individuals to organise, evaluate, and keep track of their decisions. They propose three different types of mental accounts that can be used by the individual: minimal account,
topical account, and comprehensive account
(Thaler, 1999). Under minimal account, the utility of decision is calculated from the difference between any two or more op-tions, disregarding the features they share, and thus is indifferent to contexts and inter-temporal considerations. Topical accounting
leads individual to consider the consequen-ce of possible choiconsequen-ces with regard to a reference level that is determined by the context within which the decision arises. A
comprehensive account incorporates all other
factors including current wealth, future earnings, possible outcomes of other proba-bilistic holdings, and so on.
Economic theory generally assumes that people make decisions using the
com-prehensive account. Consequently,
compre-hensive accounting prevents bidders from falling prey to the winner’s curse. How-ever, behavioural research shows that peo-ple make decisions piecemeal, influenced by the context of the choice, as evident in the following example.
Imagine that you are about to pur-chase a jacket for ($125)[$15] and a calculator for ($15)[$125]. The calcu-lator salesman informs you that the calculator you wish to buy is on sale for ($10)[$120] at the other branch of the store, located 20 minutes drive away. Would you make the trip to the other store?
(Tversky & Kahneman, 1981).
This problem consist of two choices; one with the figures in parentheses and the other with the figures in brackets. Experi-ments on two separate groups found that on the choice of saving $5 of $15 calculator, 68 percent of the participants were willing to make the 20 minutes journey; while only 29 percent were willing to make the trip to save the same amount on a $125 calculator.
Mental accounting may explain the cognitive processes that lead to the win-ner’s curse in the laboratory context. In ex-periments that report the winner’s curse, e.g., Kagel and Levin (1986) and Knetsch, Tang & Thaler (2001), subjects have to make decision about the amount of bid over a series of bidding session which con-sist of around 18 bidding rounds within one to three hours. The physiological sen-sations of winning or losing a bid that are felt by subjects from a previous round may influence the decision in the subsequent round. If the assumption that individuals use topical accounting when bidding is valid, then the value of vij – bij of winning
after being adjusted to price and volume difference between sessions. In other words, the physiological sensations elicited in the previous session is carried through, and influences the decision in, the subse-quent session. The level of carry-over effect is the function of adjustment to loss or gain in the former session, which, in turn, might be influenced by time lag between bidding sessions. Hence, it can be hypothesised the longer time between session the less carry-over effect. However, this is not the focus of this study.
The lack of significance of the correla-tion may indicate the use of minimal or comprehensive account, particularly if the average vj – bj, close to zero, in which j=1,
…, m rounds. However, this condition also
implies that there is no winner’s curse. That is, evidence of the winner’s curse may indi-cate that bidders were not using minimal or comprehensive account.
Minimal accounting can be discrimi-nated from comprehensive accounting by introducing inter-temporal utility of choice. The reason for this is that insensitivity to contexts would prevent individuals from contextual bias in their decisions, so that its effect on a single case decision it can not be distinguished from comprehensive. The introduction of inter-temporal utility will result in stronger correlation with strategic equilibrium bids when bidder use compre-hensive account rather than minimal ac-count. However, this research is not aimed at discriminating between the use of mental account of inter-temporal choice.
Hypothesis 2: Subjects use topical account rather than minimal or comprehensive account when making decision about the amount of bid.
The distinctive feature of prospect the-ory is the S-shaped value function, which
implies that individuals are loss-averse. It means that the psychological consequence of the prospect of losing $X is felt more in-tensely than the same prospect of gaining the same amount of dollar. Consequently, individuals are risk-seeking in contexts, that impose them with a probability of loses; while they prefer avoiding risk to as-suming higher degree of risk even though it may give them higher expected outcomes (Kahneman & Tversky, 1979; Tversky & Kahneman, 1991).
The evidence of loss-aversion that might be observed in laboratory auctions could arise from two factors. Loss-aversion results from topical accounting, especially if intervals between bidding sessions are not long enough for individuals to make ad-justment to physiological arousal following the experience of losses or gains in previous bidding sessions. The emotional spill-over from the previous session implies that the result from the former session is used as the reference point in the subsequent session. Any session implies loss or gain, but loss leads to risk-seeking while gain leads to risk-aversion, therefore the direction of the correlation coefficient of vij – bij and vij+1 –
bij+1 indicates the evidence of loss-aversion.
It can be predicted that a loss in bj will be
followed by higher vij+1 – bij+1, that turns to a
positive correlation; while gains in bjwill be
followed by lower vij+1 – bij+1, or negative
correlation.
Method
Subjects
Fifty eight subjects were used in the present experiment. They were recruited among undergraduate students of the Fac-ulty of Psychology, Gadjah Mada Univer-sity, Indonesia (GMU). Participation in the experiment was voluntary and independ-ent of any class assignmindepend-ent.
Procedure
Prior to the experimental auction rounds, subjects were briefed about the procedure of the experiment. A three rounds auction was also practised, and subjects discussed and confirmed their un-derstanding about the tasks they asked to perform. Subsequently, those who agreed to participate signed an informed consent
form. However, two subjects withdrew
during the session.
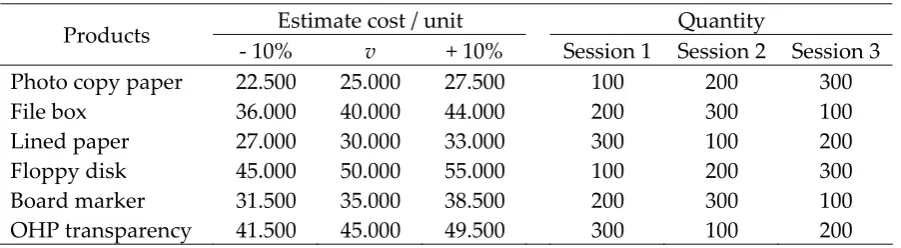
The setting was a contract tender for office supplies to GMU. In total 18 contracts for six kinds products were tendered on 18 bidding sessions. Participants were in-formed about the quantity and production costs for each product that was offered, an +/- 10% from the estimate costs. The real production cost was drawn randomly, by rolling a dice, after subjects submitted their bids. Table 1 summarises the estimate costs and quantity per product in each session.
The tender was organised in three ses-sions, 6 bidding rounds each, with a short break (10 minutes) between sessions. The minimum incremental offer was 50, and the lowest bid wins. If there were more than one winner, the contract was divided evenly between winning bidders. Loss and gain were computed by the following equation: (bid - production cost) x quantity.
Positive value means gains, otherwise losses.
The winner of each group was an-nounced along with the amount of its bid. Other bidders’ bids were not announced.
At the end of each session, all subjects who gained a positive balance were given a bonus of Rp. 1,000 that was paid in cash. If they could maintain the surplus through the next sessions, they were given another Rp. 1,000 for each session. Apart from that, an extra bonus was given to each subject who booked a surplus by the end of the ex-periment. The amount was based on the rank in the group. The highest received Rp. 50,000, followed by Rp. 30,000 for the sec-ond highest and Rp. 20,000 for the third highest. The rest of the top ten were given Rp. 10,000, and the 11th – 25th highest
re-ceived Rp. 5,000, and all the other with sur-plus were given Rp. 1,000.
In every round subjects bid in small groups (3-4 bidders) or large groups (7-8 bidders). Assignments to bidding groups were random, and compositions of bidders
Table 1
Summary of cost estimate and quantity per product per session
Estimate cost / unit Quantity Products
on groups were reshuffled from round one to another. Participants were informed about the number of competitors in their group in each round, but not about whom she played against. In other words, subjects knew how many people they competed with, but did not know against whom.
After the briefing and practice sessions, subjects were assigned to two separate groups in two rooms, Group A and Group B,
and they were asked to sit at their seat number. The seats were arranged so that there were one chair in between of two seats. The experiment was run separately, so that there are basically two independent sets of datafrom experiment 1.
Overall, experiment 1 took approxi-mately 2 hours. Almost 1 hour was spent for administrations, briefing and practices. Each session took approximately 2 minutes, plus short break between sessions to an-nounce and eventually to give the bonus.
Results
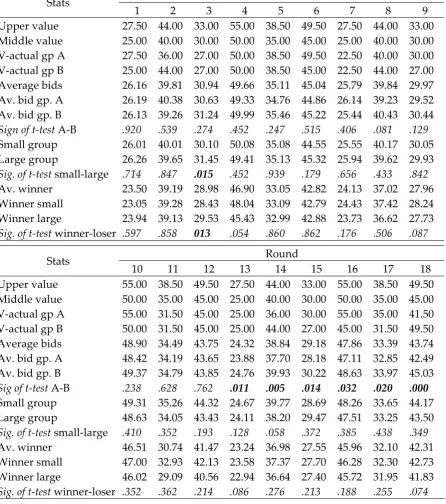
Some descriptive statistics and signifi-cance of between-groups difference are summarised in Table 2. Some terms may need explanations. V-actual is the actual production cost of a product on each round, that was obtained by rolling a dice.
Gp. A refers to subjects with odd-numbered
seats that were assigned to Room A, and
Gp. B are subjects in Room B. All Av-s are
abbreviation of ‘average’.
The table shows that Group A and
Group B did not differ significantly across
the first 12 rounds. The highest and the sec-ond highest coefficients of significance are .081 (F=3.15, df=1) and .129 (F=2.09, df=1) respectively, and the lowest significant co-efficient is .92 (F=0.1, df=1). This indicates the absence of systematic factors that influ-ence bidding behaviours on these rounds, and thus can be treated equally. However,
the difference became significant across the last 6 rounds, with the lowest coefficient at .03 (F=4.82, df=1). In these sessions Group A
consistently bid lower than Group B, that is, they took more risks in their decision than Group B. The tendency toward risk-seeking were also showed in the first two sessions, in which Group A bid less than
Group B in 9 of 12 bidding sessions.
Tests to indicate whether there are systematic influence of the number of com-petitors on bidding decisions were also car-ried out. The result indicates that there is no systematic differences between group sizes in all round, except round 3. In this round, the small groups bid significantly lower than the large group, with p=.015 (F=6.245, df=1). Similar results were found from the comparison of winning bids in small and large groups. The results indicate that winners of large groups were not likely to suffer more or less curses than the win-ners of small groups. It can further be con-cluded that, in general, the size of groups do systematically influence individual deci-sion-making in the context of this experi-ment.
The presentation of the production cost estimates was intended to help participants to find easily the expected value of the bid, which is v or the middle point of +/- 10% on Table 1. If participants were risk-neutral, they would have consistently chosen this point. However, if they wanted to both consider expected gains and the probability of winning, they would have discounted this valuation, so that it may have laid somewhere between the middle point or v
Table 2
Summary of descriptive statistics
Round Stats
1 2 3 4 5 6 7 8 9 Upper value 27.50 44.00 33.00 55.00 38.50 49.50 27.50 44.00 33.00 Middle value 25.00 40.00 30.00 50.00 35.00 45.00 25.00 40.00 30.00 V-actual gp A 27.50 36.00 27.00 50.00 38.50 49.50 22.50 40.00 30.00 V-actual gp B 25.00 44.00 27.00 50.00 38.50 45.00 22.50 44.00 27.00 Average bids 26.16 39.81 30.94 49.66 35.11 45.04 25.79 39.84 29.97 Av. bid gp. A 26.19 40.38 30.63 49.33 34.76 44.86 26.14 39.23 29.52 Av. bid gp. B 26.13 39.26 31.24 49.99 35.46 45.22 25.44 40.43 30.44
Sign of t-test A-B .920 .539 .274 .452 .247 .515 .406 .081 .129
Small group 26.01 40.01 30.10 50.08 35.08 44.55 25.55 40.17 30.05 Large group 26.26 39.65 31.45 49.41 35.13 45.32 25.94 39.62 29.93
Sig. of t-test small-large .714 .847 .015 .452 .939 .179 .656 .433 .842
Av. winner 23.50 39.19 28.98 46.90 33.05 42.82 24.13 37.02 27.96 Winner small 23.05 39.28 28.43 48.04 33.09 42.79 24.43 37.42 28.24 Winner large 23.94 39.13 29.53 45.43 32.99 42.88 23.73 36.62 27.73
Sig. of t-test winner-loser .597 .858 013 .054 .860 .862 .176 .506 .087
Round Stats
10 11 12 13 14 15 16 17 18 Upper value 55.00 38.50 49.50 27.50 44.00 33.00 55.00 38.50 49.50 Middle value 50.00 35.00 45.00 25.00 40.00 30.00 50.00 35.00 45.00 V-actual gp A 55.00 31.50 45.00 25.00 36.00 30.00 55.00 35.00 41.50 V-actual gp B 50.00 31.50 45.00 25.00 44.00 27.00 45.00 31.50 49.50 Average bids 48.90 34.49 43.75 24.32 38.84 29.18 47.86 33.39 43.74 Av. bid gp. A 48.42 34.19 43.65 23.88 37.70 28.18 47.11 32.85 42.49 Av. bid gp. B 49.37 34.79 43.85 24.76 39.93 30.22 48.63 33.97 45.03
Sig of t-test A-B .238 .628 .762 .011 .005 .014 .032 .020 .000
Small group 49.31 35.26 44.32 24.67 39.77 28.69 48.26 33.65 44.17 Large group 48.63 34.05 43.43 24.11 38.20 29.47 47.51 33.25 43.50
Sig. of t-test small-large .410 .352 .193 .128 .058 .372 .385 .438 .349
Av. winner 46.51 30.74 41.47 23.24 36.98 27.55 45.96 32.10 42.31 Winner small 47.00 32.93 42.13 23.58 37.37 27.70 46.28 32.30 42.73 Winner large 46.02 29.09 40.56 22.94 36.64 27.40 45.72 31.95 41.83
Sig. of t-test winner-loser .352 .362 .214 .086 .276 .213 .188 .255 .074
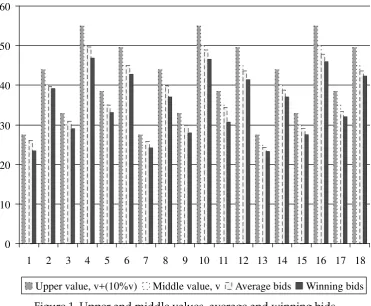
Fig. 1 visualises data of average and winning bids as compared to upper and middle value. It obvious that while average bids are pretty close to the expected utility of bids, so that the lines are almost indis-tinguishable excepts on the last session, the winning bids are significantly lower. This indicates that the curse of winning occurred
0 10 20 30 40 50 60
1 2 3 4 5 6 7 8 9 10 11 12 13 14 15 16 17 18
Upper value, v+(10%v) Middle value, v Average bids Winning bids
Figure 1. Upper and middle values, average and winning bids
The psychological factor that was hy-pothesised by this study was mental
ac-counting. The evidence of the winner’s
curse in this data suggests that subjects were using topical accounts rather minimal or
comprehensive accounts. Section 2 of this
re-port proposed a method to measure the presence of mental accounting from correla-tions between successive bids. In particular,
a topical accounting was argued to appear in
opposite correlational directions among loses and gains contexts. In other words, profits in previous session would have lead a bidder to take lower risk by bidding more conservatively; while loses encouraged the bidder to take more risks.
To substantiate this hypothesis, gains and loses were calculated by subtracting real production cost c at round i from a bidder’s bid b, or bi – ci. Since price
discrep-ancies between products may cause un-equal weights, the value of c was
stan-dardised. Correlations between pairs of successive bids with total data result in 10 and 7 positive and negative correlation co-efficients respectively. Six of these correla-tion coefficients were significant or highly significant. Besides, 2 positive correlation coefficients were below .001 and signifi-cance coefficients of p above .900. This re-sult indicates that there was no systematic relation between pairs of bids when the topical accounting is not taken into account.
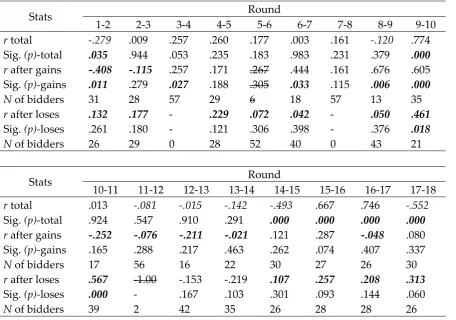
Table 3
Correlation between pairs of successive bids
Round Stats
1-2 2-3 3-4 4-5 5-6 6-7 7-8 8-9 9-10
r total -.279 .009 .257 .260 .177 .003 .161 -.120 .774 Sig. (p)-total .035 .944 .053 .235 .183 .983 .231 .379 .000
r after gains -.408 -.115 .257 .171 .267 .444 .161 .676 .605 Sig. (p)-gains .011 .279 .027 .188 .305 .033 .115 .006 .000
N of bidders 31 28 57 29 6 18 57 13 35
r after loses .132 .177 - .229 .072 .042 - .050 .461
Sig. (p)-loses .261 .180 - .121 .306 .398 - .376 .018
N of bidders 26 29 0 28 52 40 0 43 21
Round Stats
10-11 11-12 12-13 13-14 14-15 15-16 16-17 17-18
r total .013 -.081 -.015 -.142 -.493 .667 .746 -.552
Sig. (p)-total .924 .547 .910 .291 .000 .000 .000 .000
r after gains -.252 -.076 -.211 -.021 .121 .287 -.048 .080 Sig. (p)-gains .165 .288 .217 .463 .262 .074 .407 .337
N of bidders 17 56 16 22 30 27 26 30
r after loses .567 -1.00 -.153 -.219 .107 .257 .208 .313
Sig. (p)-loses .000 - .167 .103 .301 .093 .144 .060
N of bidders 39 2 42 35 26 28 28 26
Analysis on bidding pairs that were preceded by ‘loses’ gave a better result. After 3 bidding pairs were excluded due to insufficient number of cases, 12 correlation coefficients were found in the positive di-rection as predicted, while two correlations were in the opposite direction. This finding supports the notion about loss aversion and
topical accounting in loses contexts.
With regard to affective experiences, it was predicted that, in the absent of the
winner’s curse, the second highest bidder
would have suffered more regret than the lowest bidder. Consequently, the second highest bidder of this round was predicted to take more risk in the subsequent round than the lowest bidder. Table 1 shows that there were three rounds of the experiment where the winner’s curse absent, round 3, 7 and 11. However, quite contrary to the
pre-diction, none of the coefficient of difference were significant. Furthermore, the average of second highest bidders’ bid was higher than the lowest bidders’ bid only in one case, round 8.
Discussion
di-rection of carry-over effects. Specifically, regret over the failure to act in the previous round was predicted to lead bidders to a higher risk-taking in the subsequent round, and topical accounting more prevalent than minimal and comprehensive accounting. The reference dependence utility leads to prediction that topical accounting leads in-dividual to a different risk preference in different contexts, that is, gains and loses contexts.
With regard to the effect of regret, this study failed to find evidence to prove or disprove the prediction. Statistical analysis resulted in no systematic indication about the evidence of the effect of regret on deci-sion-making. However, this was due to limitations in the design of experiment. Subjects were only informed about the highest value on the bidding groups, with no reference to their position among all other bidders. Therefore, subjects might know the highest bid, but they could not ascertain whether their bid was second highest or the lowest. Therefore, reference about the evidence of regret on the subse-quent bidding could not be established.
In general, these predictions about the effect of topical accounting have been con-firmed in this study. The winning bidders in this study suffered the winner’s curse, although the private information effects were omitted and the optimal bidding strategy could easily be identified. Apparently, topi-cal accounting was more prevalent in bid-ders’ cognitive process than minimal and comprehensive accounting. Further predic-tions were also confirmed. Even though systematic relationship between successive bidding pairs were not found when data were analysed as a whole, close examina-tion to different contexts revealed higher accuracy observation. Subjective experience of loses in a round was found to be corre-lated positively with risk taking in the
sub-sequent round in 12 out of 14 successive bidding pairs. On the other hand, such a strong relationship was not found in the context of gains. This finding confirmed the reference dependent utility prediction of prospect theory that individual are loss averse rather than risk-averse. Bidders in this experiment seek more risks when they experienced loss in a previous round, and thus they amplified the possibility of being cursed in the auction.
It needs to be emphasised that ‘loss’ and ‘gains’ in this context were not actual loses and gains. The data were obtained from all bidders in each round, from which only 12 bidders, or in some cases more than 12, were actually have won the tender. Al-though this strategy can be defended by the argument that bidders evaluate their bid-ding strategy round by round, so that they experience the thrill of overbidding or un-derbidding even though they were not the winners, Kahneman and Tversky (1982) assert that the reference point can be de-termined by events that are only imagined. The frustration experienced in an unsatis-factory auction round increases when it is easy to imagine a more desirable alterna-tive. An individual’s experience of pleasure or frustration may therefore depend on an act of imagination that determines the ref-erence level to which reality is compared.
The possible implication of this finding to research on auctions in particular, and behavioural-decision making in general, are quite extensive. This study indicates that temporal aspects of a cycle of decision in-duce bias in individual decision-making. Anomalies that might be found in such an event are therefore not related to irration-ality of the individual as might be evident in the real world. Rather, it is more likely that the design of experiment failed to con-trol carry-over effects of affective experi-ence in the successive decision tasks.
However, the generalisation of this finding needs to be taken cautiously. The temporal dimension on this study has not been varied, therefore variance among dif-ferent scales of time can not be established. Consequently, although this study con-cludes that temporal aspects could be the evil of the laboratory winner’s curse, it can not suggest any measure of the how power-ful is the evil.
References
Bateman, I., Munro, A., Rhodes, B., Star-mer, C., Sugden, R. (1997). Reference-dependent preferences. The quarter
journal of economics, 112, 479 – 506.
Capen, E., Clapp, R., Campbell, W. (1971). Competitive bidding in high-risk situa-tions. Journal of Petroleum Technology,
23, 641 – 653.
Coombs, C.H., Dawes, R.M., Tversky, A. (1970). Mathematical psychology: An
ele-mentary introduction. Englewood Cliffs:
Prentice-Hall.
Dyer, D., Kagel, J.H., Levin, D. (1989). A comparison of naïve and experienced bidders in common value offer auc-tions: A laboratory analysis. The
Eco-nomic Journal, 99, 108 – 115.
Garvin, S., Kagel, J.H. (1994). Learning in common value auctions: Some initial observations. Journal of Economic
Be-havior and Organizatin, 25, 351- 372.
Giliberto, S.M., Varaiya, N.P. (1989). The winner’s curse and bidder competition in acquisitions: Evidence from failed bank auctions. The Journal of Finance, 44, 59 – 75.
Hansen, R.G., Lott, Jr., J.R. (1991). The win-ner’s curse and public information in common value auctions: Comment. The
American Economic Review, 81: 347 – 361.
Johnson, E.J., Hershey, J., Meszaros, J., Kunreuther, H. (2000). Framing, Prob-ability Distortions, and Insurance Deci-sions. In Tversky, A., & Kahneman, D. (Editors). Choices, Values, and Frames.
Cambridge, UK: Cambridge University Press.
Kagel, J.H., Harstad, R.M., Levin, D. (1986). Information impact and allocation rules in auctions with affiliated private val-ues: A laboratory study. Econometrica,
55, 1275 – 1304.
Kagel, J.H., Levin, D. (1986). The winner’s curse and public information in com-mon value auctions. The American
Eco-nomic Review, 76, 894 – 920.
Kahneman, D., Tversky, A. (1979). Prospect Theory: An Analysis of Decision under Risk. Econometrica, 47, 263 – 291.
Kahneman, D., Tversky, A. (1982). The psy-chology of preferences. Scientific
Ameri-can, 246, 136 – 142.
Kahneman, D., Tversky, A. (1984). Choice, values, and frames. American
Psycholo-gist, 39, 341 – 350.
Kahneman, D., Waker, P.P., Sarin, R. (1997). Back to Bentham? Explorations of Ex-perienced Utility. The Quarterly Journal
Knetsch, J.L., Tang, F., Thaler, R.H. (2001). The endowment effect and repeated market trials: Is the Vickrey auction demand revealing? Experimental
Ec-nomics, 4, 257 – 269.
Kusser, A., Spohn, W. (1992). The utility of pleasure is a pain for decision theory.
The Journal of Philosophy, 89, 10 –29.
Luce, R.D., Faiffa, H. (1957). Games and Decisions. New York: Dover Publica-tions.
McAfee, R.P., McMillan, J. (1987). Auctions and bidding. Journal of Economic
Litera-ture, 25, 699 – 738.
Milgrom, P.R., Weber, R.J. (1982). A theory of auction and competitive bidding.
Econometrica, 50, 1089 – 1122.
Read, D., Loewenstein, G. (1999). Enduring pain for money: Decisions based on the perception and memory of pain. Journal
of Behavioral Decision Making, 12, 1 – 17.
Riley, J., Samuelson, W. (1981). Optimal auctions. American Economic Review, 71, 381 – 392.
Roll, R. (1986). The hubris hypothesis of corporate takeovers. Journal of Business,
59, 197 – 216.
Roth, A.E. (1995). Introduction to experi-mental economics. In J.H. Kagel & A.E.
Roth, Handbook of Experimental
Econ-mics. Princeton: Princeton University
Press.
Thaler, R.H. (1992). The Winner’s Curse. In R.H. Thaler (ed.). The Winner’s Curse.
Princeton, NJ: Princeton University Press.
Thaler, R.H. (1999). Mental accounting matters. Journal of Behavioral Decision
Making, 12, 183 – 206.
Tversky, A., Fox, C.R. (1995). Weighing risk and uncertainty. Psychological Review,
102, 269 – 283.
Tversky, A., Kahneman, D. (1981). The framing of decisions and the psychol-ogy of choice. Science, 211, 453 – 458. Tversky, A., Kahneman, D. (1986). Rational
Choice and the Framing Decisions.
Journal of Business. 59, 5251 – 5278.
Tversky, A., Kahneman, D. (1991). Loss Aversion in Riskless Choice: A Refer-ence-Dependent Model. The Quarterly
Journal of Economics, 106,, 1039 - 1061.
Zeelenberg, M. (1999). Anticipated regret, expected feedback and behavioral deci-sion making. Journal of Behavioral